In the Punchcard tab of the Graphs page, you can see a commit summary by day of the week and hour.
Below on the page, you'll find:
- instructions on how to view the Punchcard graph
- a detailed description of all elements
- an overview of the filtering capabilities
For easier navigation, use the Table of Contents at the top-right of the page.
How to view the Punchcard graph
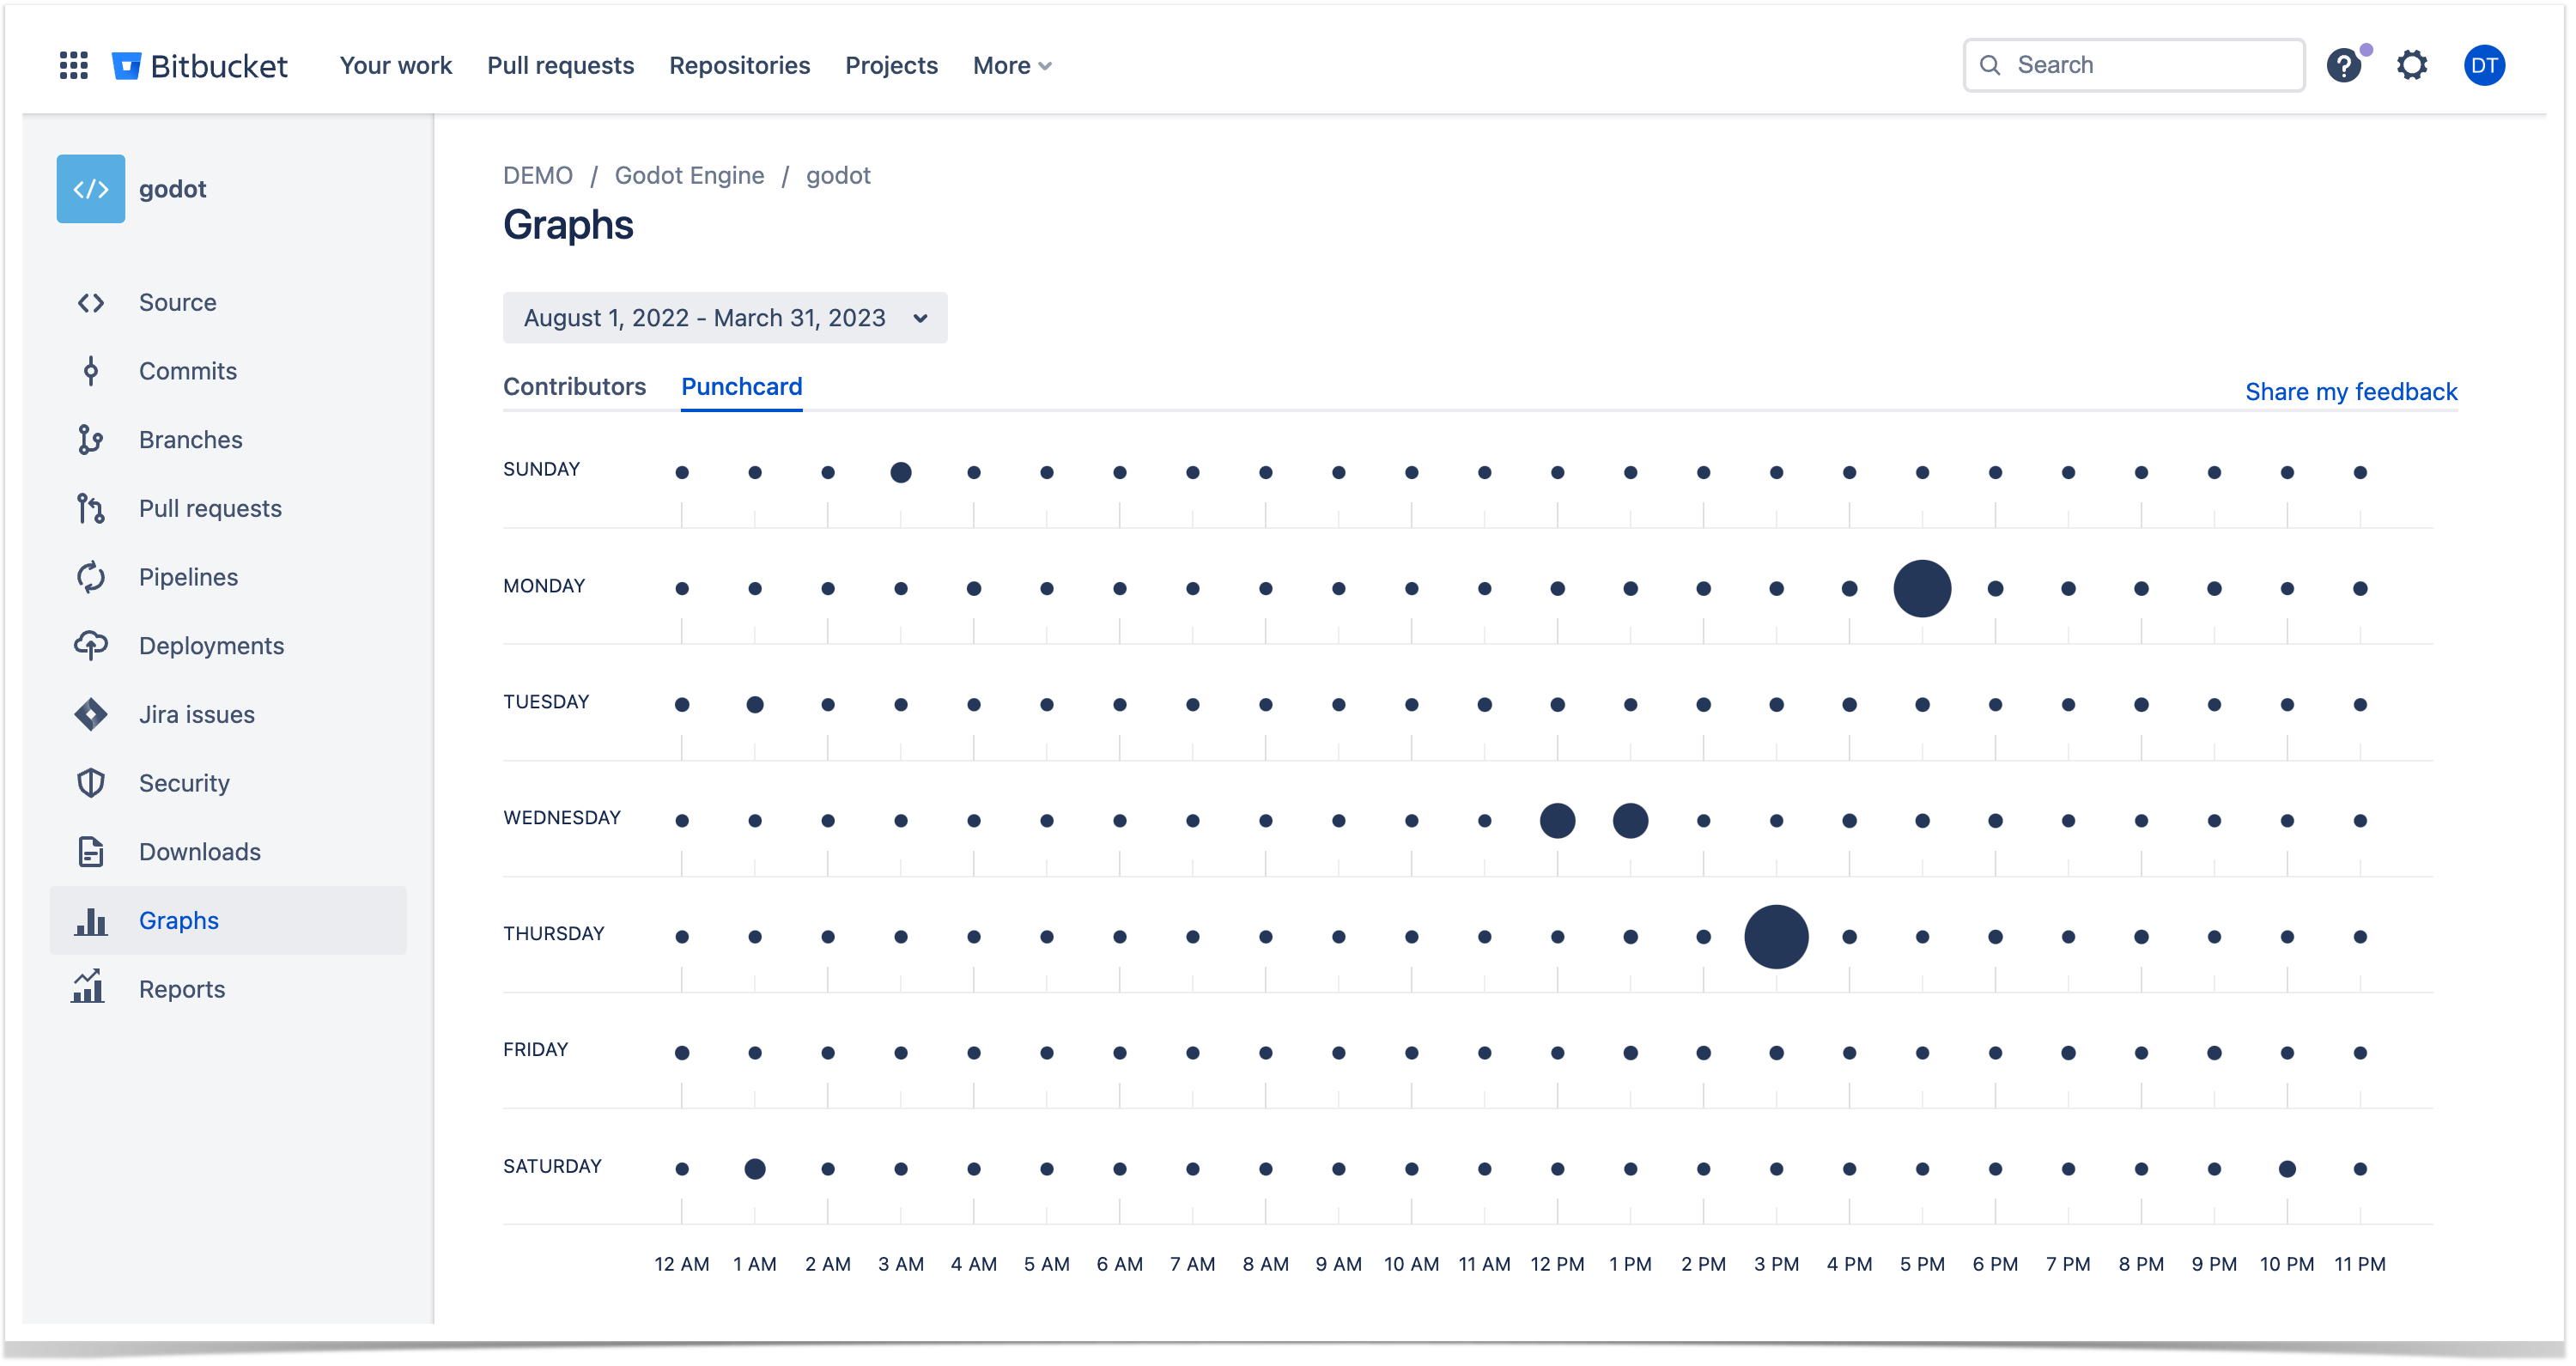
The Punchcard graph is available both on the workspace and repository levels. To view the Punchcard graph:
- Navigate to the repository or workspace of your choice.
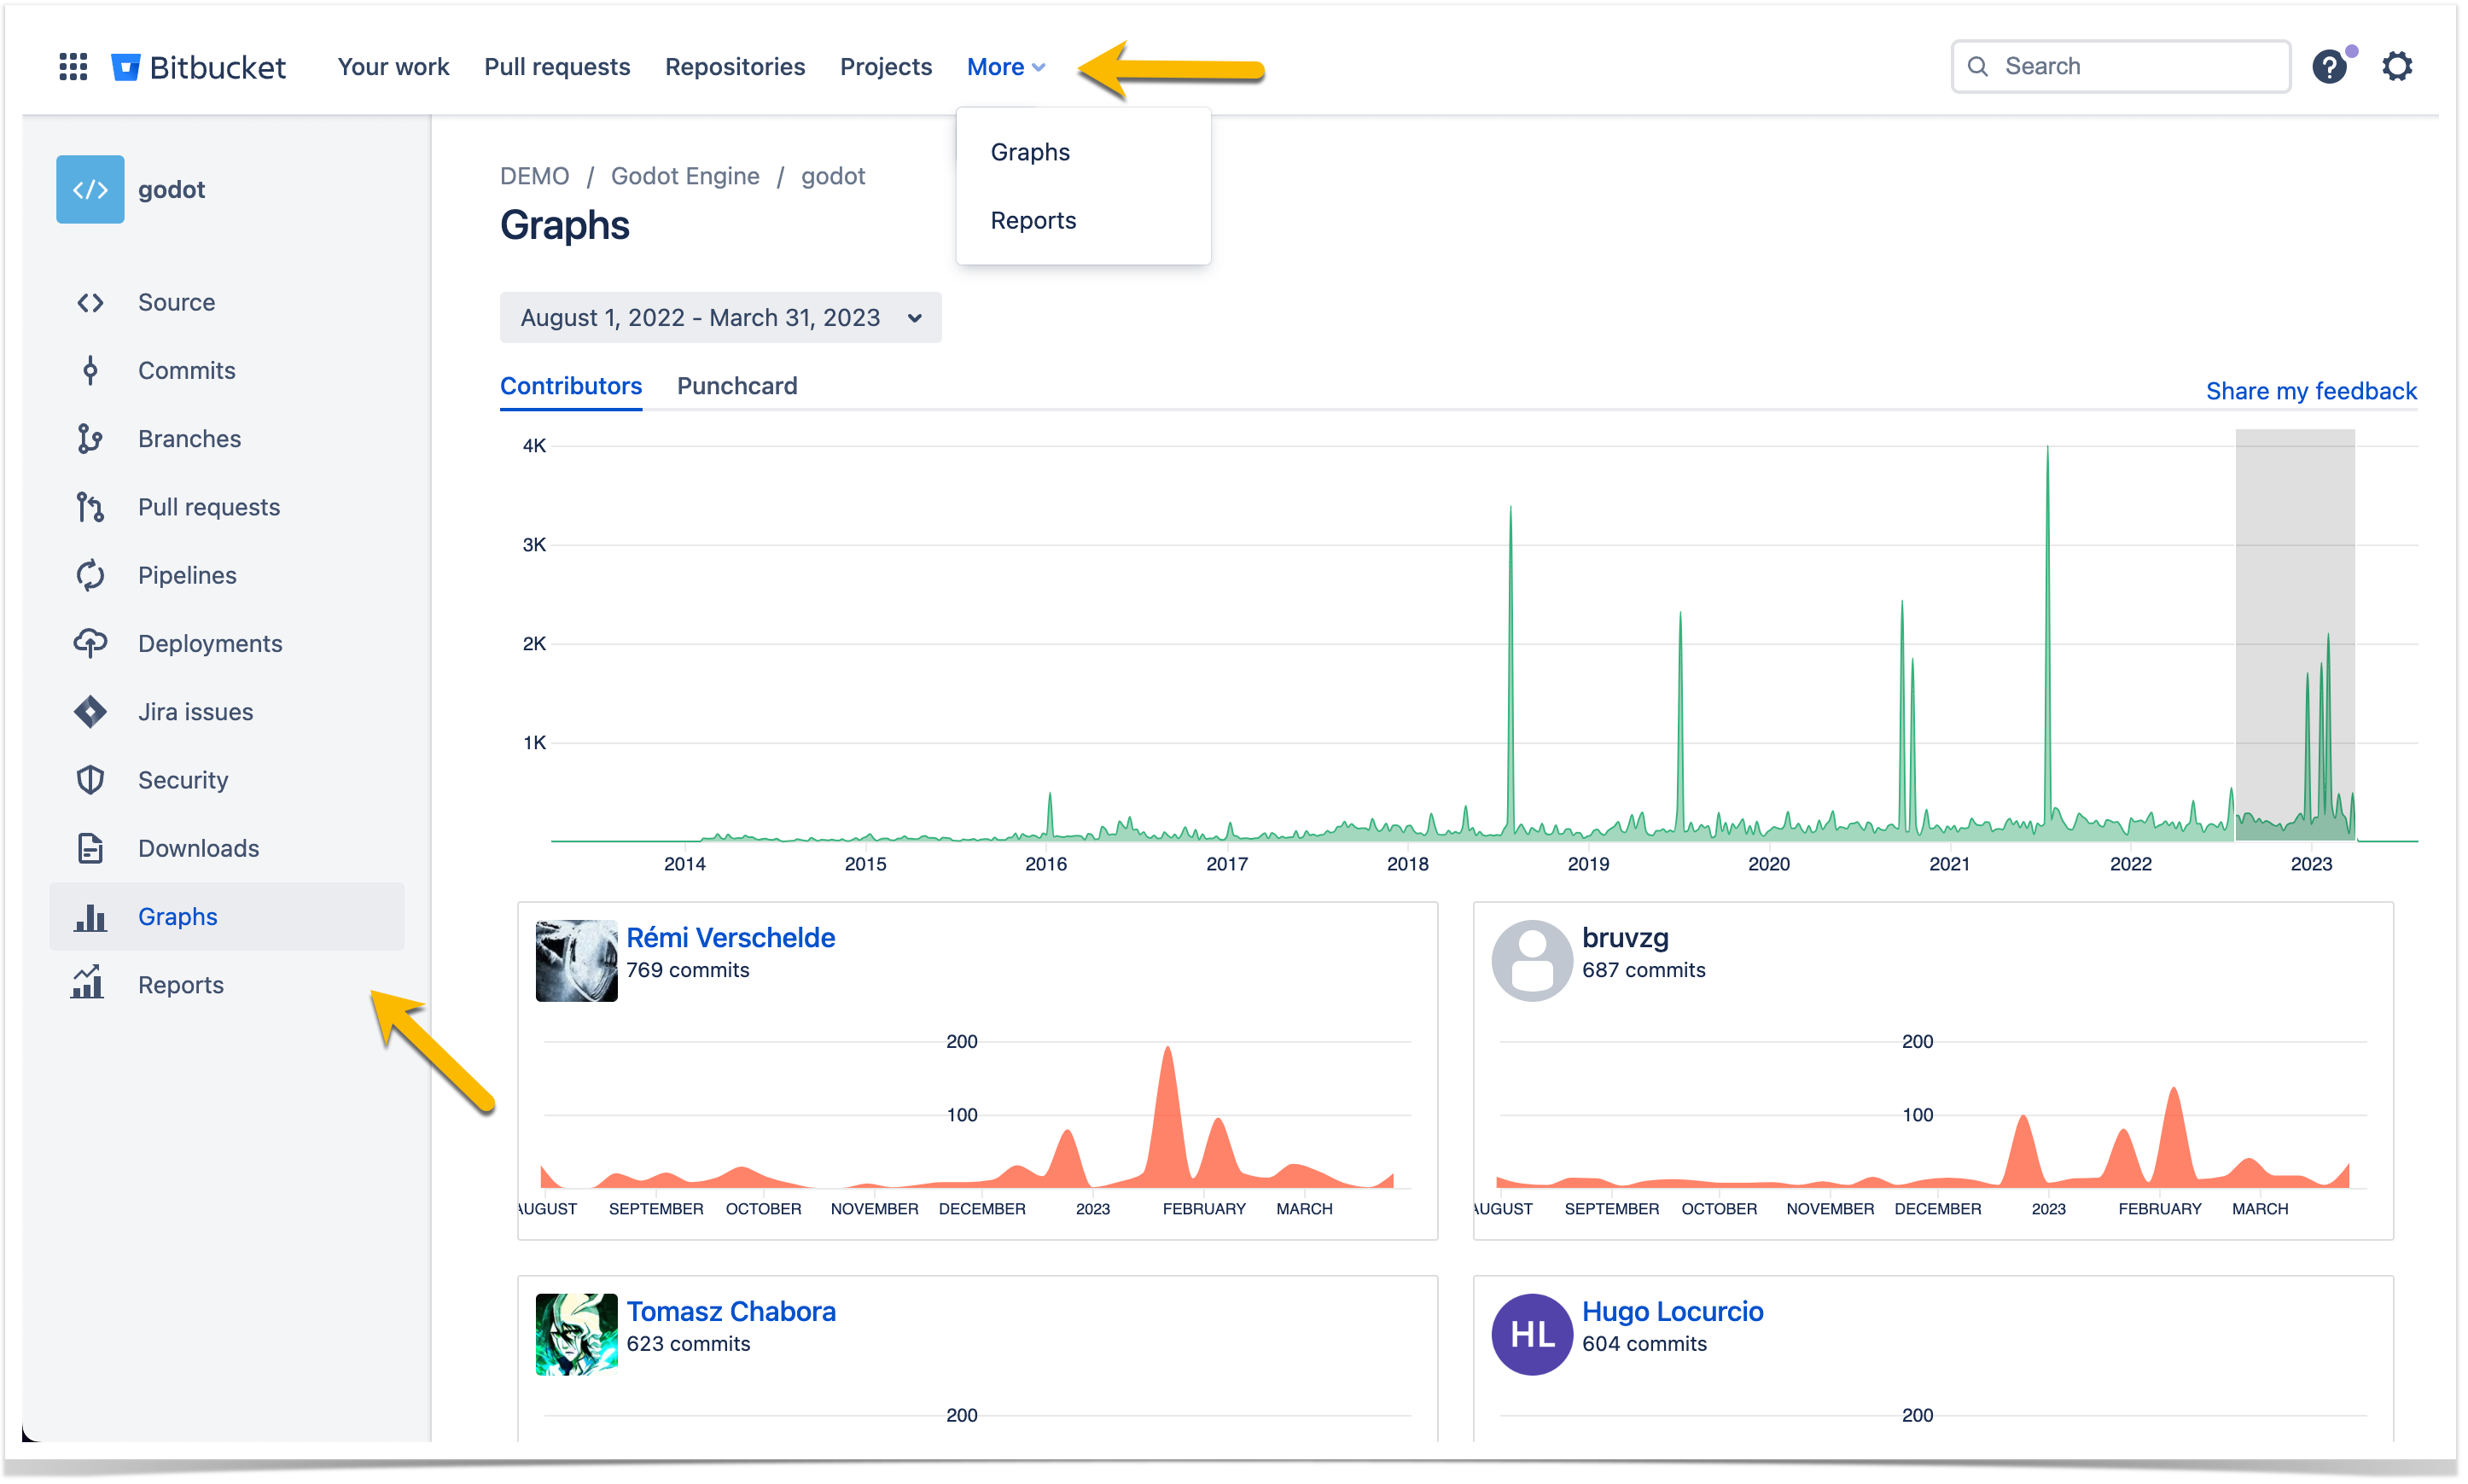
- Click on the Graphs icon in the left-hand sidebar for repositories or More → Graphs in the header for workspaces.
- Choose the Punchcard tab.
Analyze the distribution of commits by time
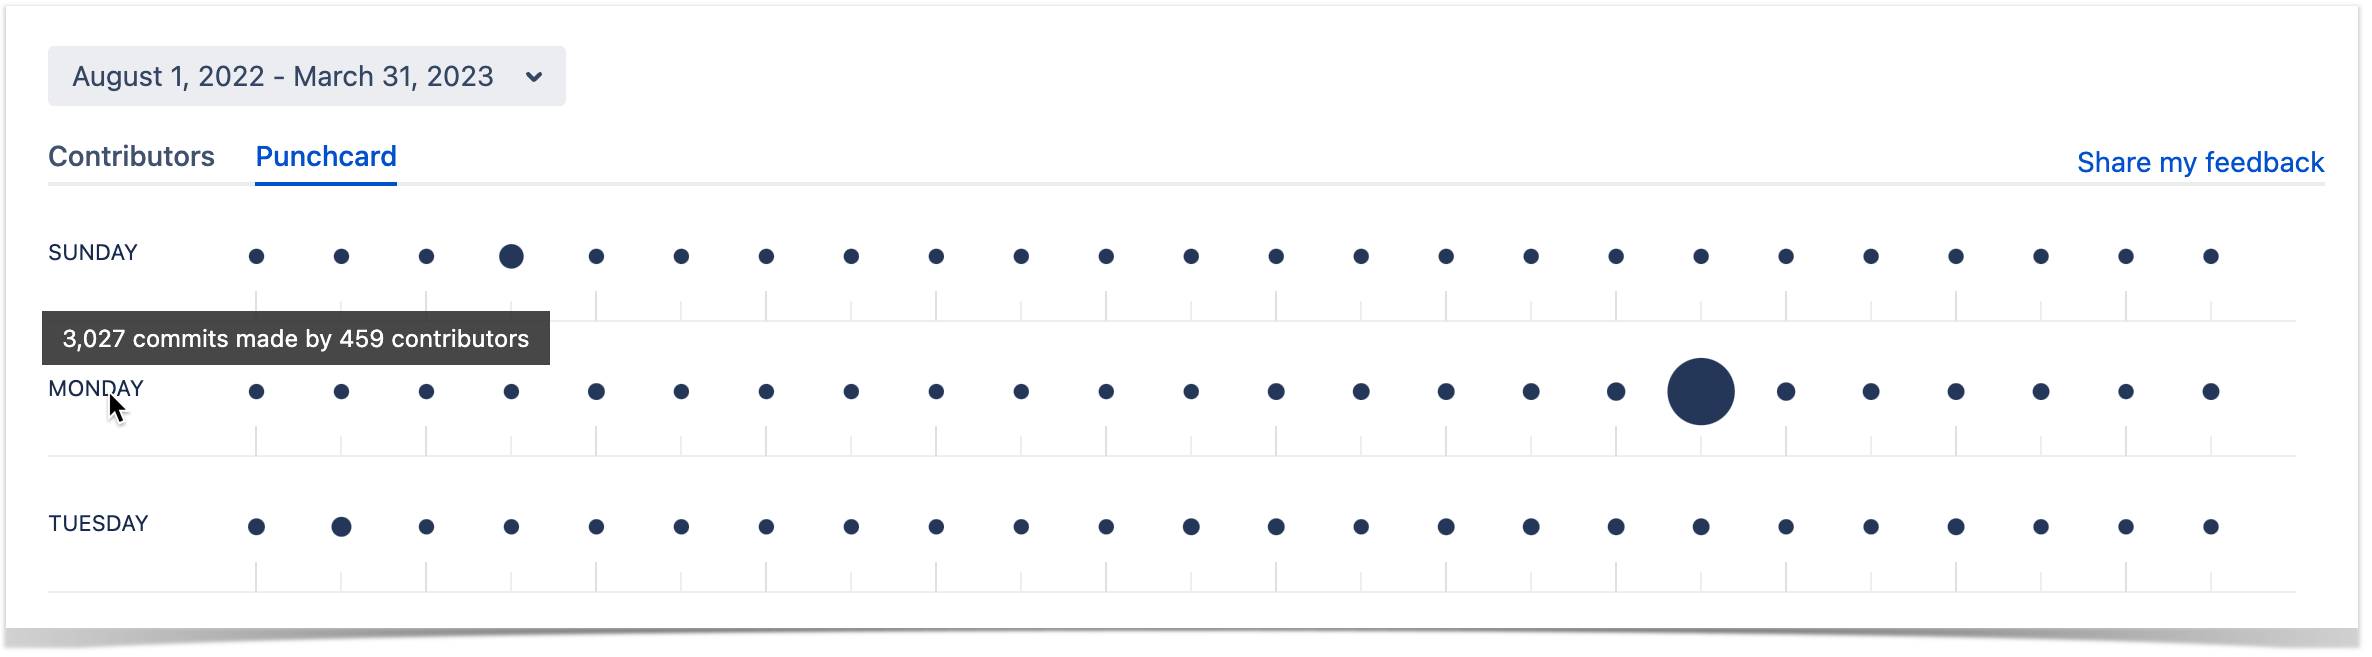
The Punchcard graph visualizes the distribution of commits by day of the week and hour.
Hovering your mouse over a circle will display the exact number of commits made during that hour on that day.
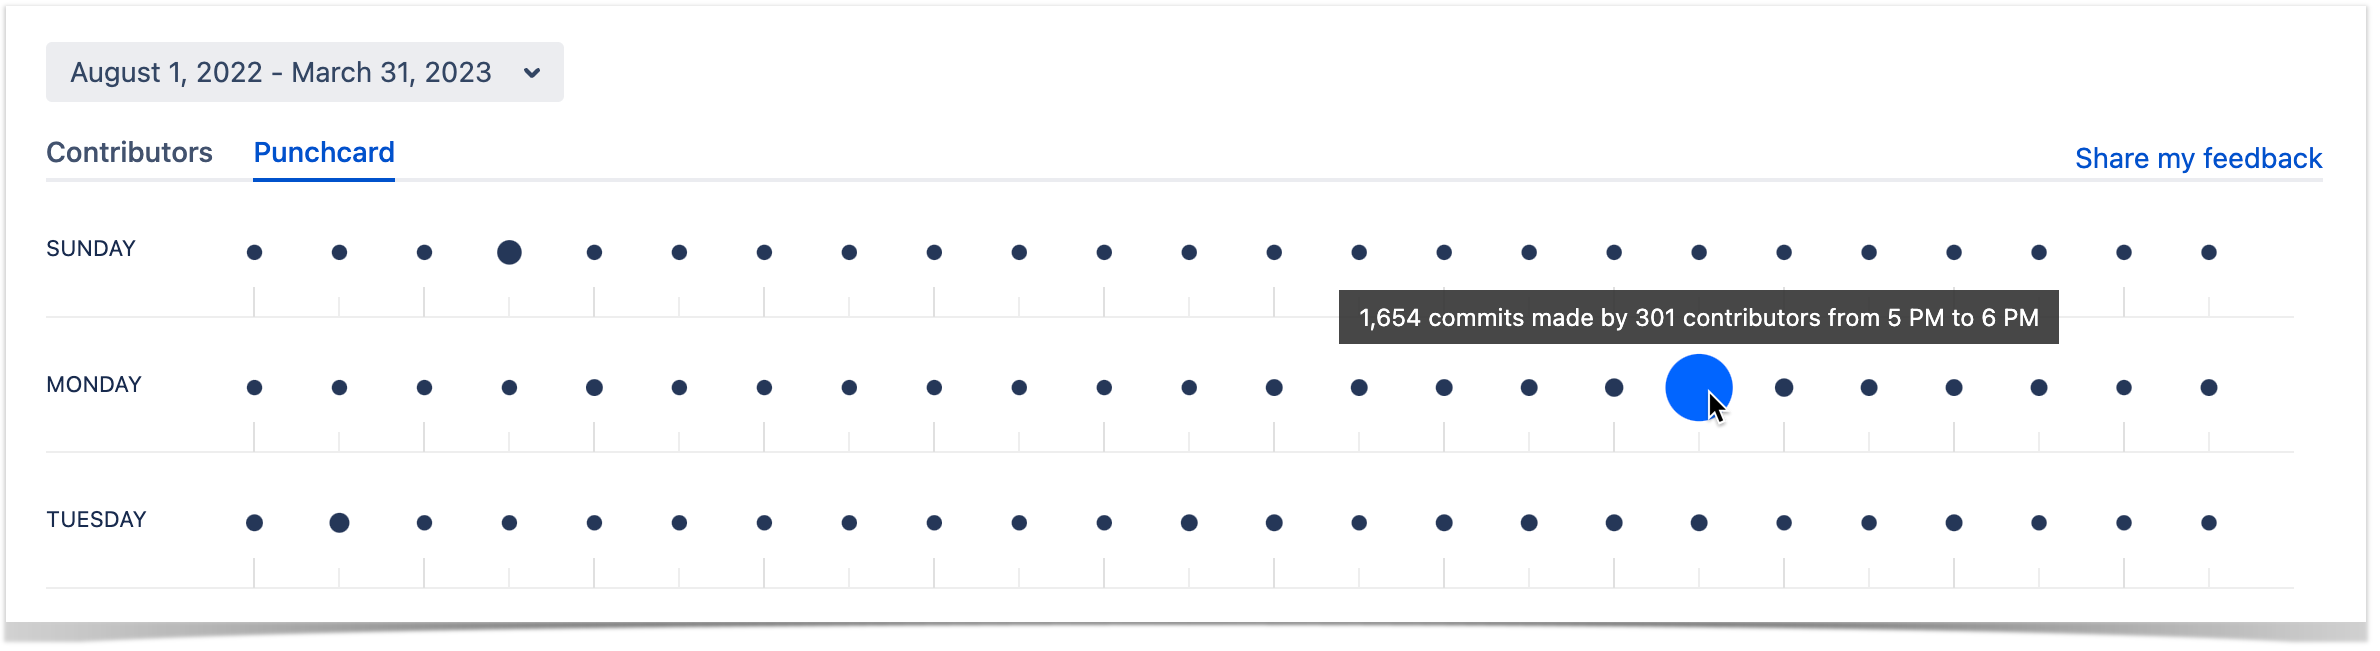
If you hover over a day of the week, you'll see how many commits were made on that day.
Filtering the displayed data
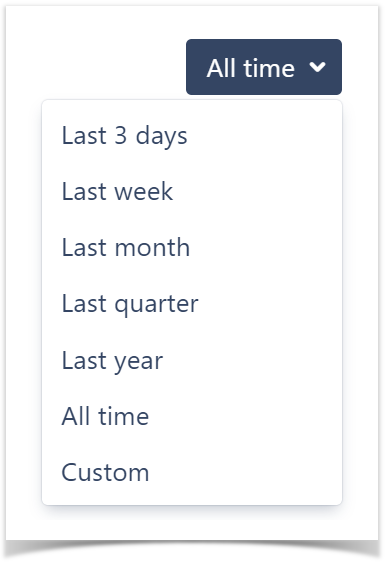
You can filter all the information displayed in the Punchcard graph by period.
Track the activity over a certain period
To select a time period for your Punchcard:
- Click the Time Span selection button.
- Select one of the options or click Custom to set a custom time span.