Awesome Graphs for Bitbucket provides illustrative graphs and charts to visualize the contribution statistics in your workspaces and repositories. You get analytical data for monitoring, reporting, and planning.
Using it, you can:
analyze team's performance
figure out when your team is usually most productive
see the dynamics of commit activity of each contributor over time
evaluate the efficiency of each contributor
How to install the app
During installation, you'll be requested to give Awesome Graphs access to read repositories and their pull requests, and account information, and also to read and modify repositories' webhooks. Please, refer to Privacy Policy to learn why.
Awesome Graphs app can be installed into Bitbucketon a workspace levelby a user who holdsadmin rightsto this workspace. There are 3 ways to approach the installation process:
Bitbucket Settings (recommended)
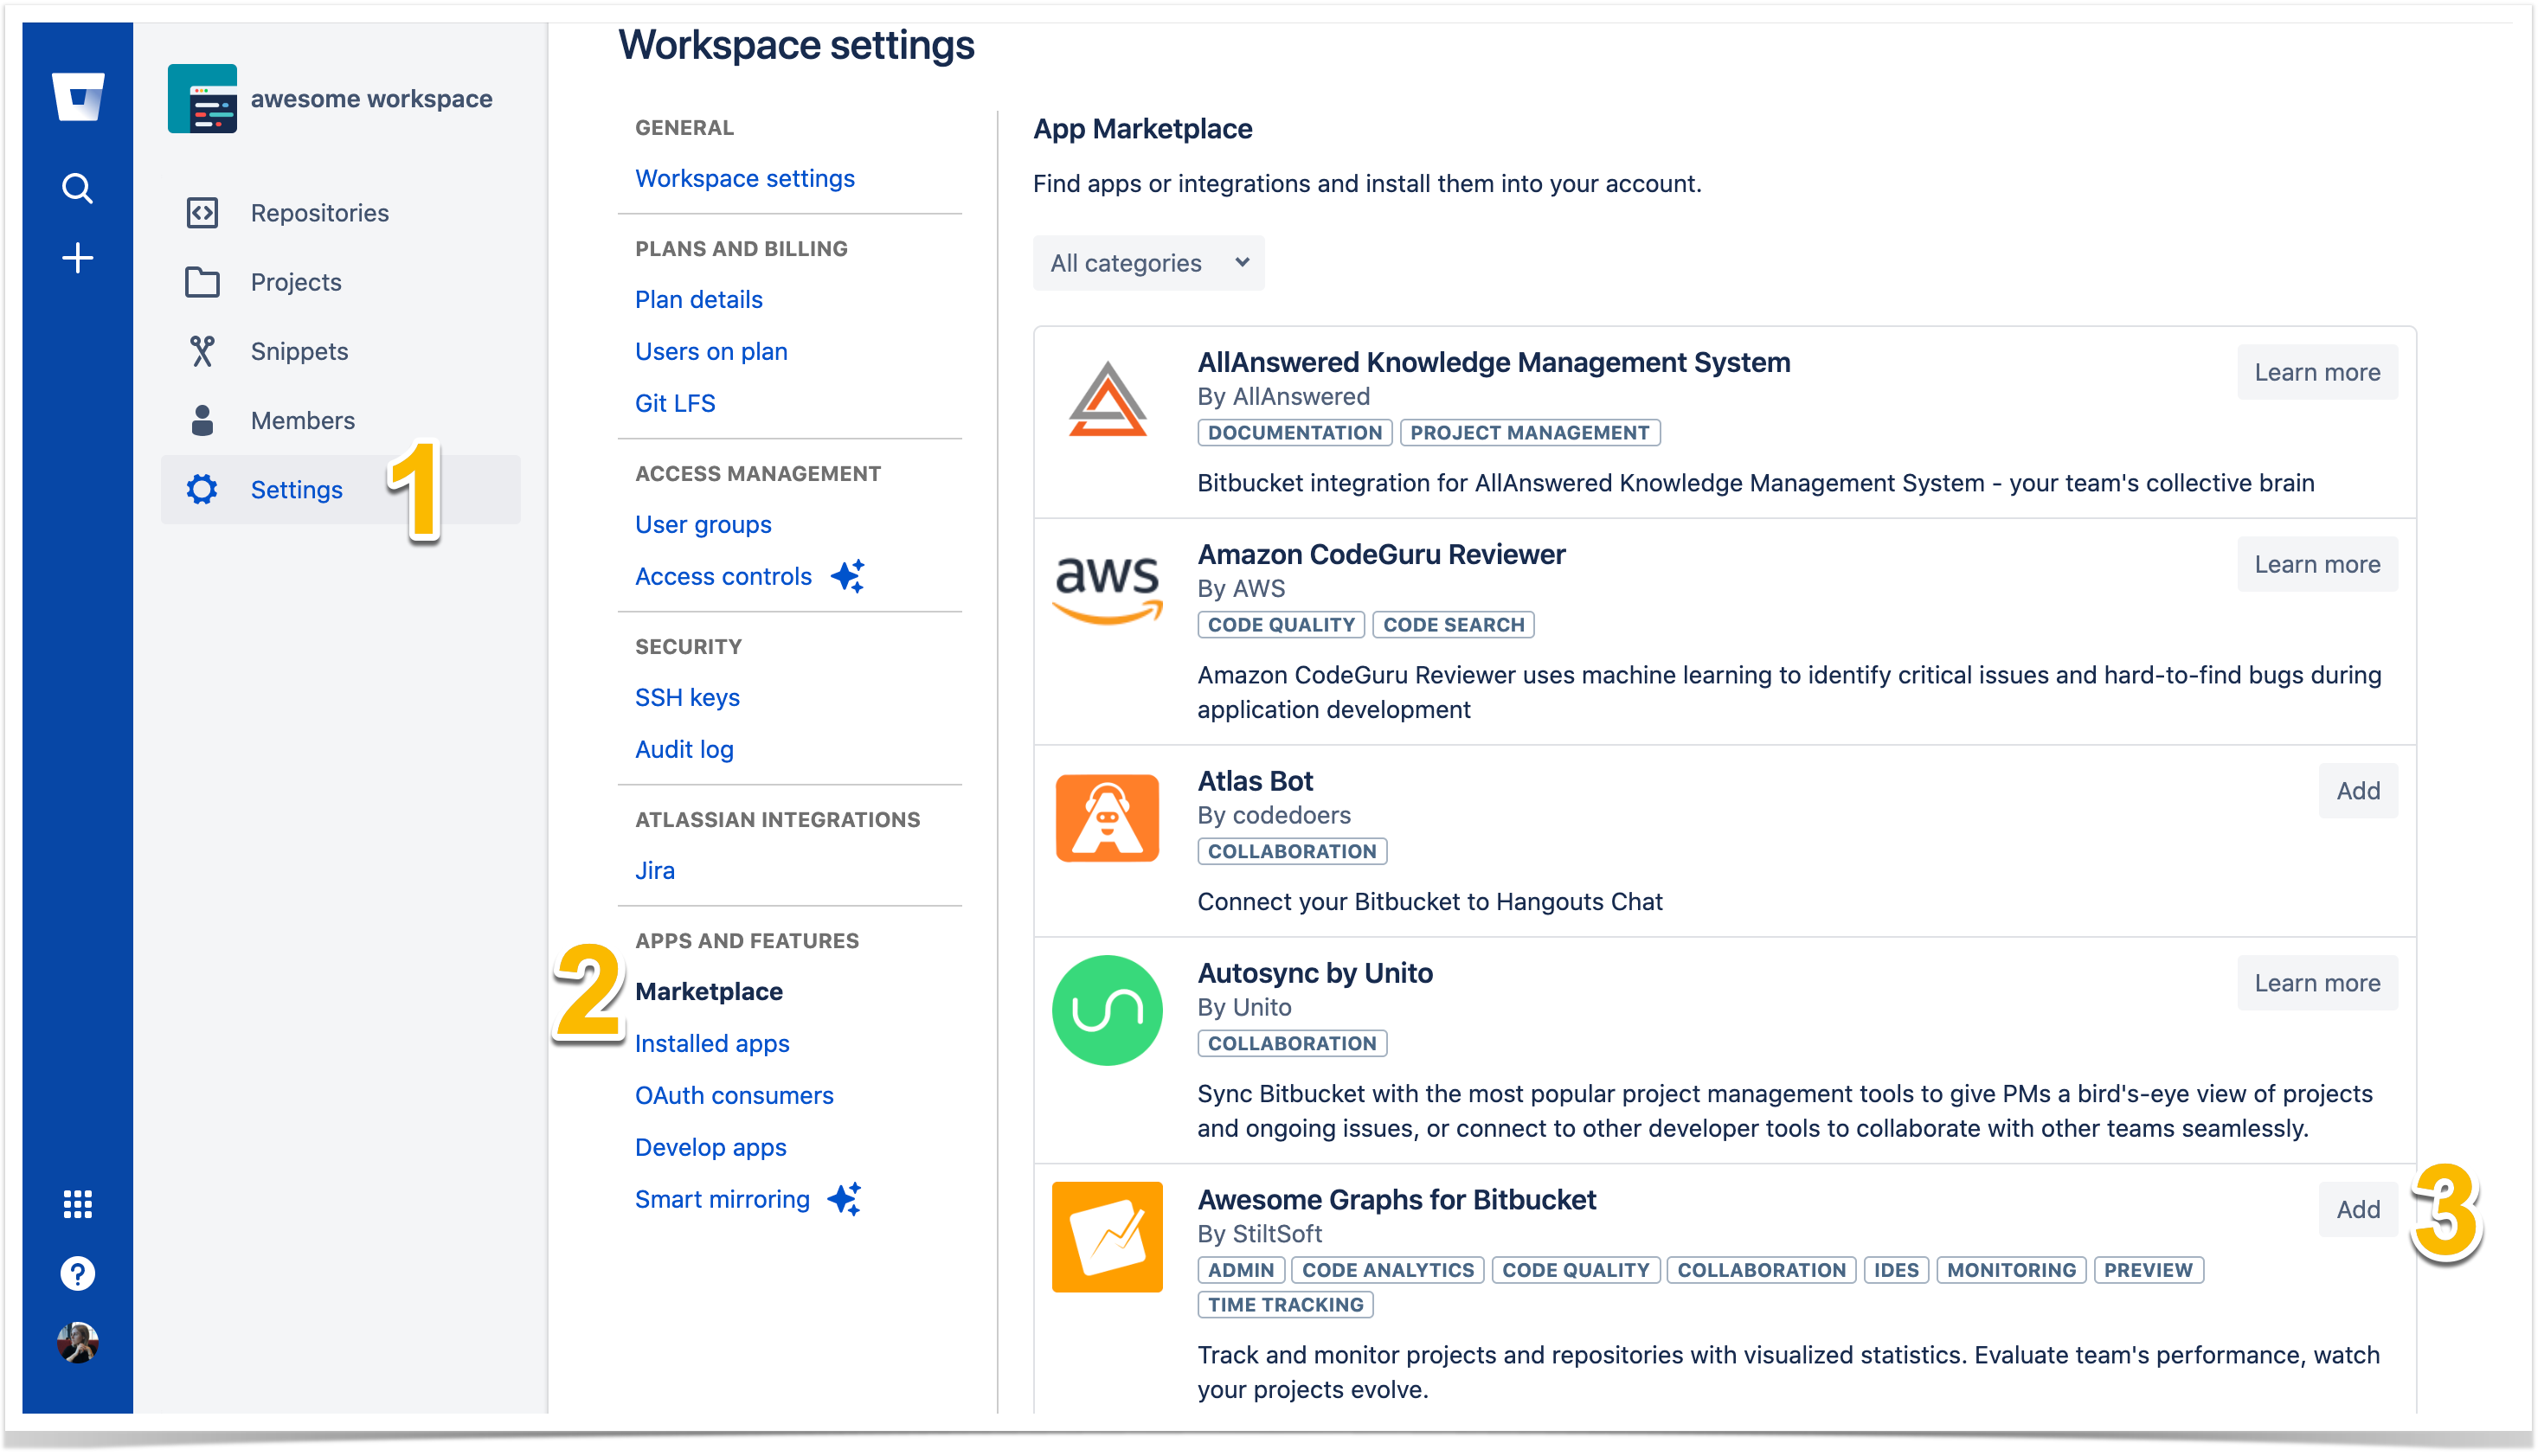
Open the settings of a workspace you want to install Awesome Graphs into by clickingSettingsin the left sidebar.
ClickMarketplaceunder the Apps and Features section.
LocateAwesome Graphs for Bitbucket in the list and clickAdd.
Once in Bitbucket, make sure that you are located in the correct workspace.
Click Add or switch to the correct workspace and follow the instructions here (ссылкаBitbucket Settings)
How to use the app
After the initial indexing is finished, you can use the Awesome Graphs for Bitbucket to its full potential. The app provides you with a set of commit graphs and reports to analyze activity in your workspaces and repositories. You can learn more about each one on the Commits Analytics page.
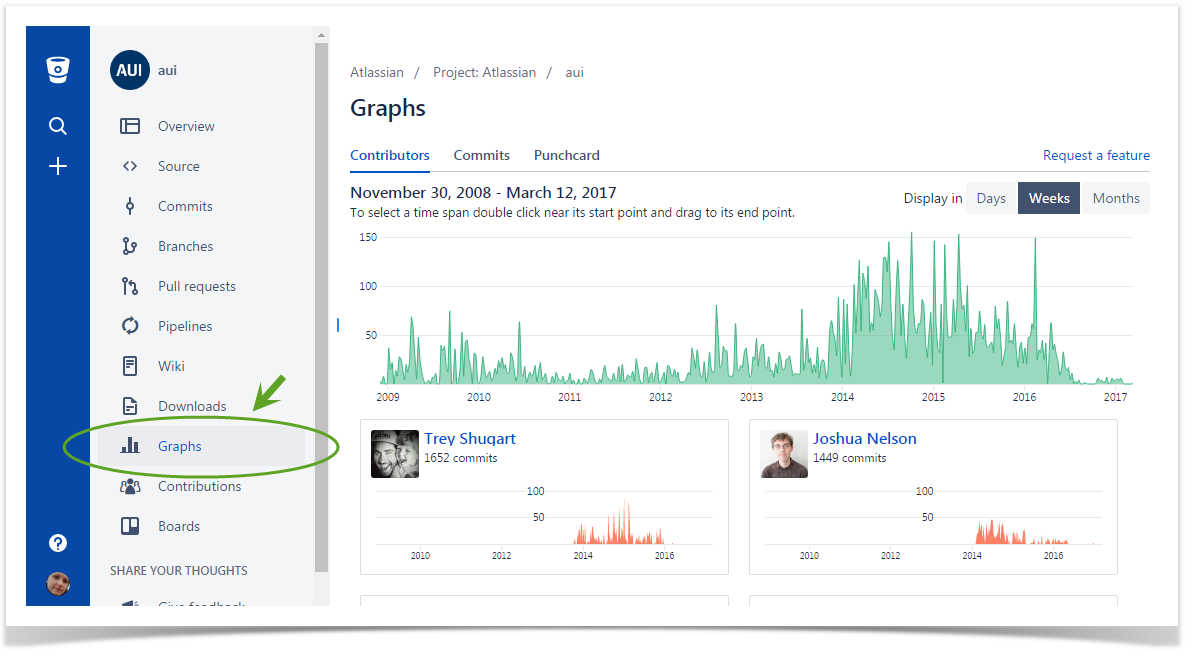
How to get to the Graphs page
To access the graphs, you need to go to a workspace or a repository in Bitbucket you'd like to examine and click on theGraphsicon in the navigation bar.
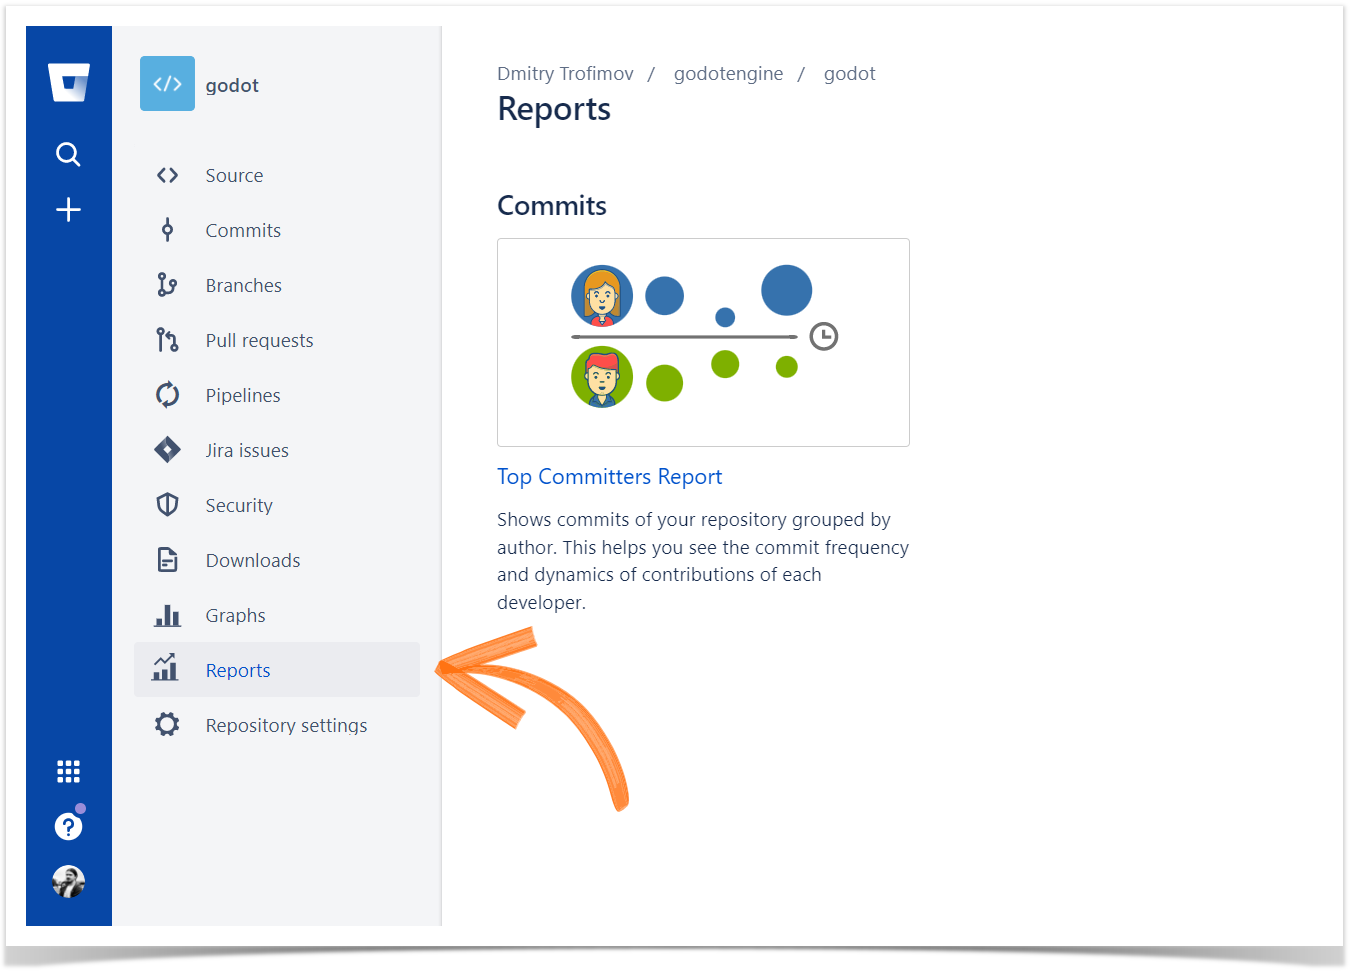
How to get to the Reports page
To access the reports, you need to:
Navigate to the workspace or repository in Bitbucket you'd like to examine.
Click on theReportsicon in the left-hand sidebar.
All graphs will be available for all users with access to the workspace after the initial indexing.
Cookie Notice
This website uses cookies for analytics, personalization and advertising. By continuing to browse, you agree to our use of cookies. Learn more