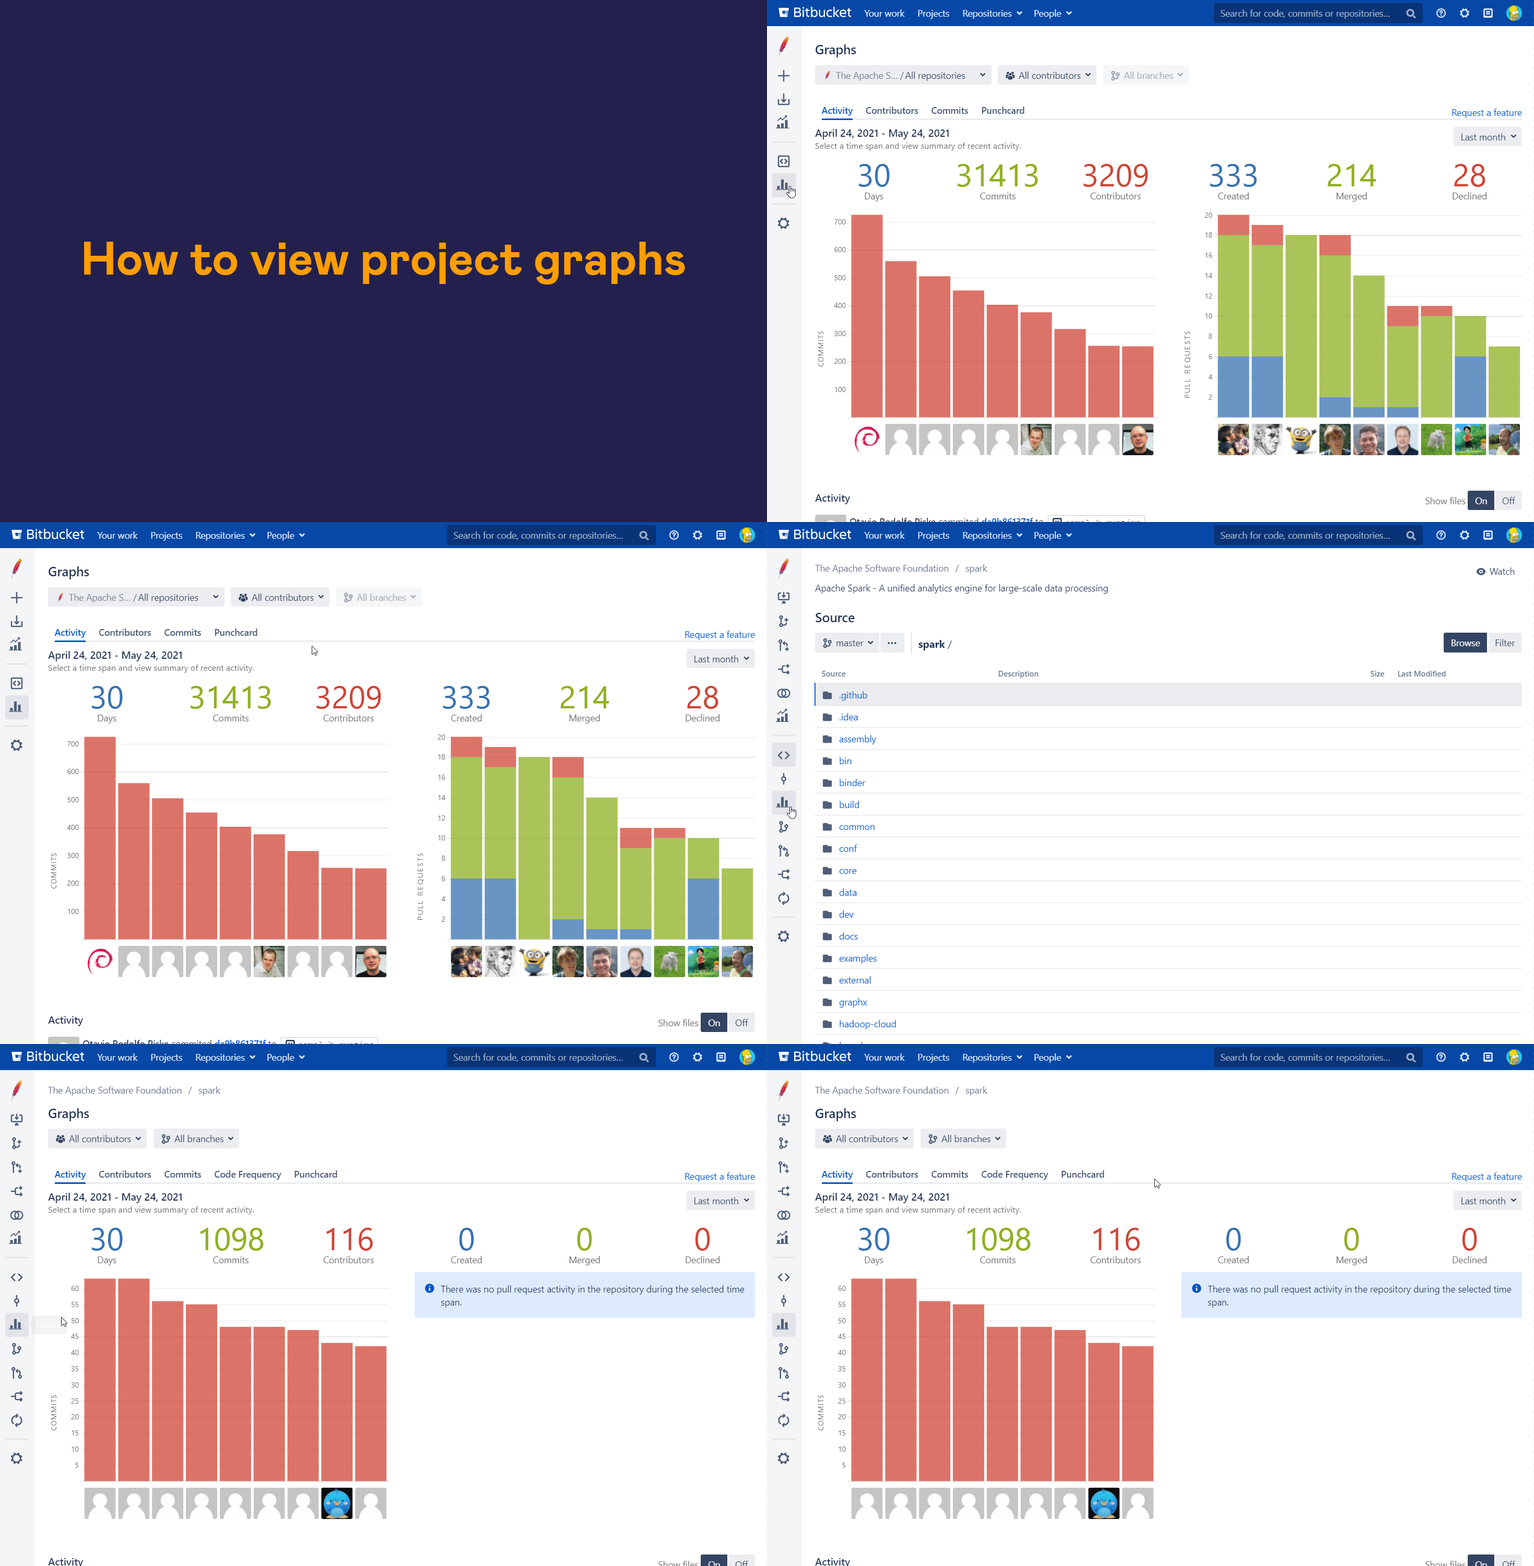
Awesome Graphs for Bitbucket provides you with visualized statistics so you can evaluate teams' performance, track process improvements, and deliver products faster by eliminating guesswork.
How to set up the app
- Install the app from the Marketplace.
- Wait for indexing to finish.
- You are all set! The app doesn't require any additional configuration.
As new Server app installs are no longer available on Atlassian Marketplace, you can buy or generate a trial Data Center license and install it on your Bitbucket Server. They are compatible, and all functionality will be available.
How to use the app
The Awesome Graphs for Bitbucket app gives you a set of features to analyze activity in your repositories and projects, get a global overview and track the activity of particular users.
Commits Analytics
Using the Graphs page you can:
- Track the recent activity in your projects and repositories.
- Watch project dynamics in terms of lines of code.
- Analyze trends and compare the input from different people.
- Track a team/developer activity by day of the week and hour of the day.
Learn more about each of the graphs on the Commits Analytics page.
How to get to the Graphs page
To access the graphs, you need to go to the project or repository in Bitbucket you'd like to examine and click on the Graphs icon in the navigation bar.

Pull Requests Analytics
Using the Reports page you can:
- See the breakdown of pull requests by author, reviewer, state, or destination branch.
- Track the dynamics of your project or repository development.
- See the trends, analyze and predict with detailed resolution time statistics.
- Analyze the code review process and find the most active reviewers.
Learn more about each of the reports on the Pull Requests Analytics page.
How to get to the Reports page
To access the reports, you need to go to the project or repository in Bitbucket you'd like to examine and click on the Reports icon in the navigation bar.

Global Analytics
The app also offers a set of features to analyze activity and get a global view across all repositories and projects:
- Contributions — a developer calendar with user activity (commits and pull requests) from all repositories.
- People — a global view of developers' activity with exporting capabilities.
Learn more about each feature on the Global Analytics page.
Export and Integrations
You can export engineering data for further integration, organization, and processing in analytics tools and custom solutions:
- Export to CSV — with commits, lines of code, and pull requests over the whole Bitbucket instance.
- REST API — automate your workflow and build custom reports.
Learn more about each feature on the Export and Integrations page.