Pie Chart Report allows you to see the breakdown of pull requests by author, reviewer, state, or destination branch.
Below on the page, you'll learn:
- how to view Pie Chart Report for projects and repositories
- how to configure the report
- how to read the report
For easier navigation, use the Table of Contents at the top-right of the page.
How to view Pie Chart Report
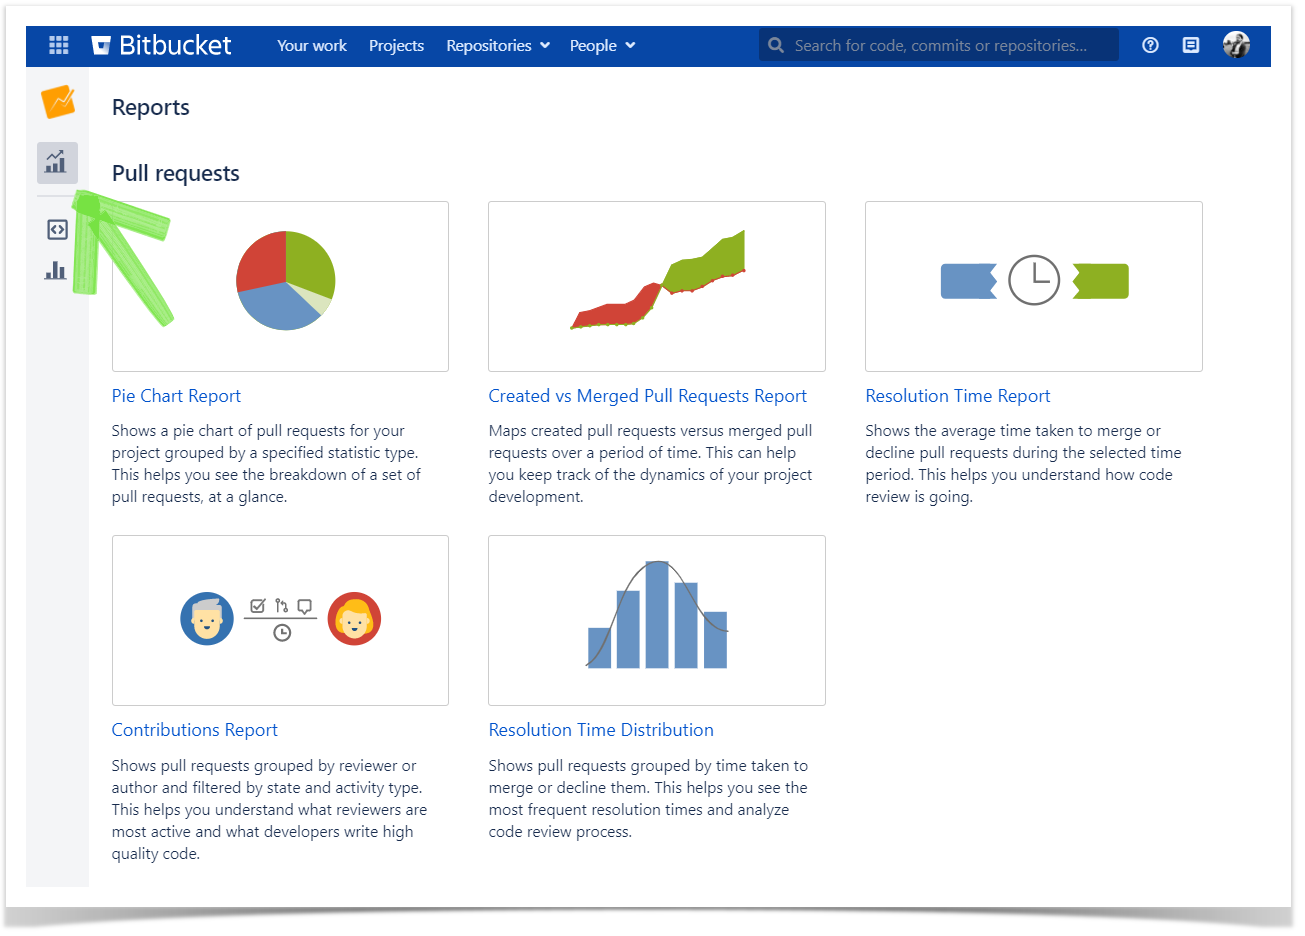
Pie Chart Report is available both on the project and repository levels. To view Pie Chart Report:
- Navigate to the project or repository of your choice.
- Click on the Reports icon in the left-hand sidebar.
- Choose Pie Chart Report in the Pull Requests section.
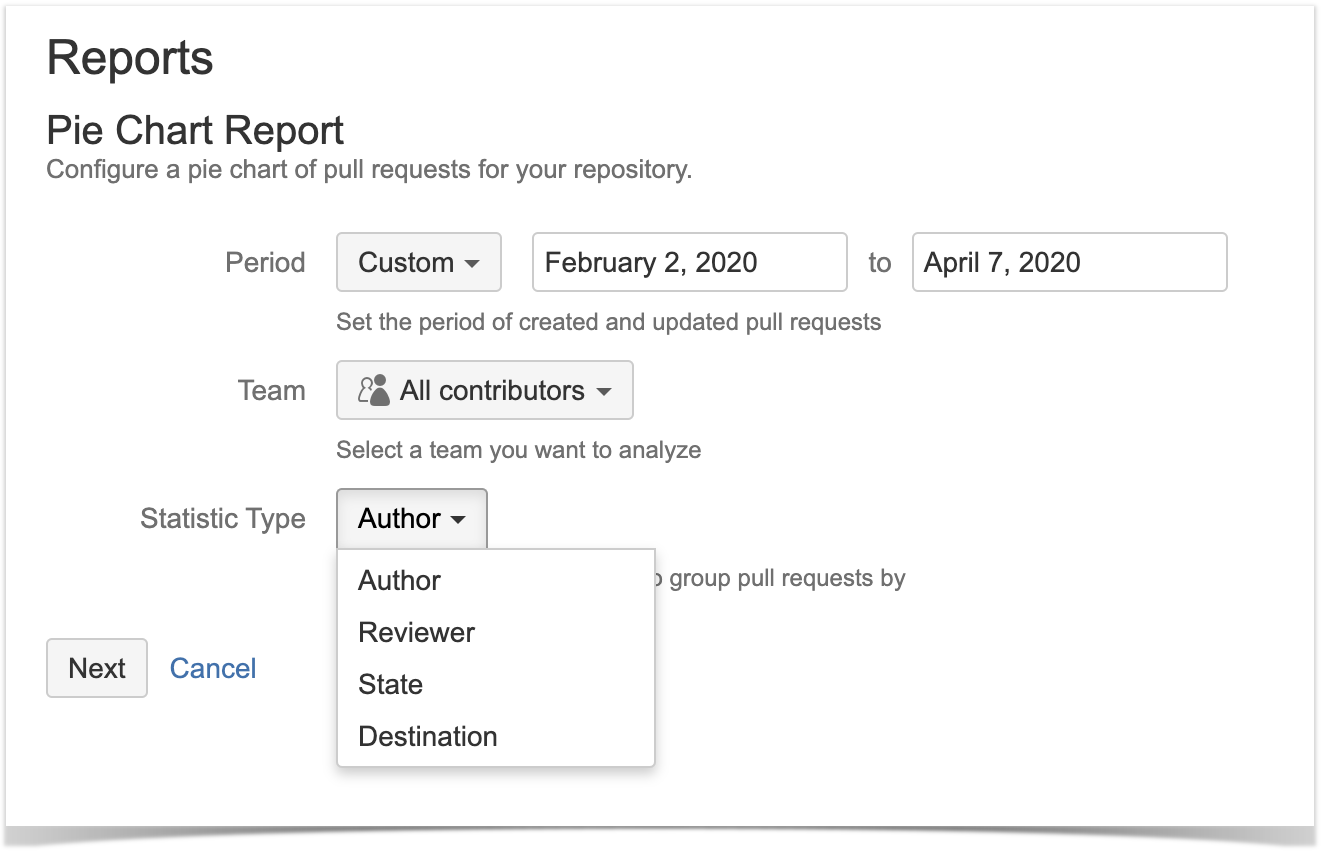
- In the Period fields, choose the time frame. The report will include pull requests that were created and updated within this time frame.
- If you want to see the report for a particular team, choose its name using the All contributors dropdown menu in the Team field. Read more about teams here.
In Statistic Type, select how to group pull requests.
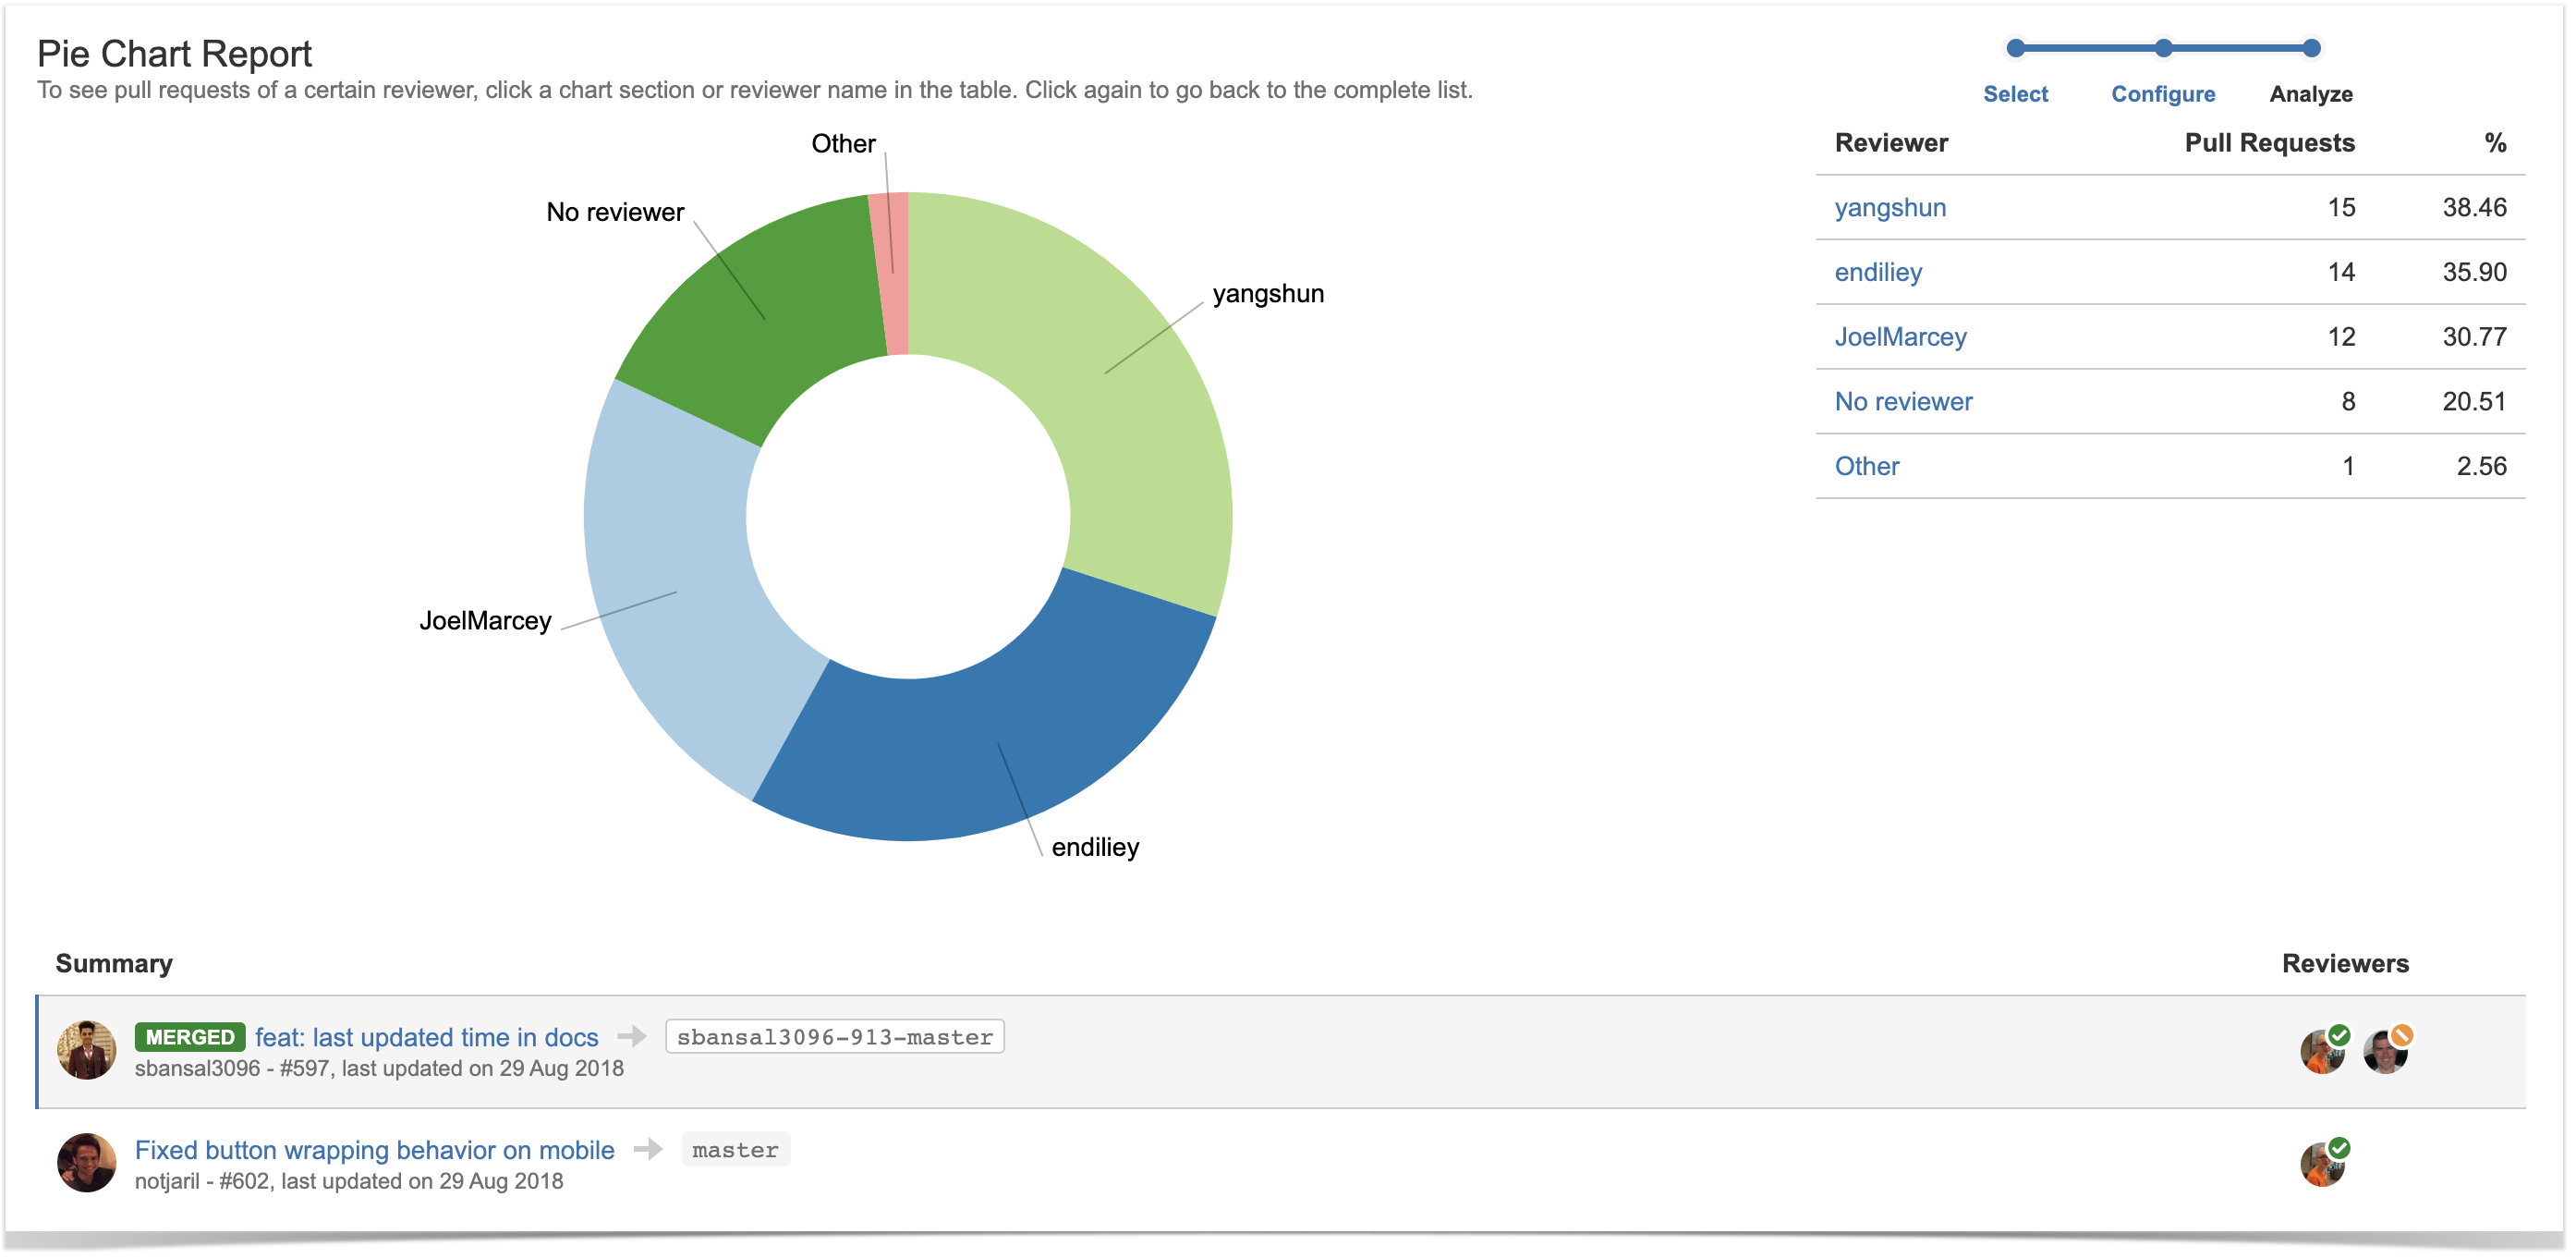
How to read Pie Chart Report
The report is made up of the pie chart itself, the statistics table, and the list of pull requests.
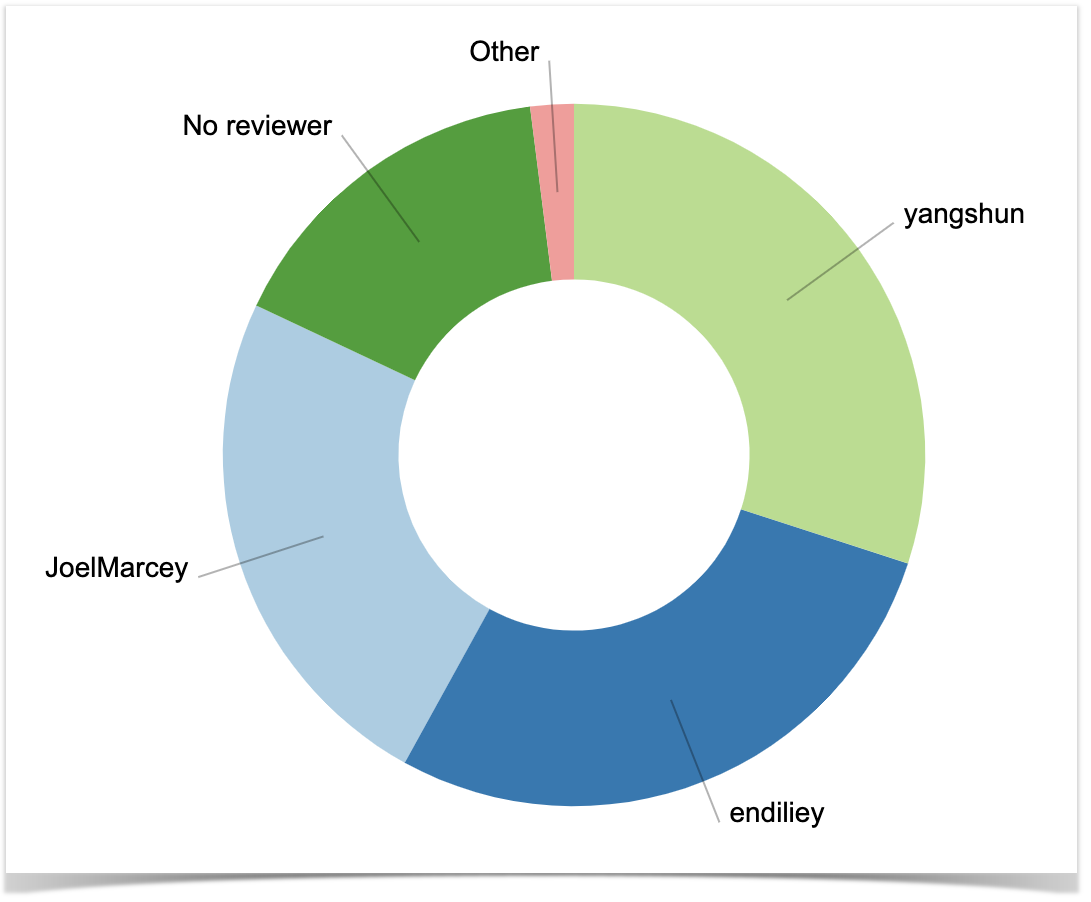
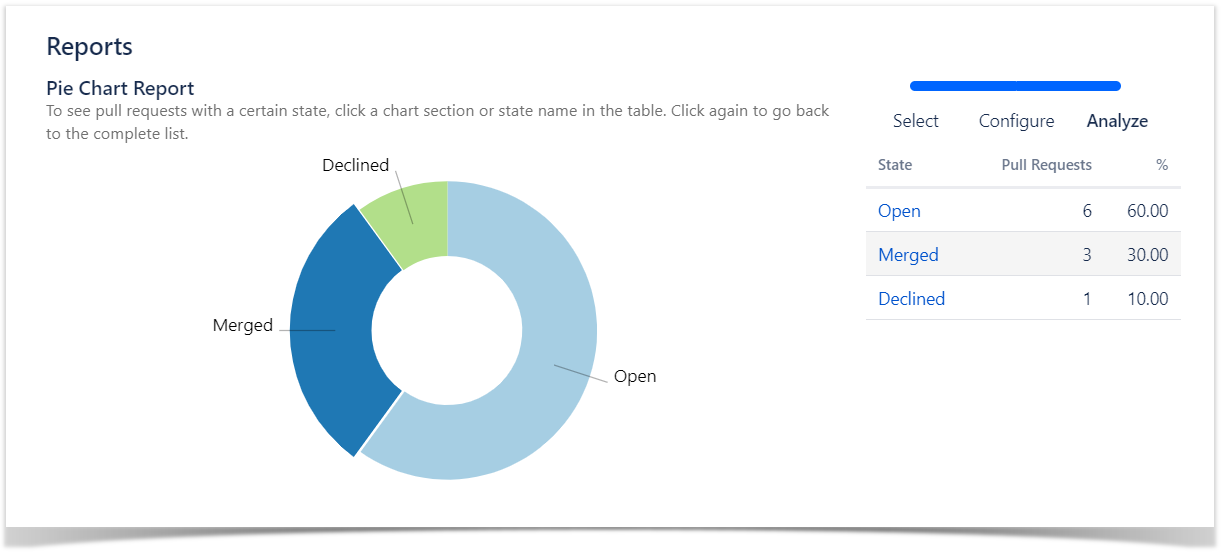
Pie Chart
The pie chart shows the pull requests grouped by a specified statistic type: author, reviewer, state, or destination branch.
Statistics table
To the right of the pie chart, there is a table showing the number of pull requests that correspond to each author (reviewer, pull request state, or destination branch).
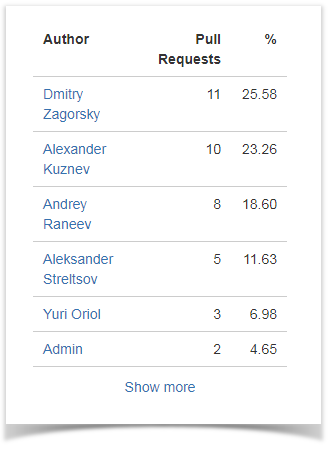
The corresponding table row is being highlighted when you select a slice in the pie chart.
List of pull requests
Below the pie chart, you can see the list of pull requests. Initially, it shows all pull requests included in the report.
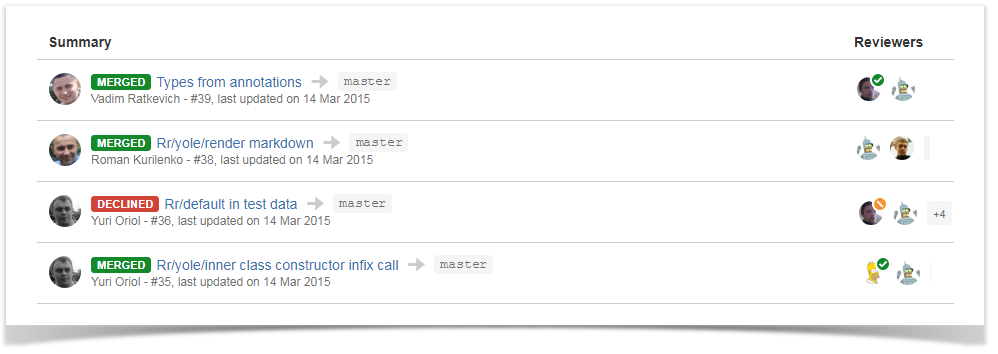
To see only the details of pull requests with a certain author (reviewer, pull request state, or destination branch), click the corresponding chart section or row in the table located to the right of the chart. To go back to viewing the details of all pull requests, click the selected chart section or row in the table.
If you'd like Awesome Graphs to include other pull requests reports, please, let us know.