Download PDF
Download page Resolution Time Distribution.
Resolution Time Distribution
Resolution Time Distribution report shows pull requests grouped by the time taken to merge or decline them. This helps you see the most frequent resolution times and analyze the code review process.
The report helps you answer such questions as:
- How long does it usually take to resolve pull requests?
- Are there more pull requests with a long or short resolution time?
- What is the expected resolution time for future pull requests?
- What pull requests of the period had the shortest/longest resolution times?
Below on the page, you'll learn:
- how to view the Resolution Time Distribution report for workspaces and repositories
- how to configure the report
- how to read the report
For easier navigation, use the Table of Contents at the top-right of the page.
How to view the Resolution Time Distribution report
The Resolution Time Distribution report is available both on the workspace and repository levels.
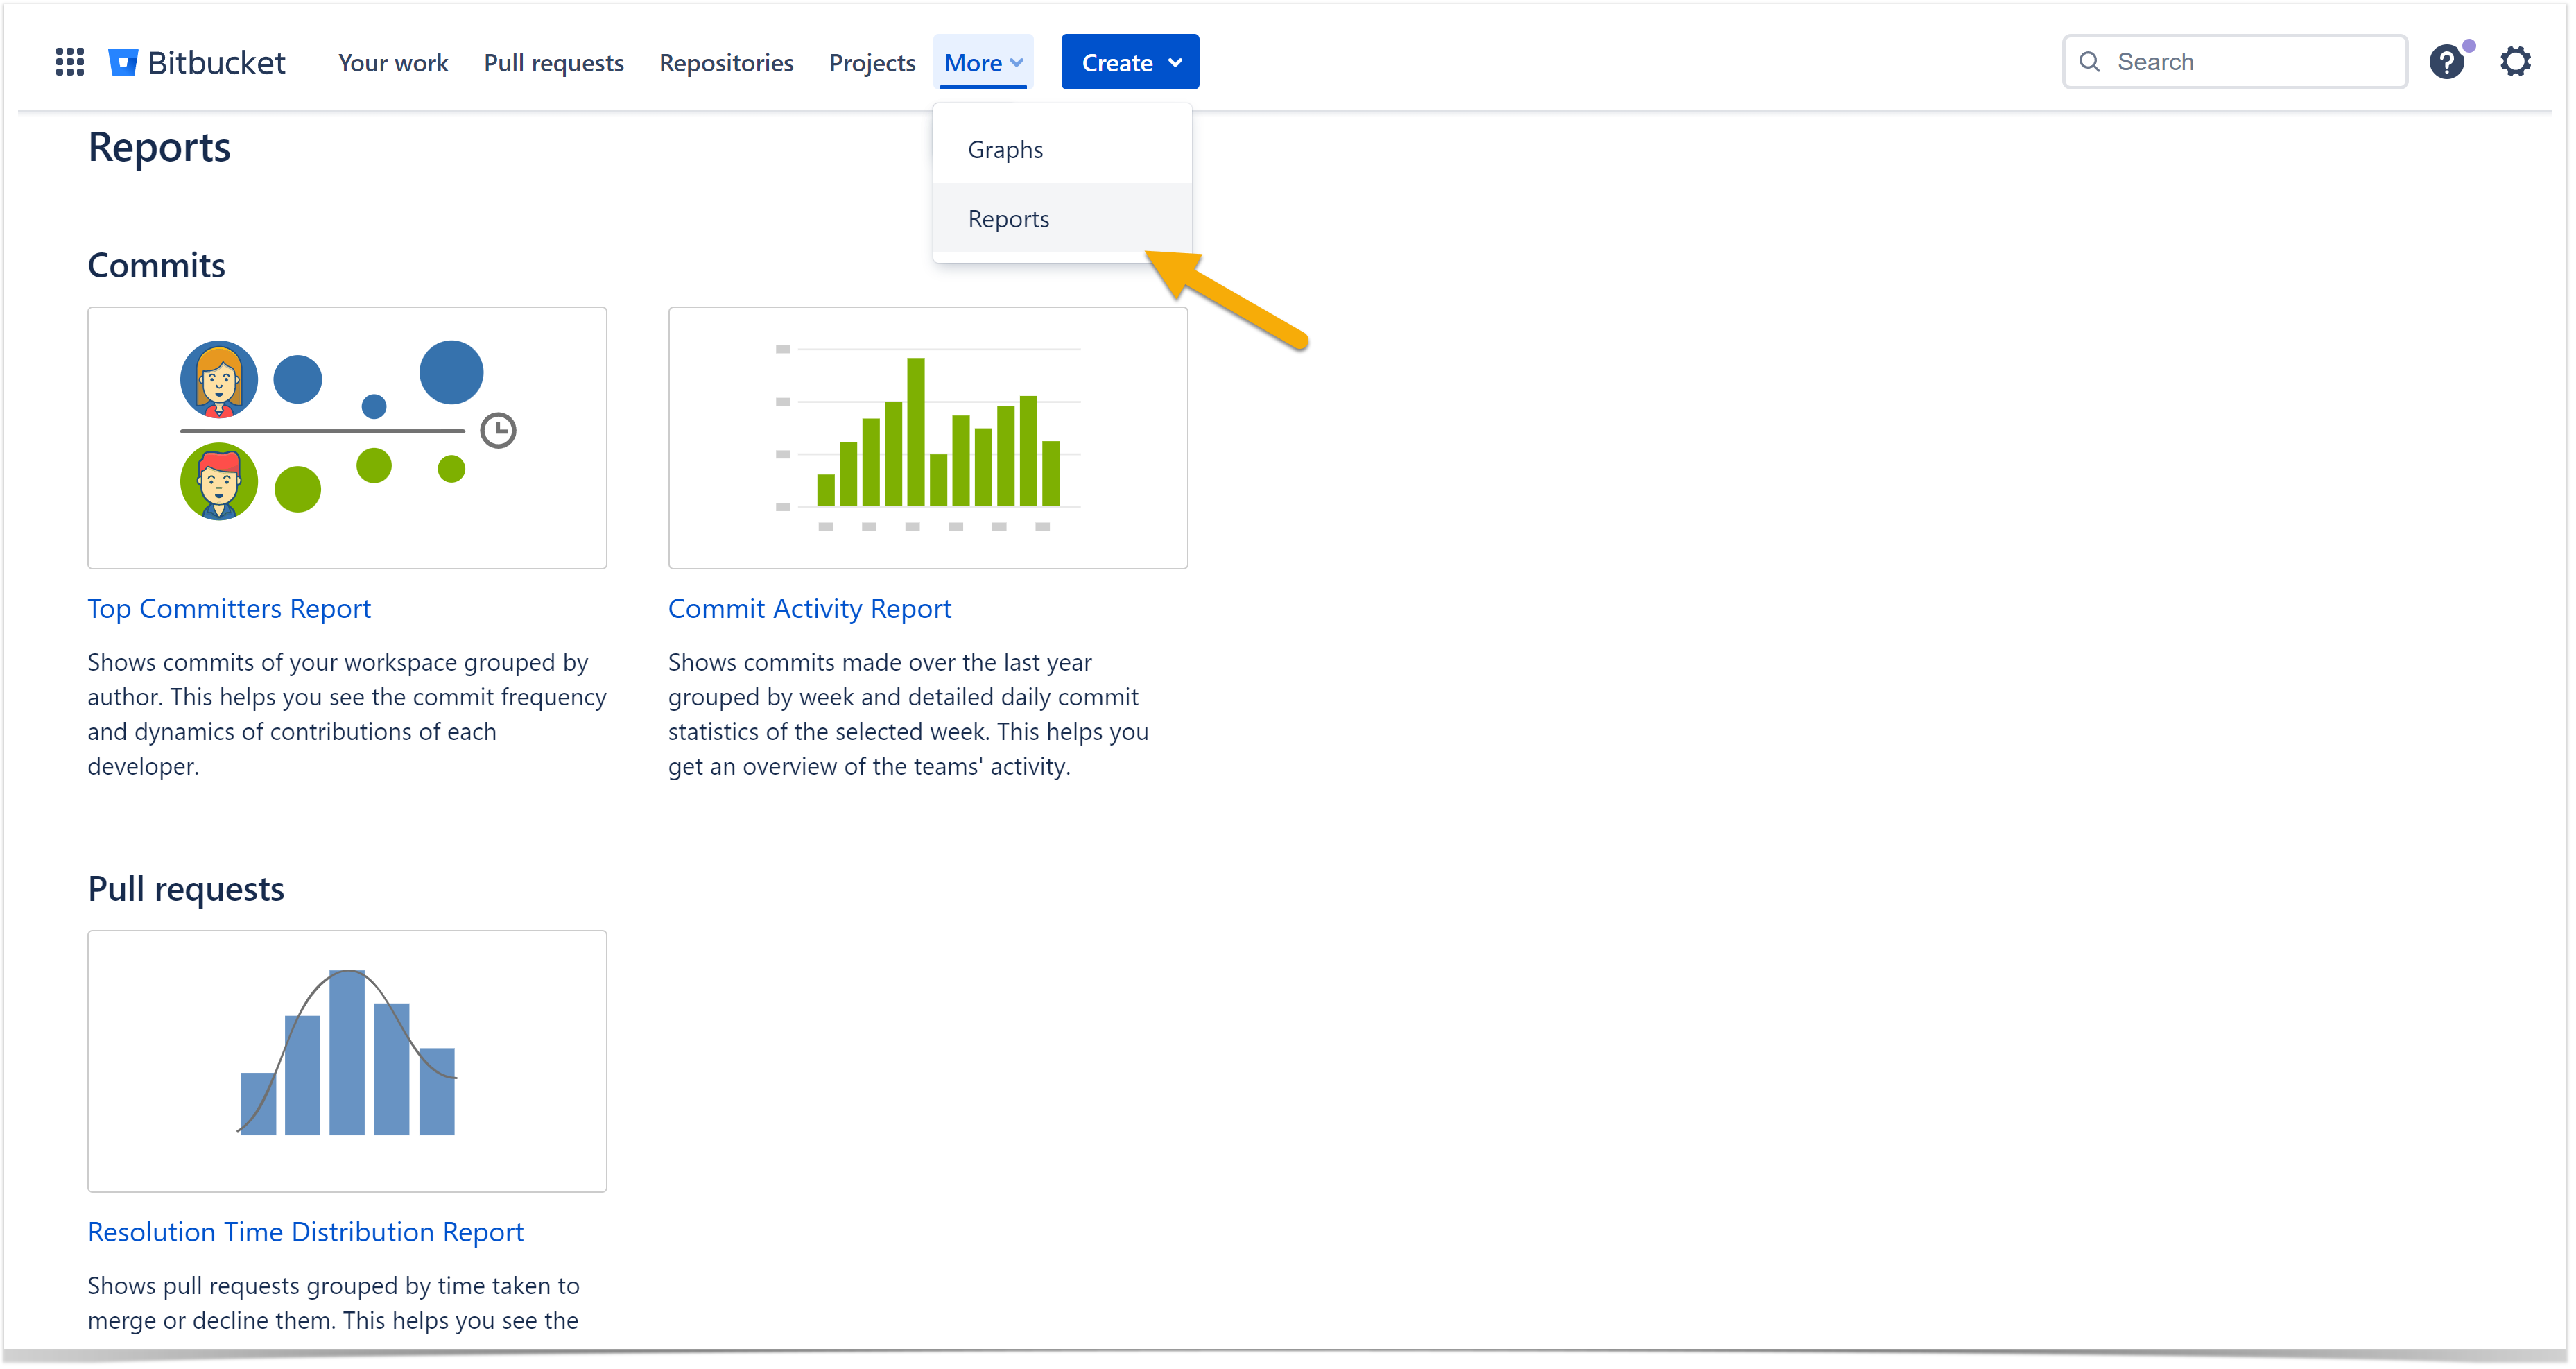
To view the Resolution Time Distribution report on a workspace level:
- Click More → Reports in the header.
- Choose Resolution Time Distribution in the Pull Requests section.
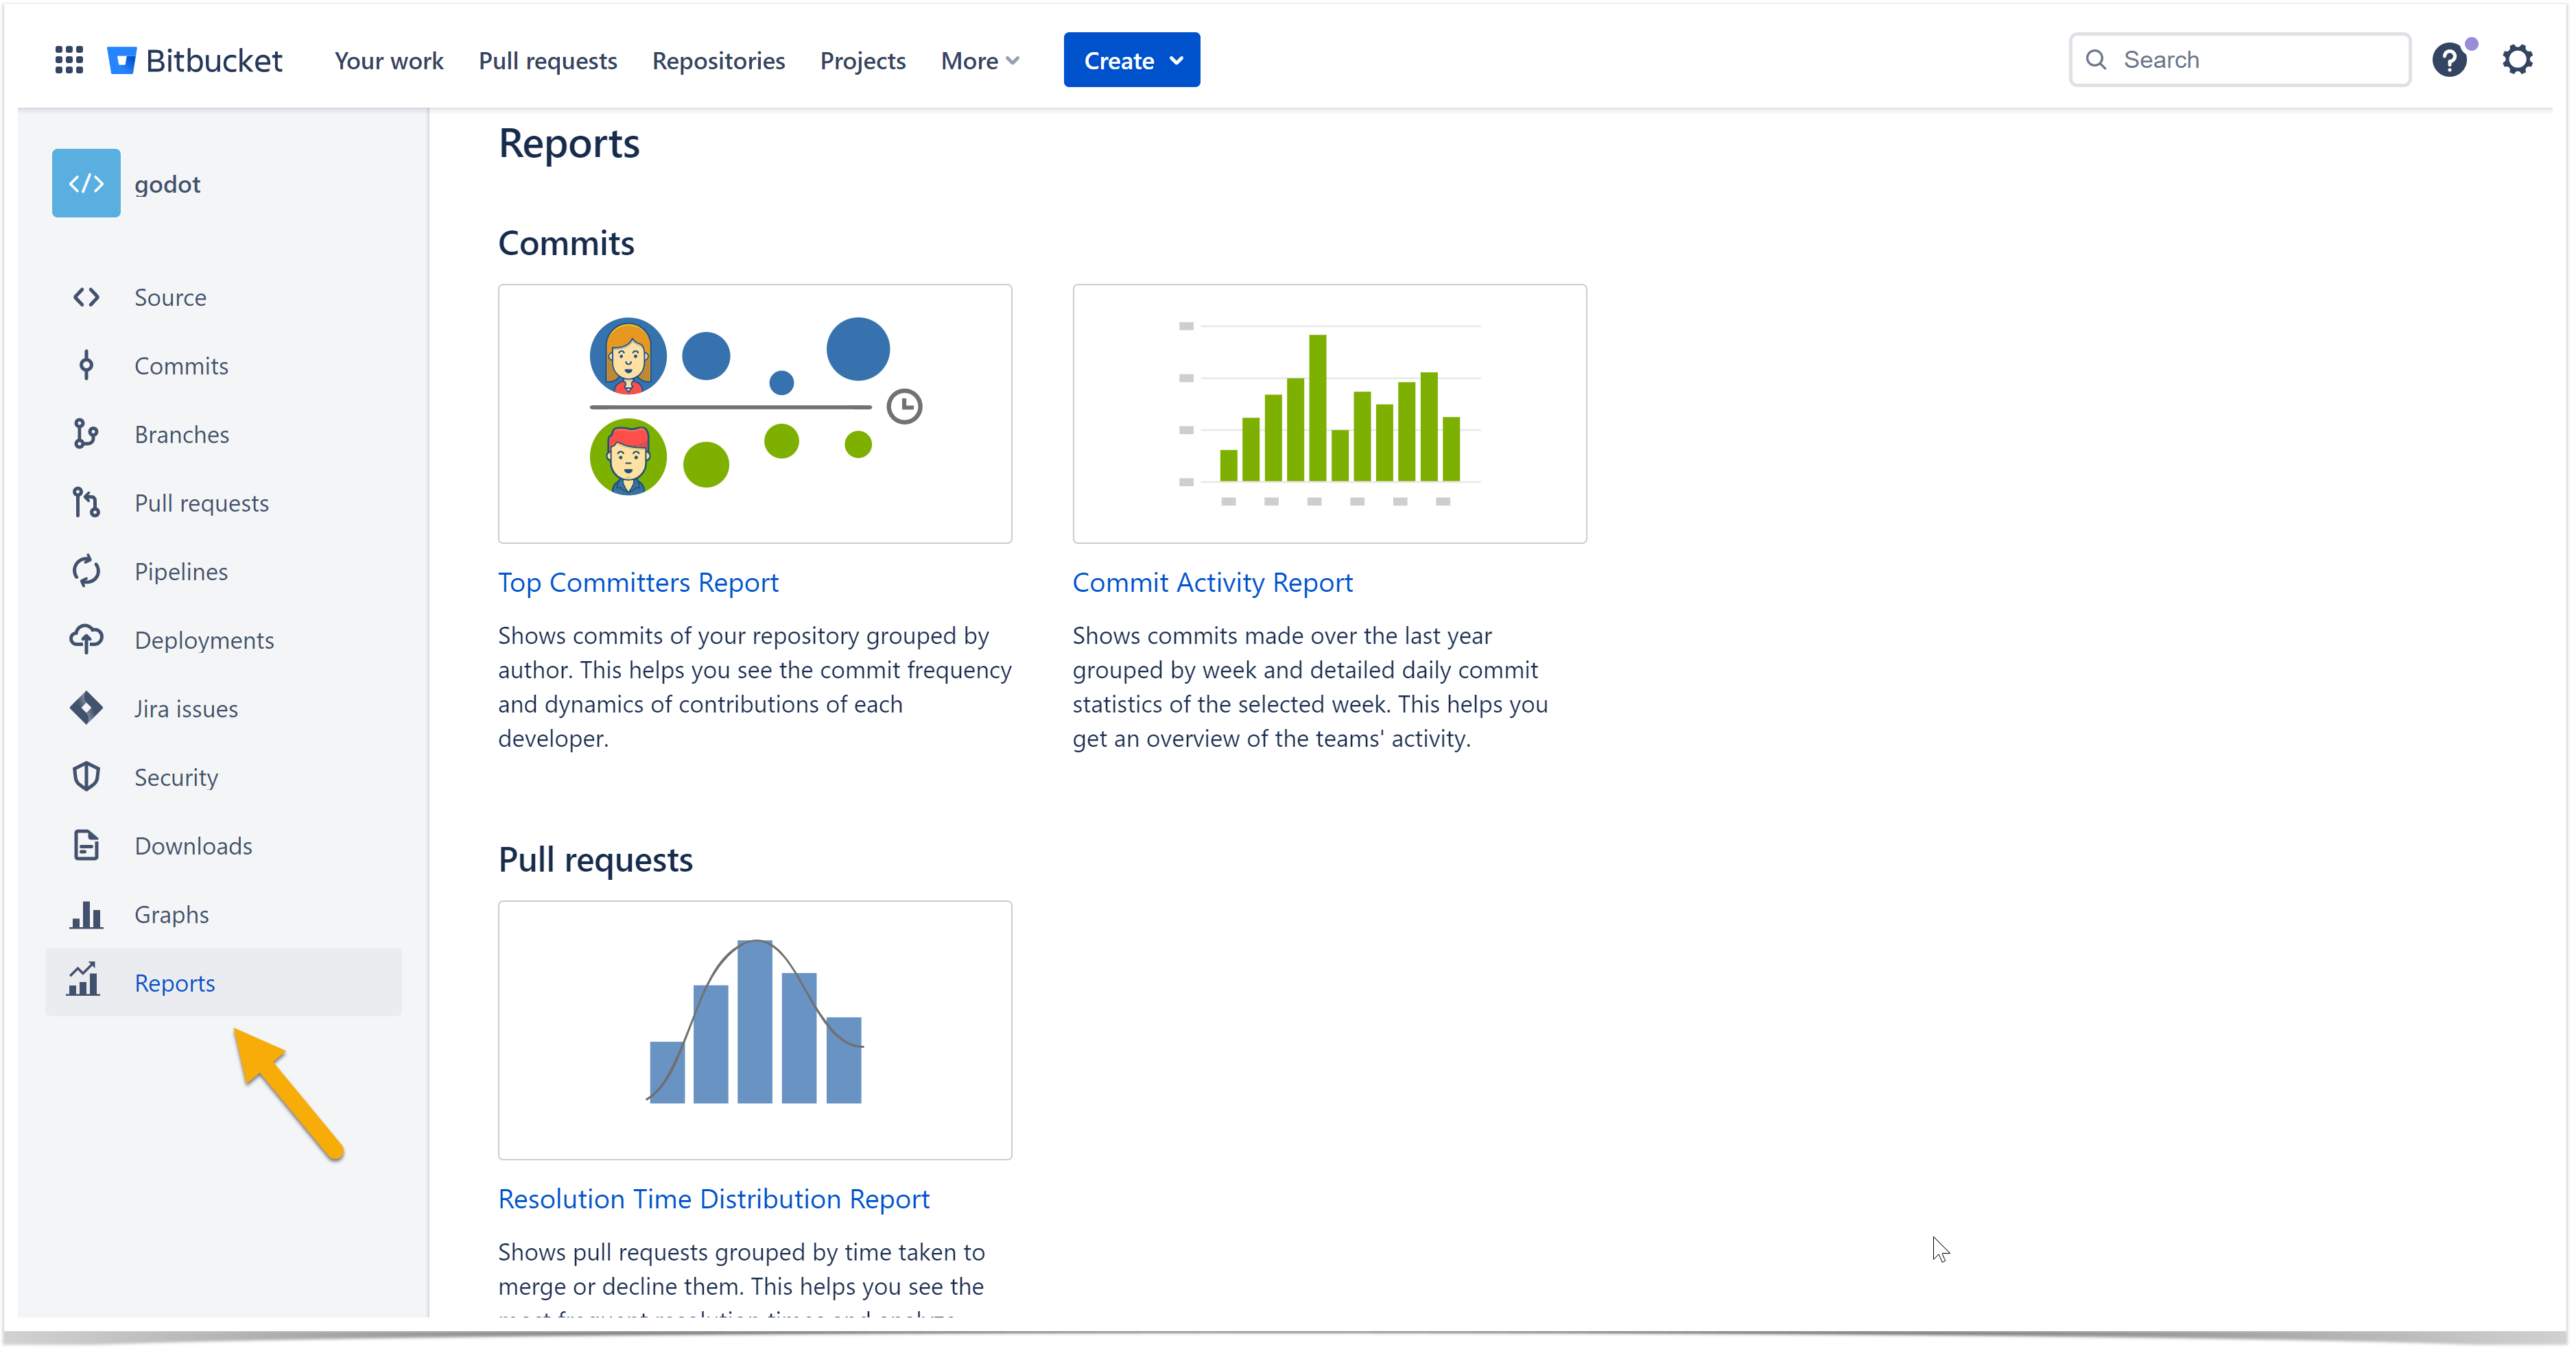
To view the Resolution Time Distribution report for a repository:
- Navigate to the repository of your choice.
- Click Reports in the left-hand sidebar.
- Choose Resolution Time Distribution in the Pull Requests section.
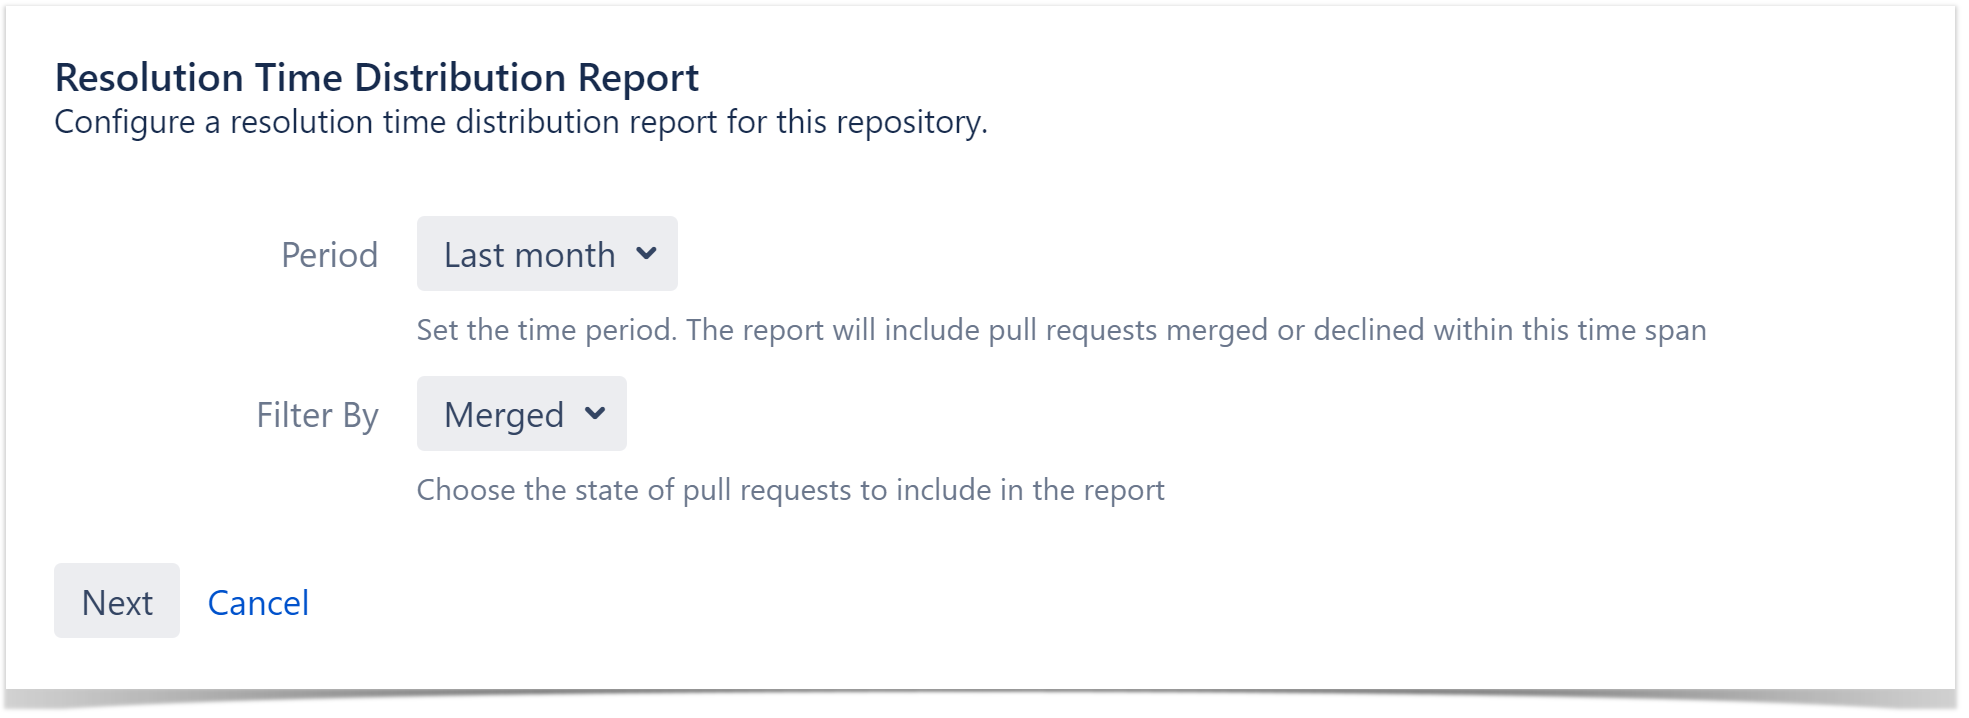
How to configure the Resolution Time Distribution report
- In the Period field, choose the time frame. The report will include pull requests that were merged or declined within this time frame.
- In Filter By, choose the state of pull requests to include in the report (merged or declined).
How to read a Resolution Time Distribution report
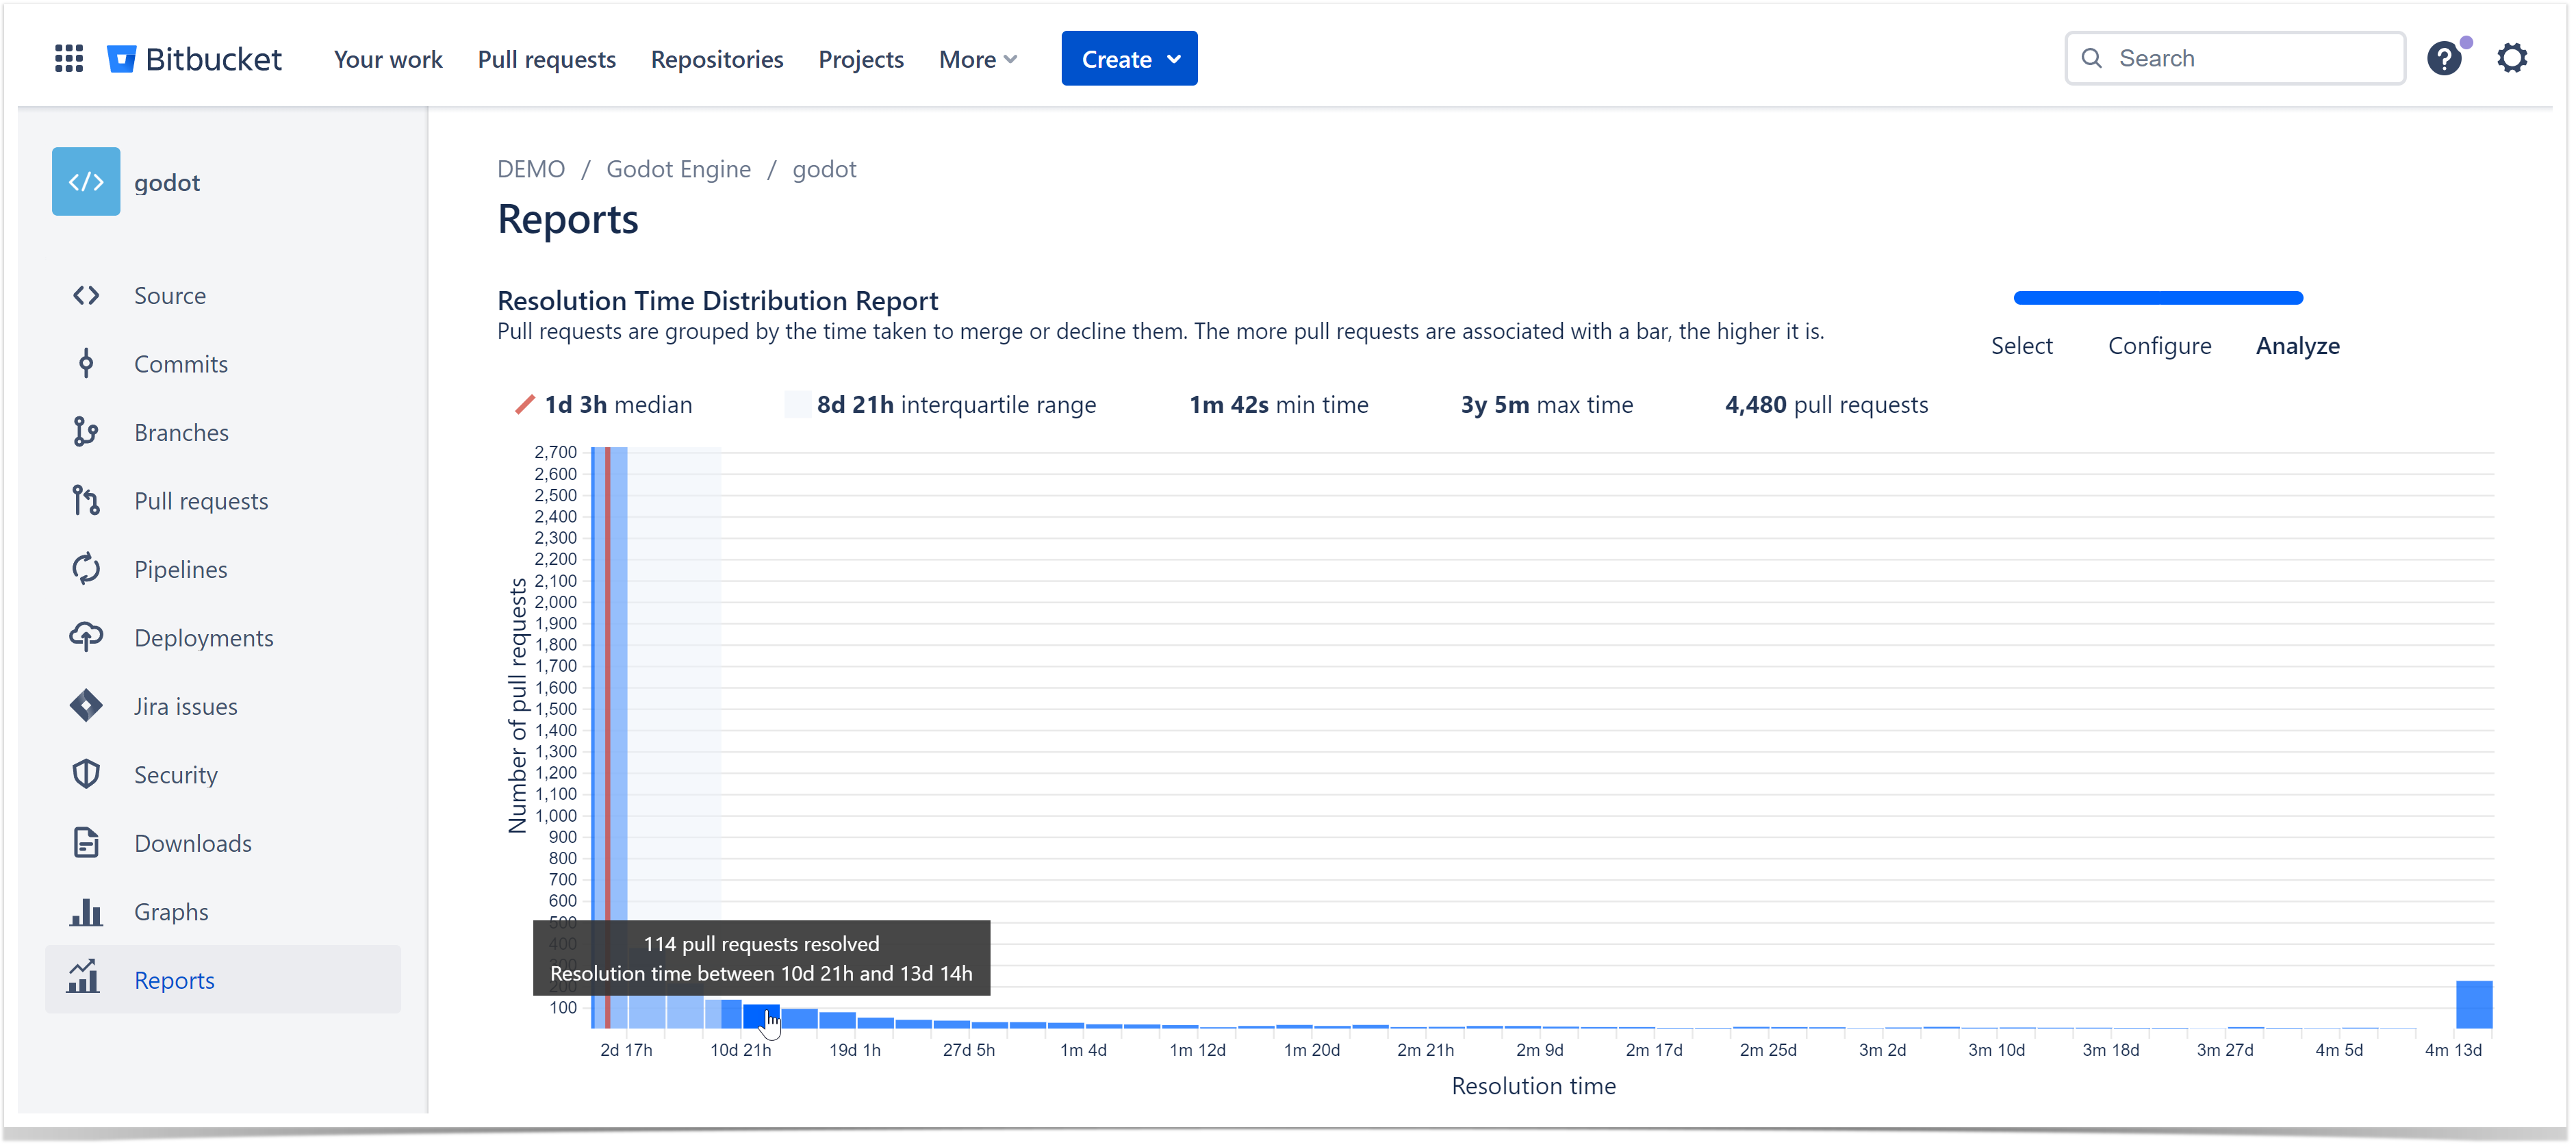
The report has all pull requests of the period ordered and divided into groups based on their resolution time. Each bar is a group of pull requests resolved (merged or declined) within a certain time span. E.g., one bar can include pull requests that took 'between 1 and 2 days' to be resolved; and another bar – pull requests with 'between 4 and 5 days' resolution time.
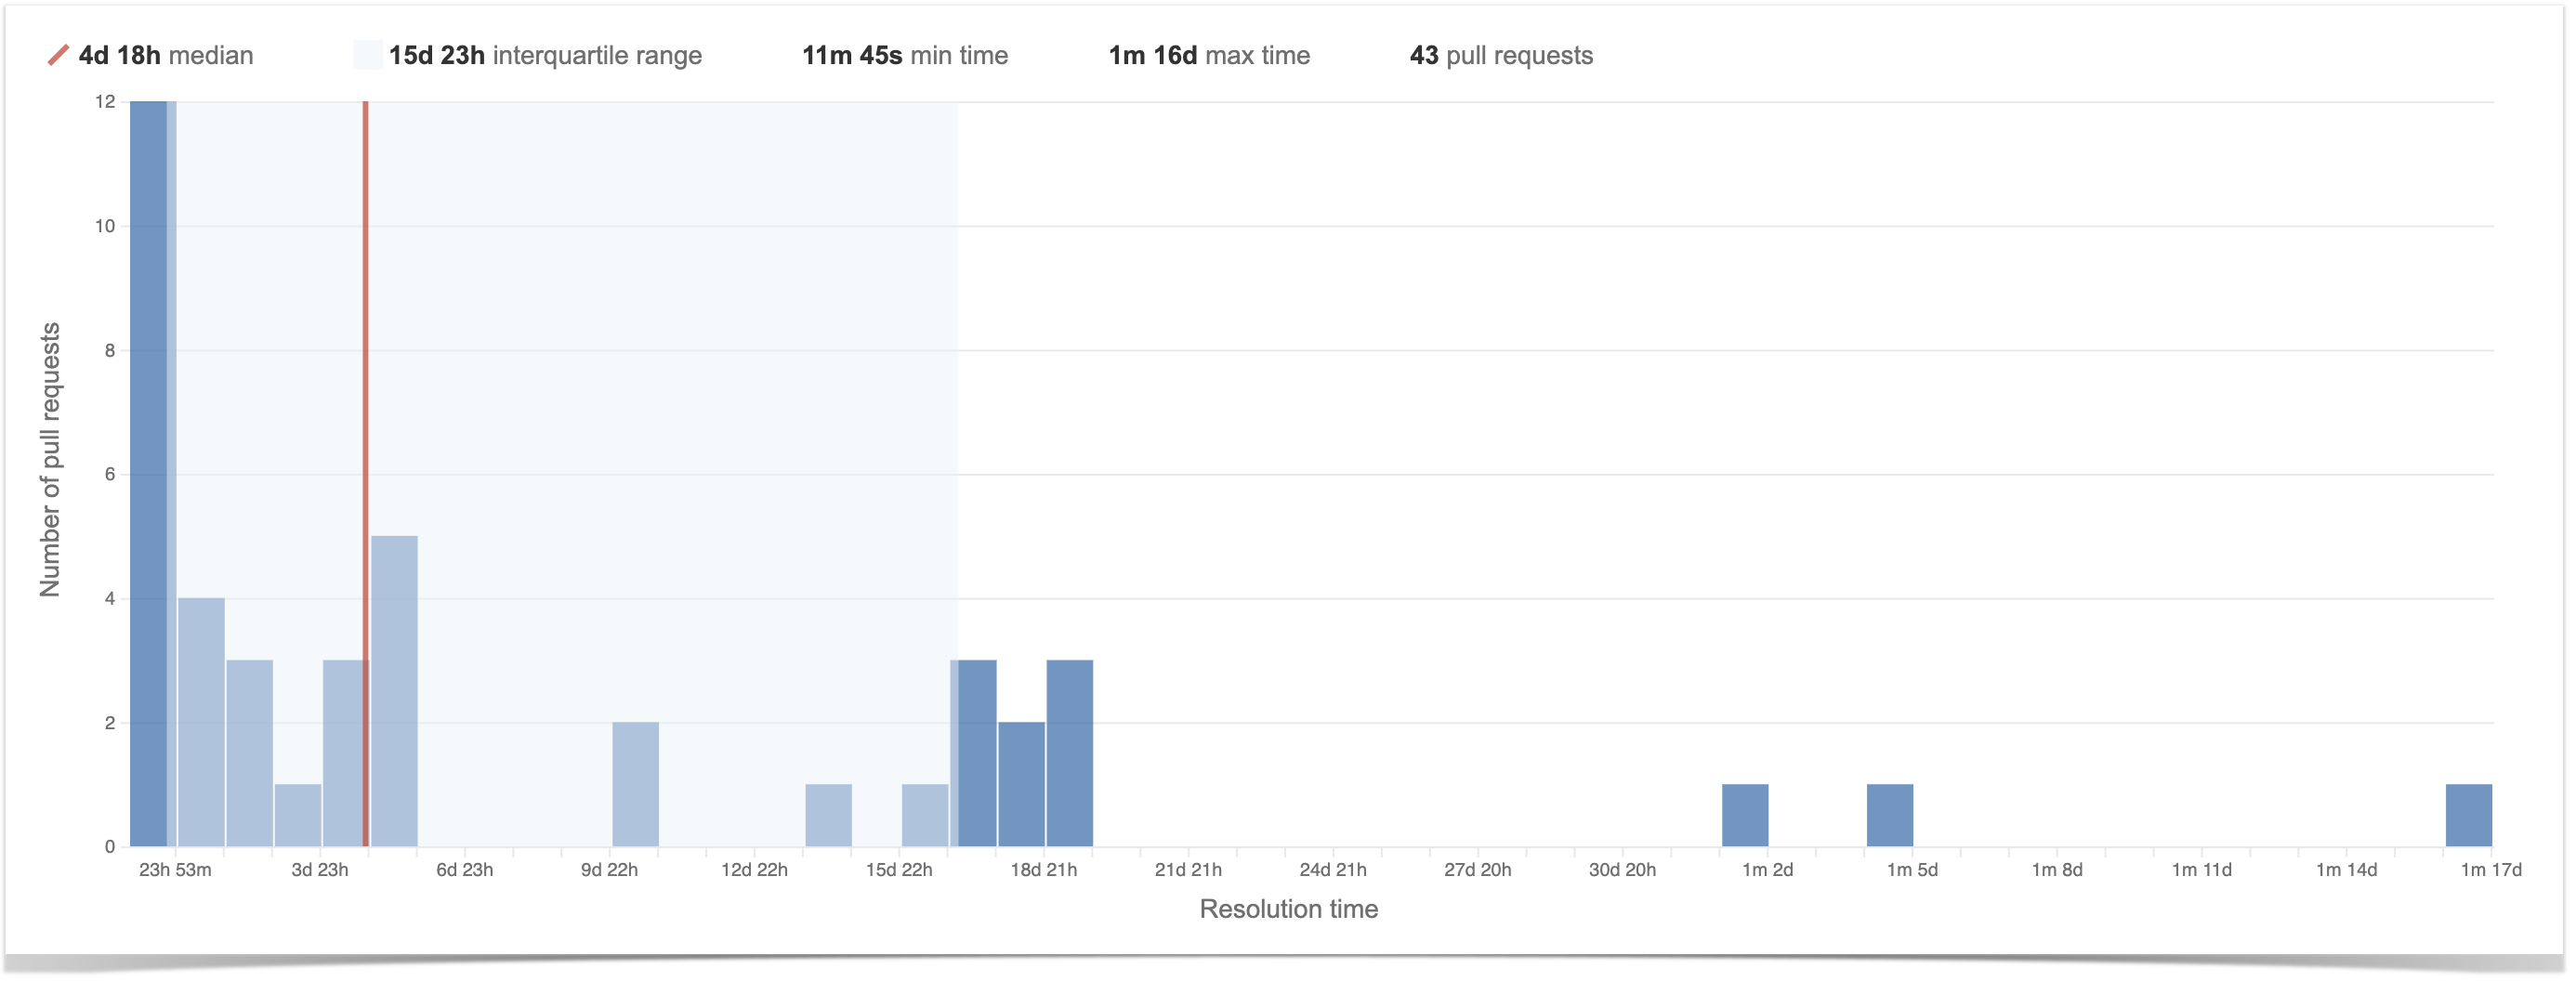
- Axis X – Resolution time
- Axis Y – Number of pull requests
- Red line – Median
- Selected area – Interquartile interval (IQI)
Bars on the left show pull requests with the shortest resolution time, and bars on the right show those with the longest resolution time. The more pull requests are associated with a bar, the higher it is.
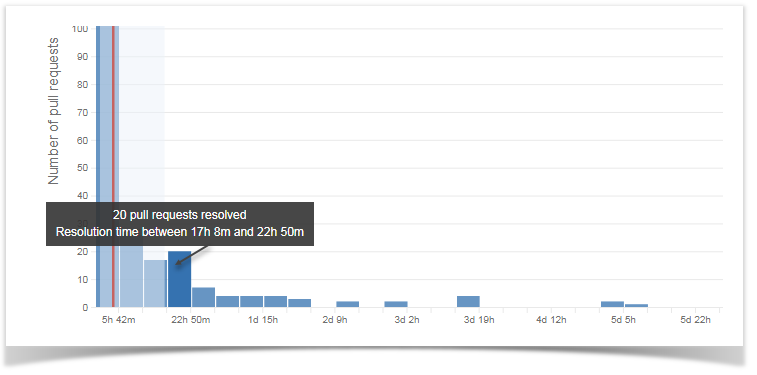
For example, below you can see the bar that includes 20 pull requests. Each of them was resolved in more than 17 hours and 8 minutes, but less than 22 hours and 50 minutes.
Median and IQI
The red line shows the median – typical resolution time. It is in the "middle" of the distribution. If to put all pull requests of the period in order by their resolution time (from the shortest to the longest), the resolution time of the pull request in the middle will be the median.
- 50% of pull requests have a resolution time shorter than the median
- 50% are pull requests with a resolution time longer than the median
E.g., if there are 5 pull requests during the period and they were resolved within 2, 4, 7, 11, 24 days accordingly, the median is the middle value - 7 days.
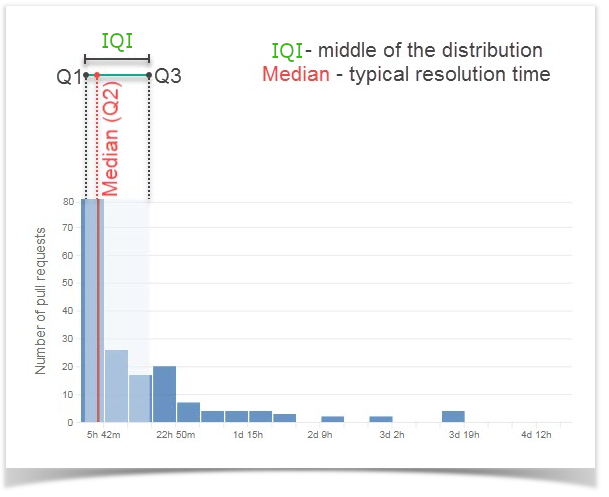
The selected area shows the interquartile interval (IQI) - the middle 50% of all pull requests of the period. In other words, it displays where the bulk of the data values lie.
- IQI's left bound is called the first quartile (Q1). It represents 25 percentile of data.
- IQI's right bound is called the third quartile (Q3). It represents 75 percentile of data.
How to use it
- 25% of pull requests with the shortest resolution time are located to the left from the selected area (from Q1)
- 25% of pull requests with the longest resolution time are located to the right from the selected area (from Q2)
- 50% of pull requests with the middle resolution time length are located inside the selected area
Future pull requests are likely to be resolved within the time until Q3
Comparing the median to the quartile values (Q1 and Q3) shows whether data is skewed:
- if there is a high proportion of pull requests with longer resolution times, the median is closer to Q3 than to Q1
- if values are more evenly distributed, the median is closer to the middle of the selected area
- if there are significantly more pull requests that are resolved fast, the median will be closer to Q1
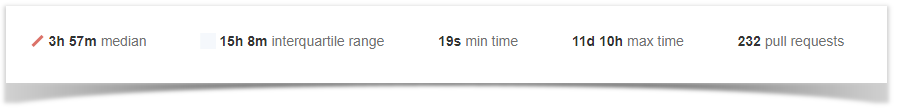
Legend
The legend above the chart shows:
- Median resolution time
- Interquartile range
- Minimum resolution time
- Maximum resolution time
- Number of pull requests
Interquartile range (IQR) is the difference between the third quartile and the first quartile (IQR = Q3 - Q1). It tells about the range of the middle half of the resolution times in the distribution.
IQR tells how spread out the "middle" values are
IQR can also be used to see outliers – values that are "too far" from the "middle" values
If you'd like Awesome Graphs to include other pull requests reports, please, let us know.