Generating pull requests reports for projects. Improvements in pie chart report.
New in this release:
Generating pull requests reports for projects.
Setting period of time for the Pie Chart pull requests report.
New look of the pull requests reports item on the sidebar.
Improvement for Pie Chart pull requests reports with too many small slices.
Commits from forks of repositories are now ignored for more exact statistics of graphs.
Fixed in this release:
Repositories in the 'Recent Activity' list on the Contributions page in user profile were ordered by day rather than by the exact time of the last activity in the repository.
Fixed the issue that caused errors when a contributor committed changes to a repository without providing an email address. Since in this case it is not possible to associate such commits with contributors, they are being joined together and are considered to be contributions made by one 'Unknown' contributor.
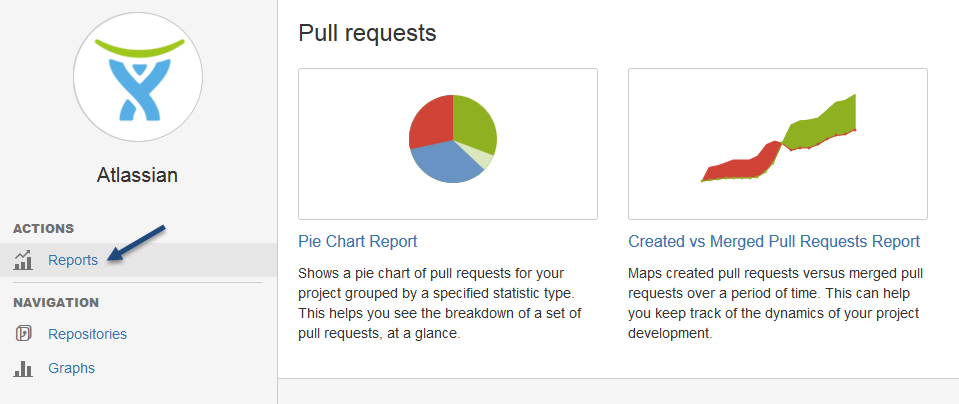
Generating pull requests reports for projects
Now you can generate pull requests reports not only for repositories, but for projects as well.
To generate a pull requests report for a project:
navigate to the project of your choice
in the Actions section on the sidebar, choose 'Reports'
select one of the reports types
configure and view the report
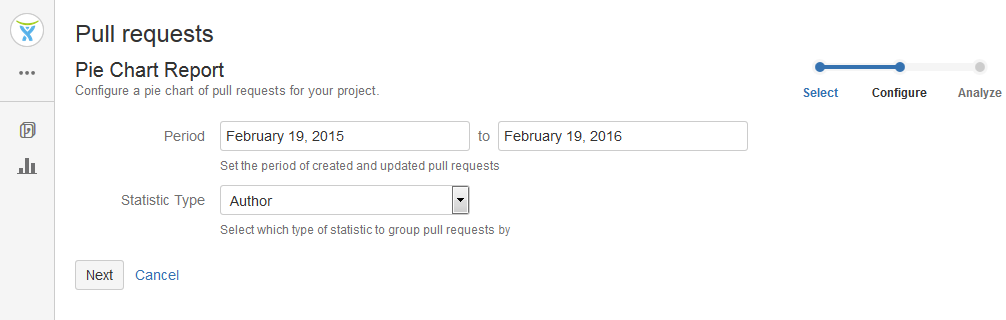
Setting period of time for the Pie Chart pull requests report
We made the Pie Chart pull requests report more flexible. Before, this report was built based on the pull requests statistics starting from the first pull request in a repository.
Now you can set the time span of created and updated pull requests and build the report for the needed period of time, e.g. last 3 months, last year.
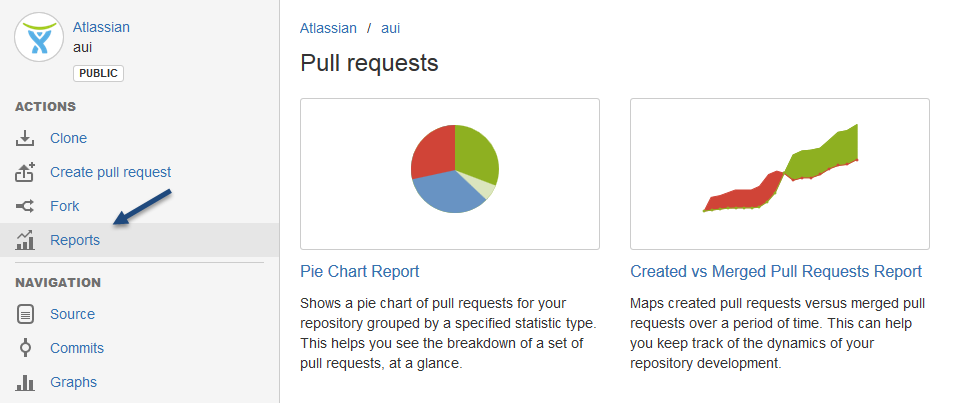
New look of the pull requests reports item on the sidebar
Now the Pull Requests Reports item on the navigation sidebar is called 'Reports'. And it has a new icon that looks like this .
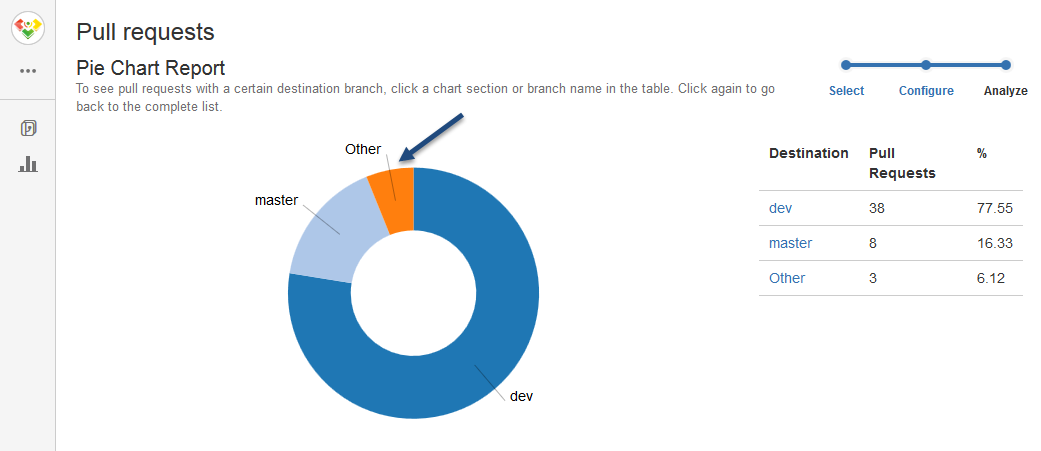
Improvement for Pie Chart pull requests reports with too many small slices
Sometimes when generating a Pie Chart pull requests report, there are too many small slices to render them all. Now in such cases the graph is being displayed with the data of small slices being grouped together in the sector called 'Other'.
It may occur that there are that many small slices that the 'Other' sector is the only thing you see on a pie chart. In this situation you can go back to the 'Configure' step and try changing the time period for the report to reduce the amount of data and see a pie chart with slices.
Cookie Notice
This website uses cookies for analytics, personalization and advertising. By continuing to browse, you agree to our use of cookies. Learn more