View how the activity of a developer was distributed among different projects.
New in this release:
View how the activity of a developer was distributed among different projects in the past month, quarter or year.
Performance improvement. Reduced the amount of memory required for browsing graphs. Before, to render a graph, the statistics about all commits in a repository was preliminary loaded into memory. Now commits are streamed directly from the database.
Added the pop-up hint with the author name in pull requests reports.
Fixed in this release:
A minor issue in Created vs Merged Pull Requests Report. The figures on the axis showing the number of pull requests could sometimes be missing.
The issue with the date picker in pull requests reports. When opening the date picker, the wrong year was shown.
During the indexing process, an erroneous message saying that the repository was empty could sometimes be displayed.
Project Top Committers Reports included the statistics from the forked repositories. Now it's excluded just like in other reports and graphs.
There was an error message displayed when loading graphs in large repositories or projects, if it was taking more than a minute.
View how the activity of a developer was spread among different projects in the past month, quarter or year
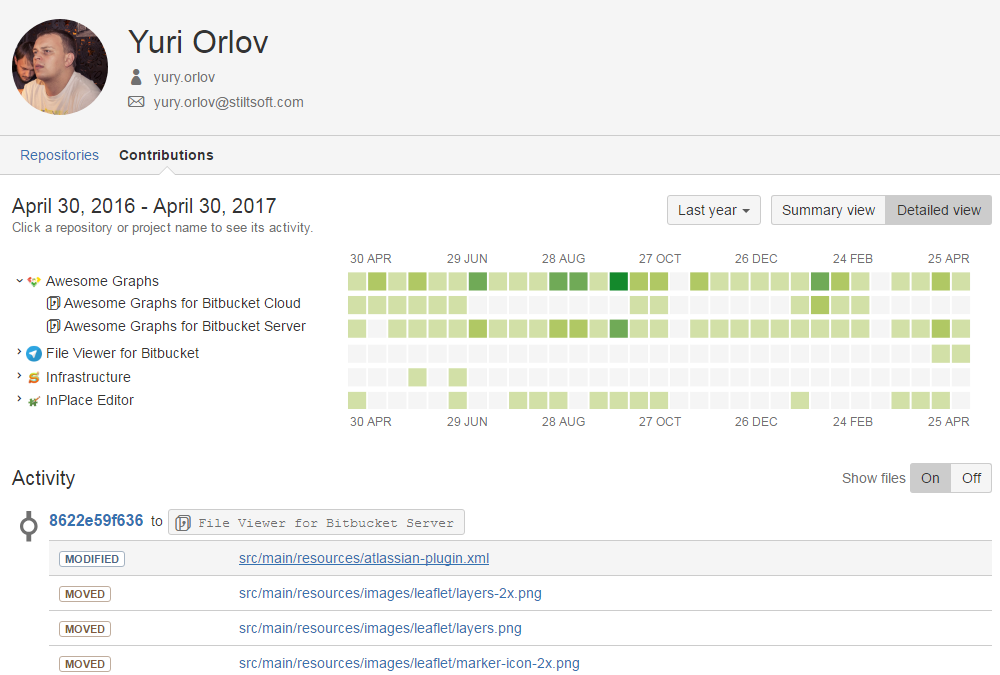
Contributions in user profile got a new view – Detailed view. It shows the breakdown of user activity (commits and pull requests) by repository and project. It gives a great overview that you can use to see what projects a person worked on and when.
The calendar comes with the activity stream that shows the details of commits and pull requests. If you select a repository or project (or a square), the activity stream gets updated and shows the activity based on your selection.