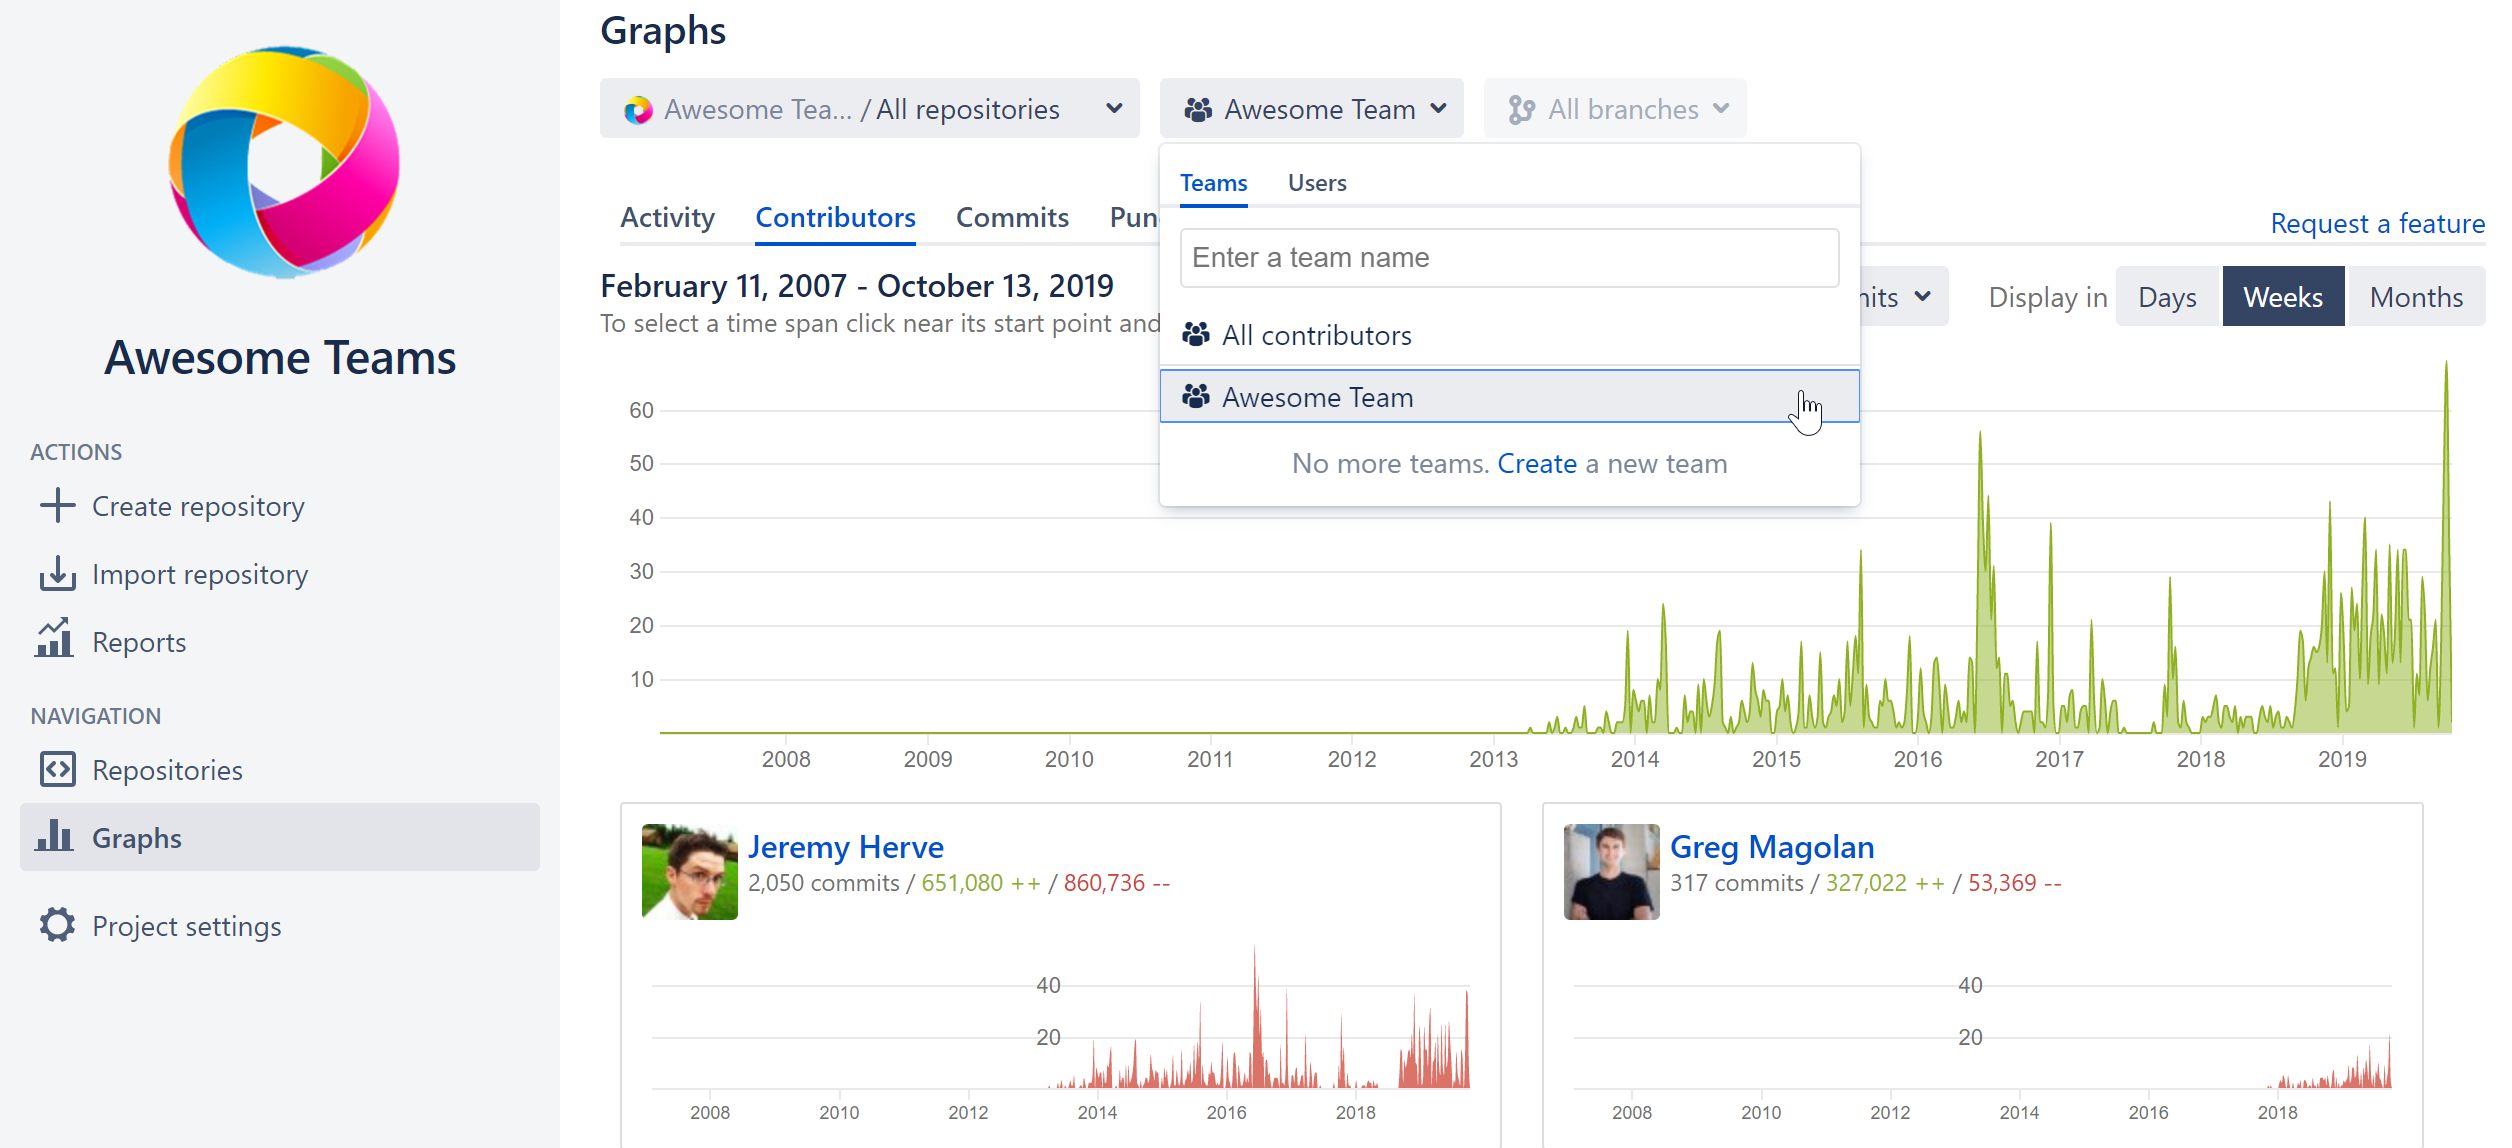
In this release, it became possible to create teams and watch graphs for them for a more precise analysis. That is especially useful for the projects or repositories with multiple teams working on it:
to watch graphs for a single team and exclude contributors from the others;
to compare the activity of different teams;
to create the preset of filters with a different combination of contributors.
This version includes graphs for teams on the Graphs page. Teams for the Reports page and the People page will be available in the next releases. Read more about teams here.
Teams can be created on the global, project or repository levels and include Bitbucket users and groups.
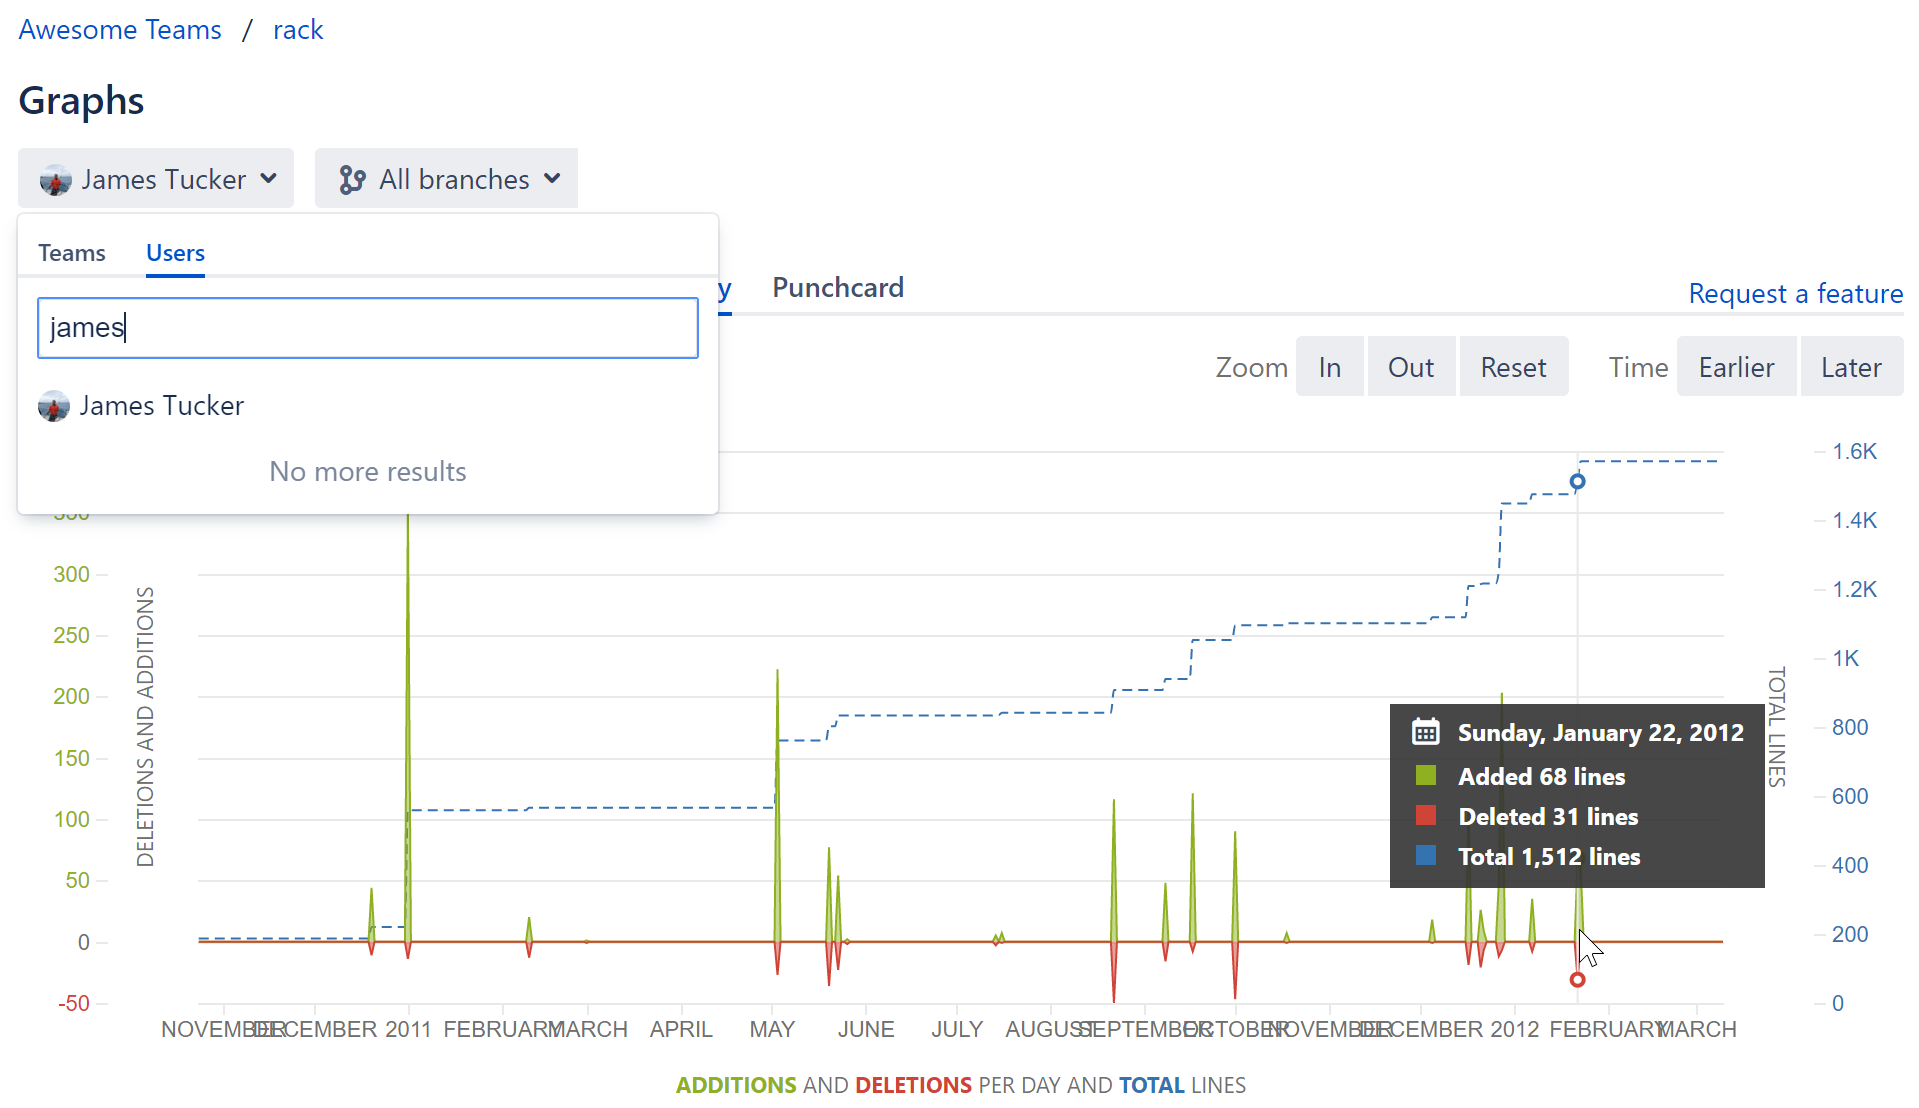
Graphs for a User
We've added the possibility to watch graphs for one user to track the personal activity of each developer.
People
We've expanded the time period for displaying the data on the People page. Now it's possible to view the statistics for a quarter. Before that, the app displayed the data for a month only.
Cookie Notice
This website uses cookies for analytics, personalization and advertising. By continuing to browse, you agree to our use of cookies. Learn more