| Panel | ||||||
|---|---|---|---|---|---|---|
| ||||||
Table Filter for Confluence add-on allows you to visualize your table data and create dynamic charts that you can configure and update on the fly while viewing Confluence pages. You can select the column containing labels and set one or multiple columns containing number values used for chart creation. Additionally, you can select the appropriate chart or graph type (pie, donut and 3D donut, column, bar, line, area, time line and time area). Optionally, you can set the decimal separator, specify the dimensions of the chart, and enable the hiding of the source table. You can modify settings of your charts and save modifications in the macro body while viewing the page. |
| Table of Contents | ||
|---|---|---|
|
| Widget Connector | ||||||
|---|---|---|---|---|---|---|
|
Starting from version 3.0.0 Table Filter add-on allows you to generate charts based on values from your data tables. The add-on supports the following types of charts:
Chart Parameters
These parameters determine the procedure of chart generation on Confluence page. The set of parameters
| Expand | |||||||||||||
|---|---|---|---|---|---|---|---|---|---|---|---|---|---|
| |||||||||||||
|
|
|
|
Inserting Chart from Table macro
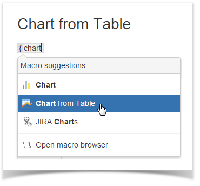
There exist three ways to insert the Chart from Table macro on the page.
| Macro Insertion | Instructions | Supported Data |
|---|---|---|
| Inserting the macro through the action icon on the editor pane |
|
|
| Manual entry of the {Chart from Table} query on the page |
|
|
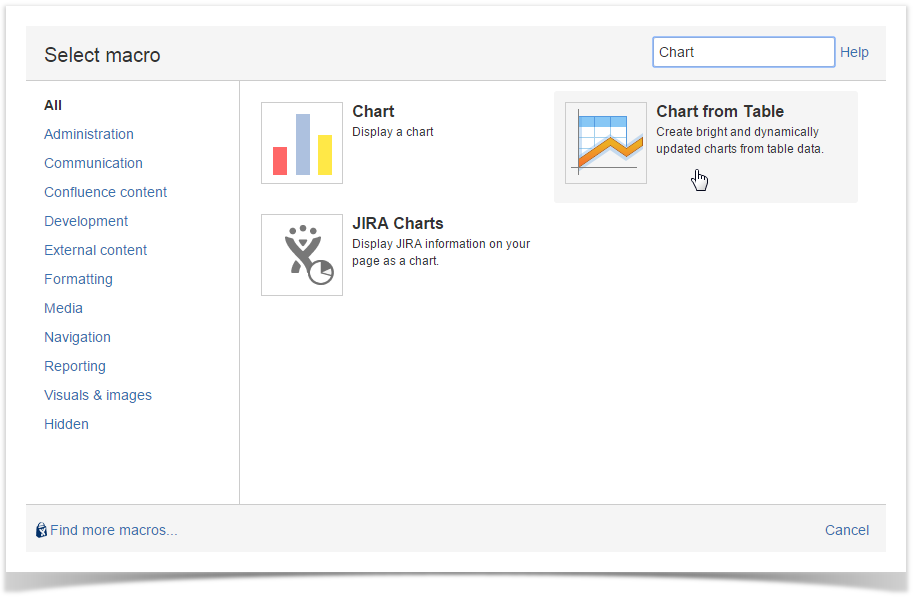
| Selection of the Chart from Table macro in the Select Macro form |
|
|


Configuring Table chart macro
- On the Confluence page opened in the edit mode, click the Chart from Table macro.
- Click Edit.
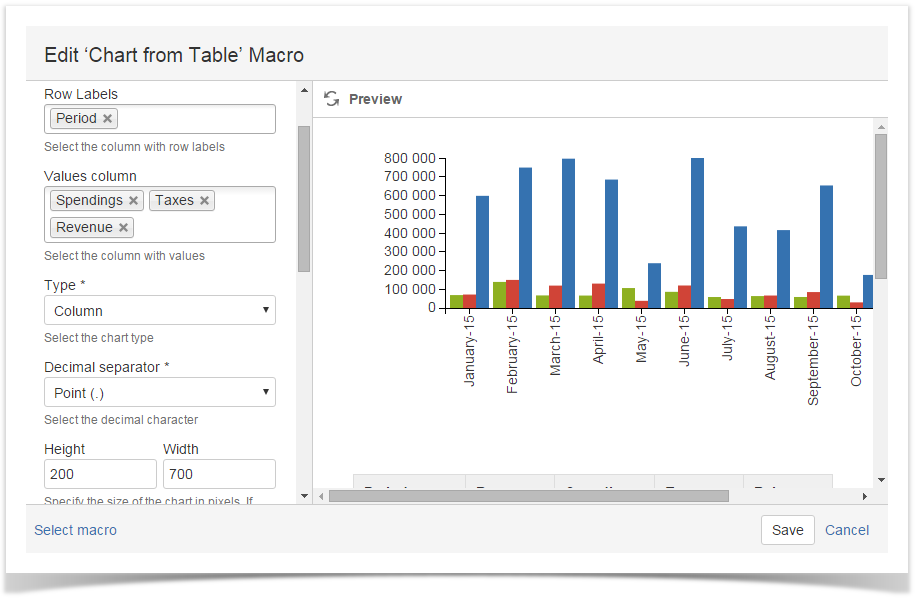
- In the Edit Table chart Macro form, define parameters of the macro.
- Click Save.
Managing Charts in the Page View Mode
Once you have defined settings of the Table chart macro and saved the page, you get a page with the generated chart.
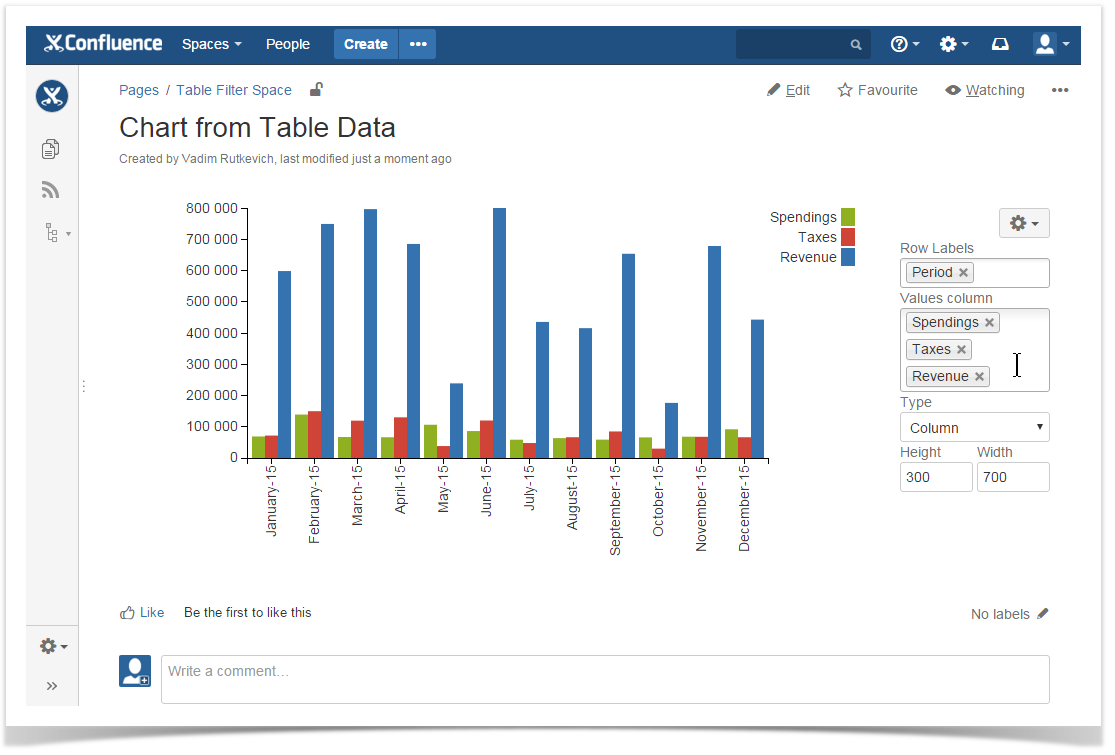
To the right side of your chart, you can locate the chart management sidebar. It allows you to alternate the following parameters of Chart table macro:
- Row Labels - change the column with labels for another one.
- Values column - change the column with data values. The chart will be automatically re-generated. Depending on the used chart type you may select column with numerical through Values column X and Values column Y fields.
- Dates column - change the column with dates. The chart will be automatically re-generated. This select box is shown for Time Line and Time Area charts only.
- Type - change the chart type for another one. You may need to re-select the table columns when changing the chart type.
- Height/Width - specify the required dimensions of the chart.
To save new parameters in the macro body, click the Cogwheel  icon and select Save changes.
To export the chart, click the Cogwheel icon and select Export to PDF or Export to Word.
To save the chart as image, click the Cogwheel icon and select Chart as image.
| Info |
|---|
For the line and area charts, you will have to select the columns with numbers (Values Axis X and Values Axis Y). |
Chart Examples
Pie chart
| Parameters in Macro Browser | Data Table in Macro Placeholder | Rendered Chart | ||||||||||||||||||||||||||||||||||||
|---|---|---|---|---|---|---|---|---|---|---|---|---|---|---|---|---|---|---|---|---|---|---|---|---|---|---|---|---|---|---|---|---|---|---|---|---|---|---|
|
| 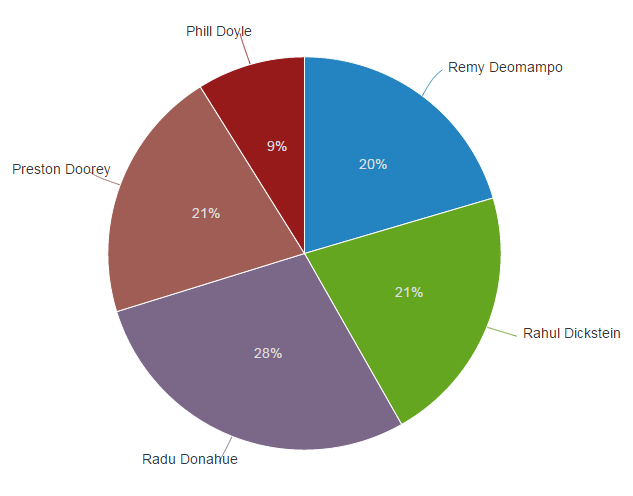 |
Donut / 3D Donut chart
| Parameters in Macro Browser | Data Table in Macro Placeholder | Rendered Chart | ||||||||||||||||||||||||||||||||||||
|---|---|---|---|---|---|---|---|---|---|---|---|---|---|---|---|---|---|---|---|---|---|---|---|---|---|---|---|---|---|---|---|---|---|---|---|---|---|---|
|
| 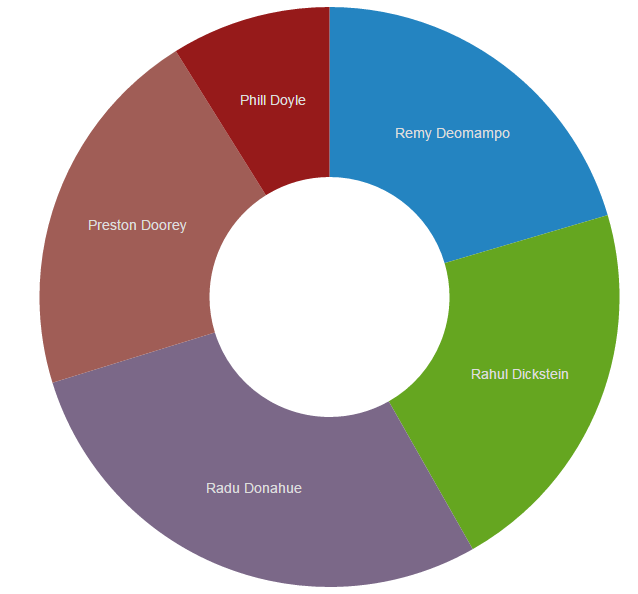 |
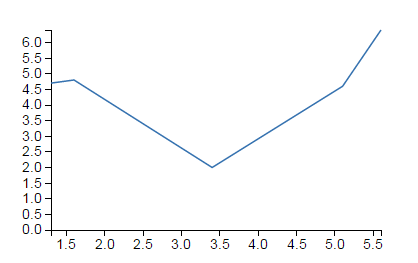
Line chart
| Parameters in Macro Browser | Data Table in Macro Placeholder | Rendered Chart | ||||||||||||||||||||||||||||||||||||
|---|---|---|---|---|---|---|---|---|---|---|---|---|---|---|---|---|---|---|---|---|---|---|---|---|---|---|---|---|---|---|---|---|---|---|---|---|---|---|
|
|
|
Column chart
| Parameters in Macro Browser | Data Table in Macro Placeholder | Rendered Chart | |||||||||||||||||||||||||||||||||||||||||||||
|---|---|---|---|---|---|---|---|---|---|---|---|---|---|---|---|---|---|---|---|---|---|---|---|---|---|---|---|---|---|---|---|---|---|---|---|---|---|---|---|---|---|---|---|---|---|---|---|
|
| 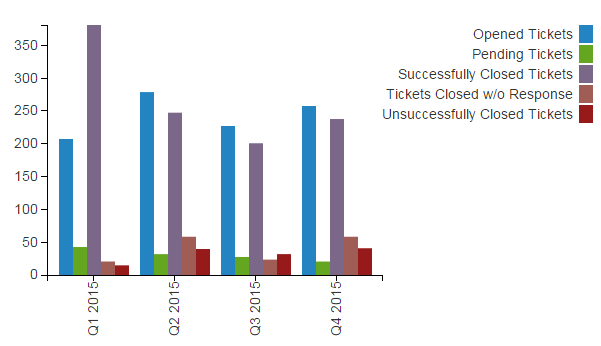 |
Stacked Column chart
| Parameters in Macro Browser | Data Table in Macro Placeholder | Rendered Chart | |||||||||||||||||||||||||||||||||||||||||||||
|---|---|---|---|---|---|---|---|---|---|---|---|---|---|---|---|---|---|---|---|---|---|---|---|---|---|---|---|---|---|---|---|---|---|---|---|---|---|---|---|---|---|---|---|---|---|---|---|
|
| 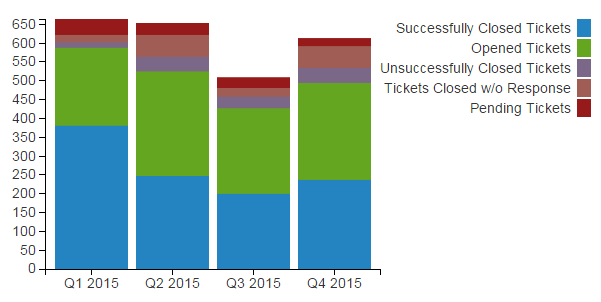 |
Bar chart
| Parameters in Macro Browser | Data Table in Macro Placeholder | Rendered Chart | |||||||||||||||||||||||||||||||||||||||||||||
|---|---|---|---|---|---|---|---|---|---|---|---|---|---|---|---|---|---|---|---|---|---|---|---|---|---|---|---|---|---|---|---|---|---|---|---|---|---|---|---|---|---|---|---|---|---|---|---|
|
| 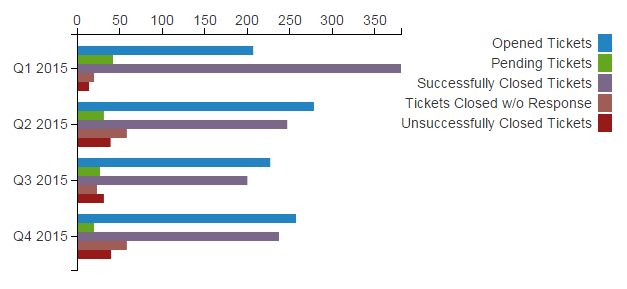 |
Stacked Bar chart
| Parameters in Macro Browser | Data Table in Macro Placeholder | Rendered Chart | |||||||||||||||||||||||||||||||||||||||||||||
|---|---|---|---|---|---|---|---|---|---|---|---|---|---|---|---|---|---|---|---|---|---|---|---|---|---|---|---|---|---|---|---|---|---|---|---|---|---|---|---|---|---|---|---|---|---|---|---|
|
| 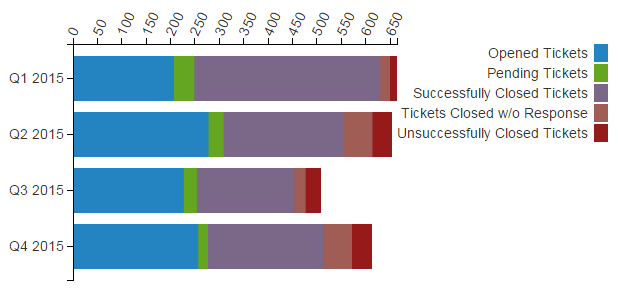 |
Area chart
| Parameters in Macro Browser | Data Table in Macro Placeholder | Rendered Chart | ||||||||||||||||||||||||||||||||||||
|---|---|---|---|---|---|---|---|---|---|---|---|---|---|---|---|---|---|---|---|---|---|---|---|---|---|---|---|---|---|---|---|---|---|---|---|---|---|---|
|
| 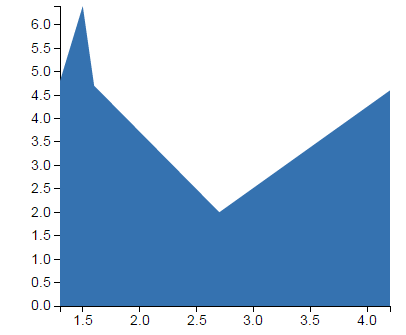 |
Time Line / Time Area chart
| Parameters in Macro Browser | Data Table in Macro Placeholder | Rendered Chart | ||||||||||||||||||||||||||||||||||||||
|---|---|---|---|---|---|---|---|---|---|---|---|---|---|---|---|---|---|---|---|---|---|---|---|---|---|---|---|---|---|---|---|---|---|---|---|---|---|---|---|---|
|
| 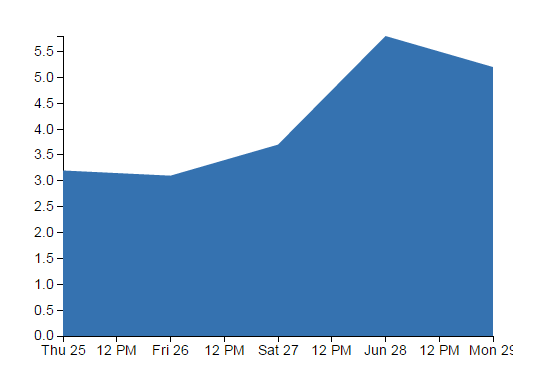 |