| Panel | ||||||
|---|---|---|---|---|---|---|
| ||||||
Table Filter for Confluence add-on allows you to transform you table data in the convenient view with the combination of Table Filter, Pivot Table and Table Chart. The combination of all these macros allows you to generate the pivot table with aggregated data that can be further used for visualization and chart generation. Filtration of your table data will also lead to automatic update of the pivot table and the chart. |
Table filter add-on allows you to combine the following macros for your better performance with data tables:
| Info |
|---|
Combining the macros is not allowed in the new Confluence Cloud editor. |
| Widget Connector | ||||||
|---|---|---|---|---|---|---|
|
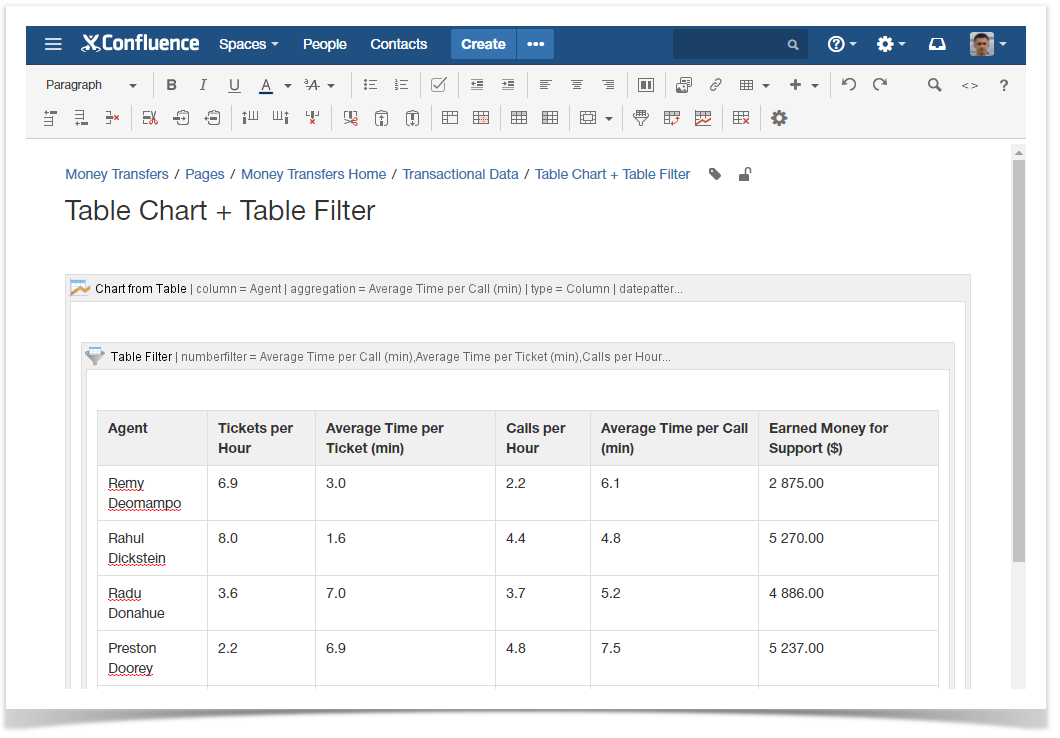
Working with Table filter and Table chart macro
- Create or import a table with data values.
- Insert the Table filter macro and place the table within the macro.
- Configure the filtration parameters. For example, add filters by number range for the corresponding columns.
- Insert the Table chart macro.
- Place the Table filter macro with the table inside the Table chart macro.
- Configure parameters of the chart. For example, select the chart type as 'Column' and select the columns with row labels and data columns.
- Save the page.
- Enter the appropriate number range in the filter. Filtration will be automatically applied to the data table and the chart will be automatically updated.
- Change the Values column for another one, if needed.
| Expand | ||||||||||||||||||||||||||||||||||||||||||||||||||||||||||||||||||||||||||||||||||||||||||||||||||||||||||||||||||||||||||||||||||||||||||||||||||||||||||||||||||||||||||||||||||||||||||||
|---|---|---|---|---|---|---|---|---|---|---|---|---|---|---|---|---|---|---|---|---|---|---|---|---|---|---|---|---|---|---|---|---|---|---|---|---|---|---|---|---|---|---|---|---|---|---|---|---|---|---|---|---|---|---|---|---|---|---|---|---|---|---|---|---|---|---|---|---|---|---|---|---|---|---|---|---|---|---|---|---|---|---|---|---|---|---|---|---|---|---|---|---|---|---|---|---|---|---|---|---|---|---|---|---|---|---|---|---|---|---|---|---|---|---|---|---|---|---|---|---|---|---|---|---|---|---|---|---|---|---|---|---|---|---|---|---|---|---|---|---|---|---|---|---|---|---|---|---|---|---|---|---|---|---|---|---|---|---|---|---|---|---|---|---|---|---|---|---|---|---|---|---|---|---|---|---|---|---|---|---|---|---|---|---|---|---|---|---|
| ||||||||||||||||||||||||||||||||||||||||||||||||||||||||||||||||||||||||||||||||||||||||||||||||||||||||||||||||||||||||||||||||||||||||||||||||||||||||||||||||||||||||||||||||||||||||||||
|

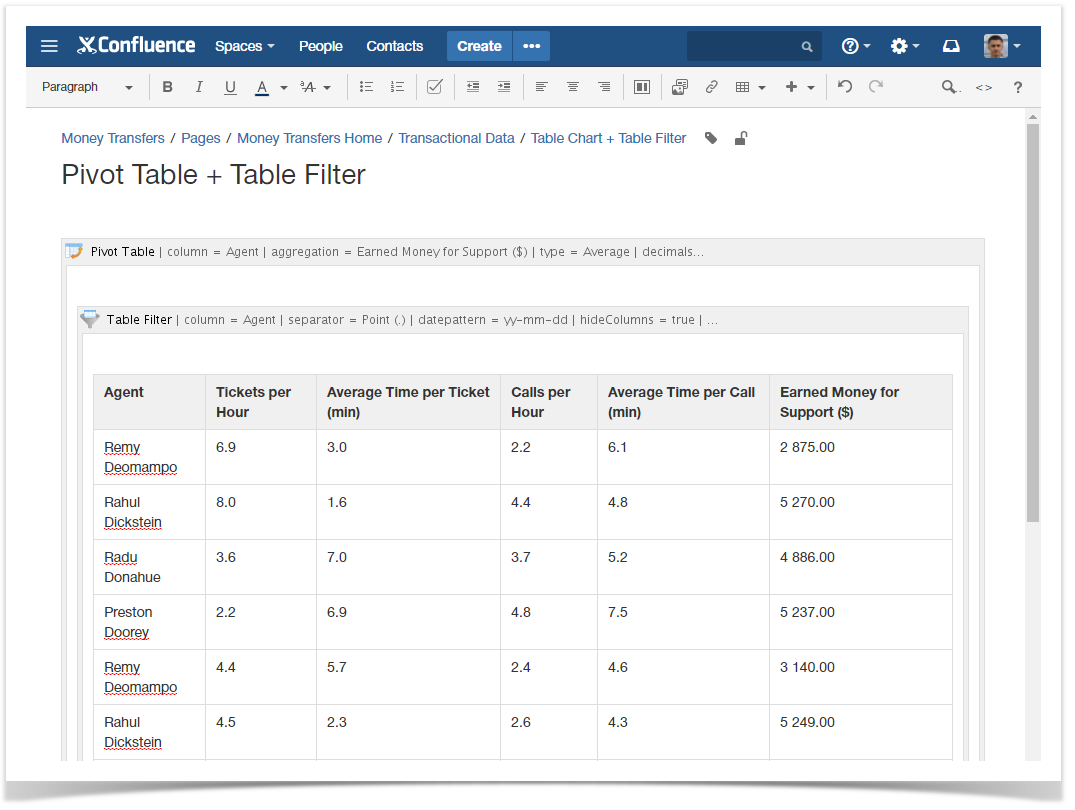
Working with Table filter and Pivot table macro
- Create or import a table with data values.
- Insert the Table filter macro and place the table within the macro.
- Configure the filtration parameters. For example, add the filter by agent.
- Insert the Pivot table macro.
- Place the Table filter macro with the table inside the Pivot table macro.
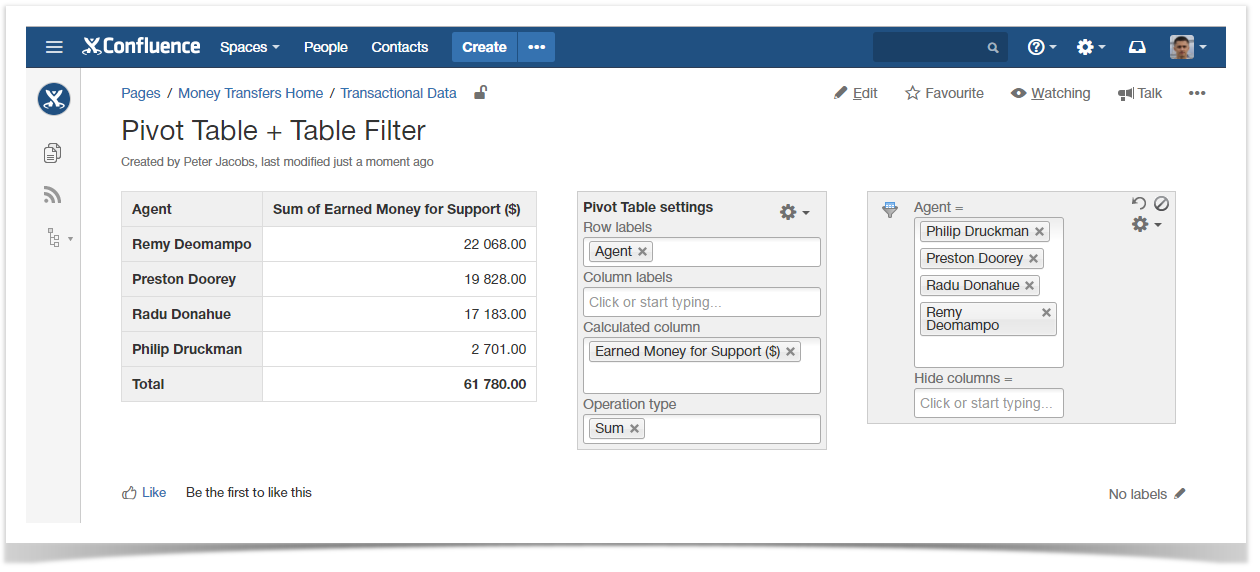
- Configure parameters of the pivot table. For example, select the Agent column as row labels and the Earned Money for Support as the calculated column.
- Save the page.
- Select the appropriate agents in the filter. Filtration will be automatically applied to the data table and the pivot table will be automatically updated.
- Change the calculated column for another one, if needed.
| Expand | ||||||||||||||||||||||||||||||||||||||||||||||||||||||||||||||||||||||||||||||||||||||||||||||||||||||||||||||||||||||||||||||||||||||||||||||||||||||||||||||||||||||||||||||||||||||||||
|---|---|---|---|---|---|---|---|---|---|---|---|---|---|---|---|---|---|---|---|---|---|---|---|---|---|---|---|---|---|---|---|---|---|---|---|---|---|---|---|---|---|---|---|---|---|---|---|---|---|---|---|---|---|---|---|---|---|---|---|---|---|---|---|---|---|---|---|---|---|---|---|---|---|---|---|---|---|---|---|---|---|---|---|---|---|---|---|---|---|---|---|---|---|---|---|---|---|---|---|---|---|---|---|---|---|---|---|---|---|---|---|---|---|---|---|---|---|---|---|---|---|---|---|---|---|---|---|---|---|---|---|---|---|---|---|---|---|---|---|---|---|---|---|---|---|---|---|---|---|---|---|---|---|---|---|---|---|---|---|---|---|---|---|---|---|---|---|---|---|---|---|---|---|---|---|---|---|---|---|---|---|---|---|---|---|---|
| ||||||||||||||||||||||||||||||||||||||||||||||||||||||||||||||||||||||||||||||||||||||||||||||||||||||||||||||||||||||||||||||||||||||||||||||||||||||||||||||||||||||||||||||||||||||||||
|