Download PDF
Download page People.
People
The People feature allows you to get a global view of developers' activity across all projects to find out who made more commits and pull requests and capture the dynamics of each person. It also offers the exporting capabilities for further integration, organization, and processing in analytics tools and custom solutions.
Below on the page, you'll find:
- a detailed description of all elements
- a description of the exporting capabilities
For easier navigation, use the Table of Contents at the top-right of the page.
Get a view of developers' activity
Awesome Graphs adds the People dropdown menu in the Bitbucket Server / DC header and a separate People page.
People dropdown menu
The menu shows the list of Bitbucket Server / DC users whose Contributions graphs were recently viewed. The All users link leads to the People page with a list of contributors across all repositories
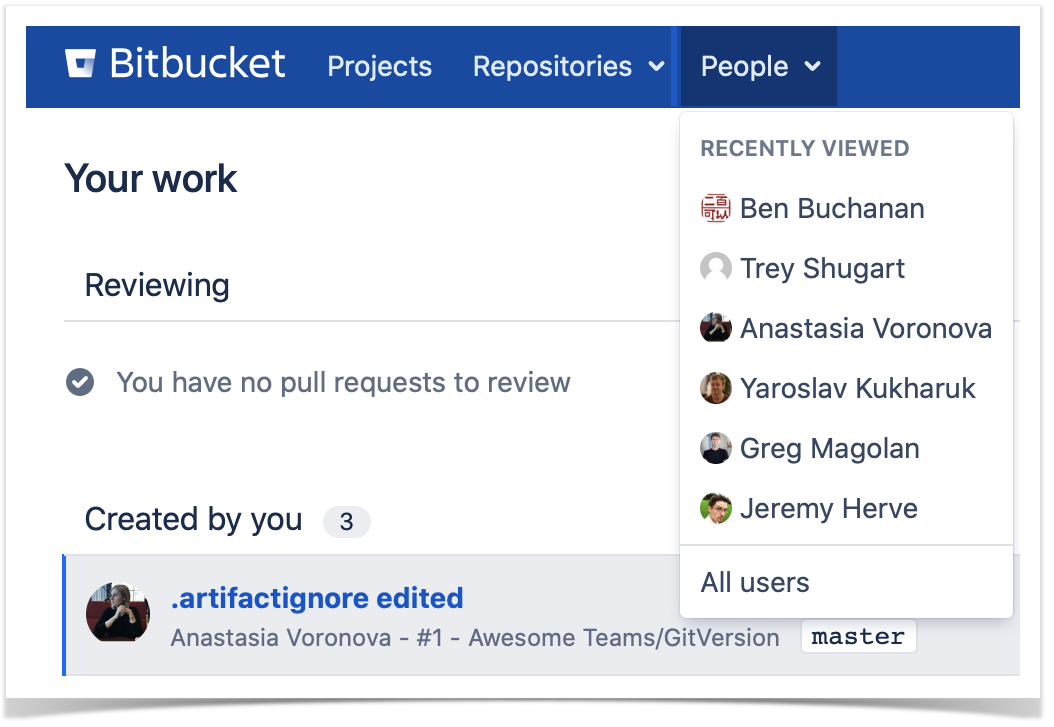
Recently Viewed
The Recently Viewed category of the People dropdown menu comprises the list of Bitbucket Server / DC users whose Contributions graphs were recently viewed in their Bitbucket Server / DC user profiles. As you click one of the names on that list, the Contributions tab of that Bitbucket Server / DC user profile is opened, so you can see the user's Contributor Calendar and Contribution Activity Stream.
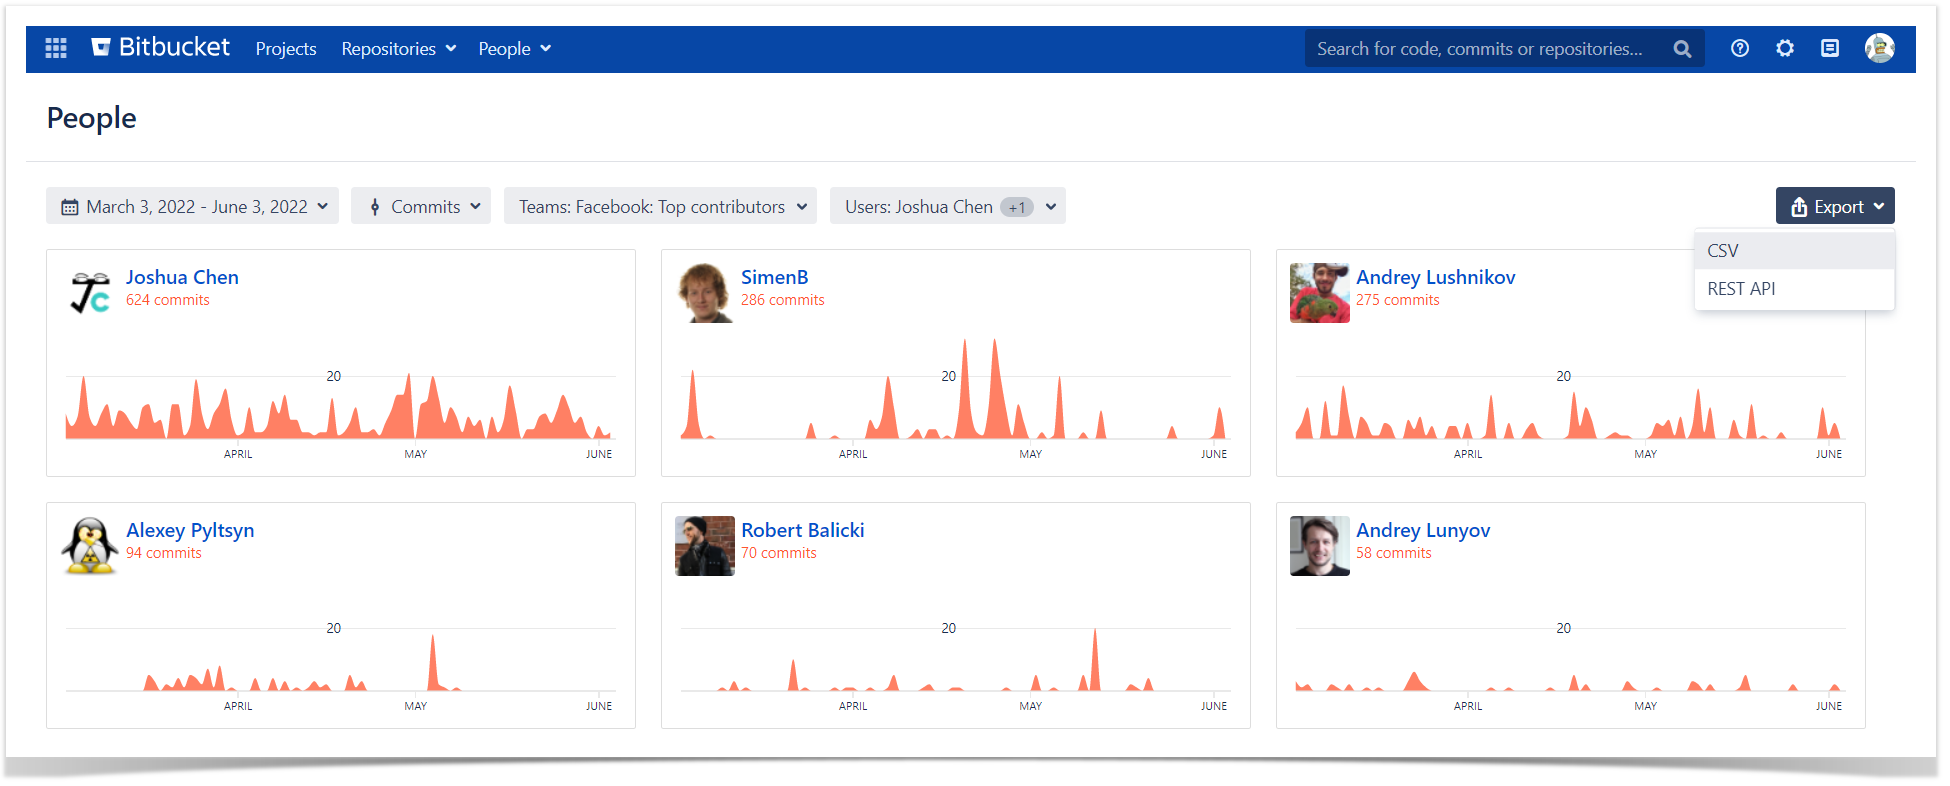
People page
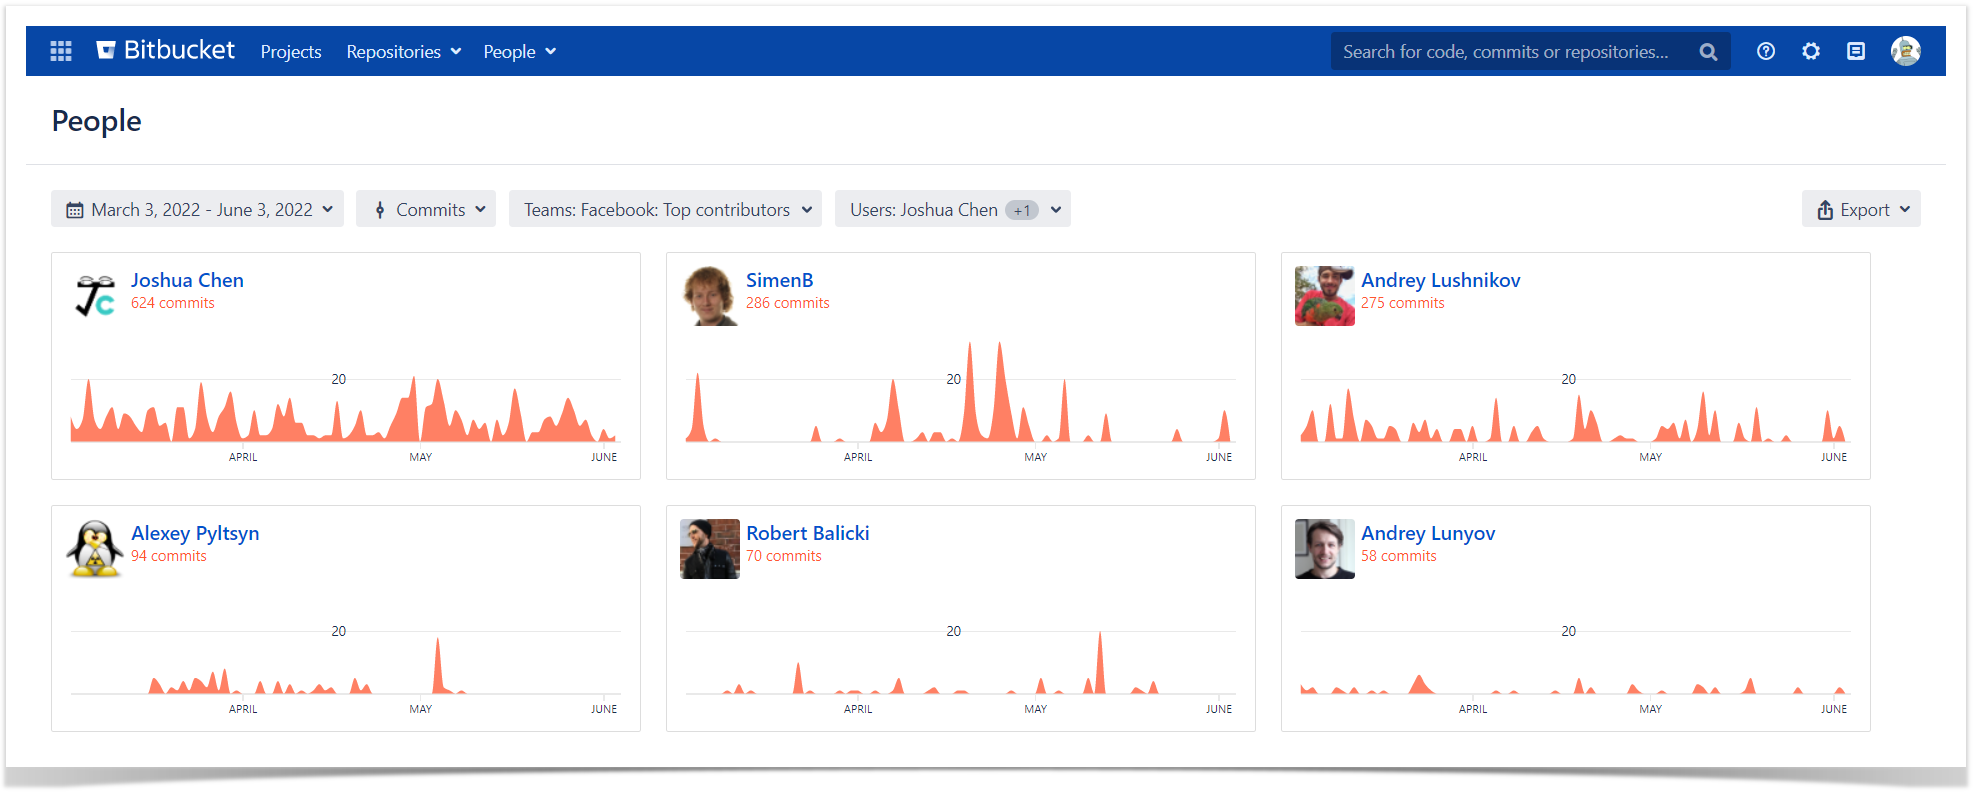
When you click All users in the People dropdown menu, the People page is opened. There you can see who made commits or created pull requests during the past month.
This page shows stats across all repositories and projects, which gives you a global view of developer activity. Each developer card has a graph and stats (number of commits or pull requests). Developer cards are sorted by the number of contributions made within a selected time span. It can help you understand who's been most active.
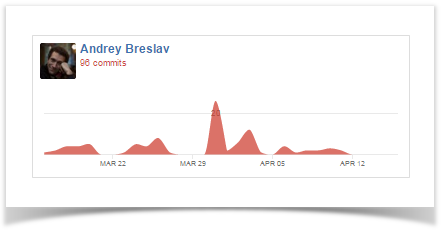
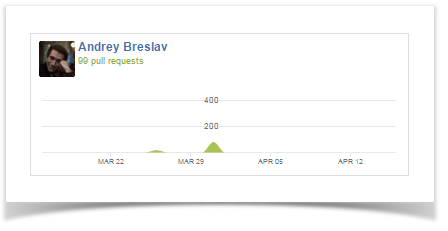
Contributor cards include:
- personal Contributor graph representing individual contributions filtered according to a selected time span and activity type
- total of commits
- total of pull requests
Contributor names can be text or links. If it's text, that means that the contributor is not a Bitbucket Server / DC user. For Bitbucket Server / DC users, contributor names are links to the Contributions tab in their Bitbucket Server / DC user profile.
On the top bar, there are two sections with options for filtering contributors: Time Span and Activity Type.
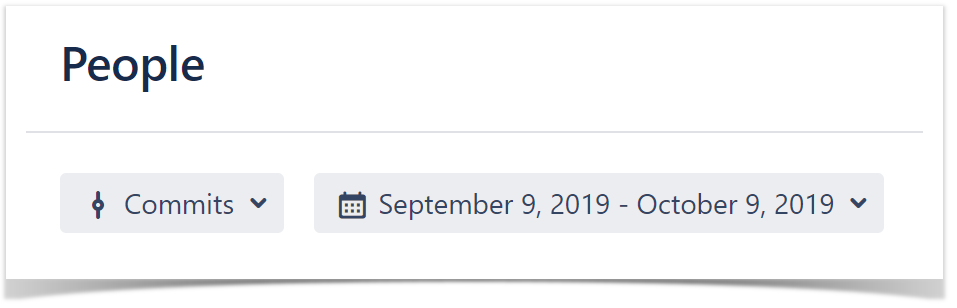
Time Span
When you select one of the time span options, the list of contributors is updated and shows only contributors with contributions made during a chosen time span sorted by the number of contributions. Time Span options include:
- last 24 hours
- last 3 days
- last week
- last month
- last quarter
- custom
By default, the list of contributors is rendered based on contributions made during the last month.
Activity Type
When you select one of the activity types, all contributions are filtered and Contributor graphs are rendered based only on the number of contributions of that activity type. The Activity Type section includes the following options:
- Commits
- Pull requests
By default, the list of contributors is created based on commits.
If Pull requests is selected, the Contributor graph displays only pull requests.
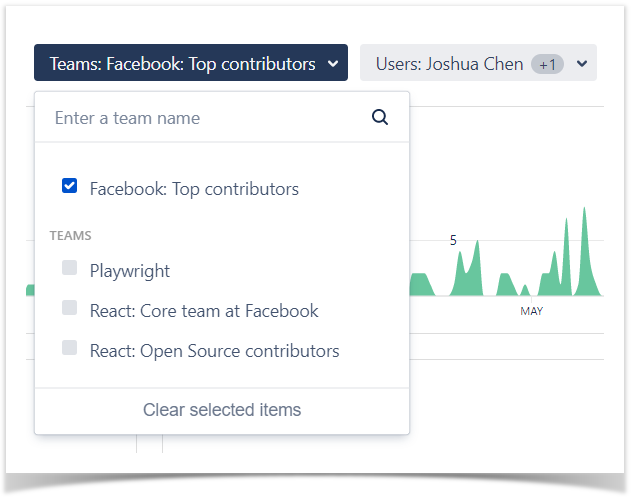
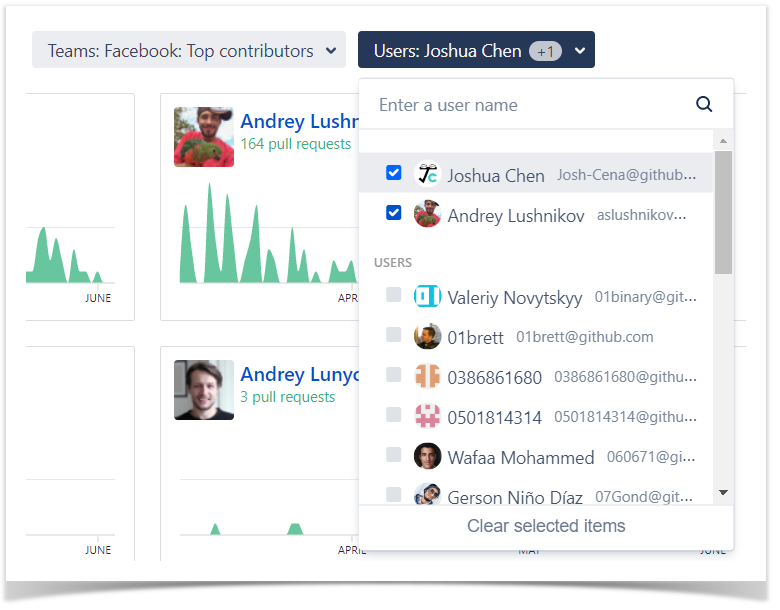
Teams and Users
You can select multiple teams and users, separately and combined, to filter the results shown on the page and exported, making it easier to analyze the activity of individual users and teams on the global level.
Export the People data
Awesome Graphs for Bitbucket gives you the capability to export the data for further integration, organization, and processing in analytics tools and custom solutions in different ways.
Export to CSV
You can export raw data with the statistics across all projects and repositories to a CSV file. As a result, you will get the list of the commits or pull requests made during the selected time span with their details.
This data can be exported using the Export button at the top-right of the People page and used to:
- Create custom graphs and apply different filters and sorting options in Excel, Tableau, Google Spreadsheets, and so on.
- Integrate it to your analytics tool (e.g., Tableau, Grafana, Power BI) to identify trends in comparison with the data from Jira and other sources.
- Get the number of lines of code added and deleted by a user across all projects and repositories.
- Create a report based on the developers' activity to share it with stakeholders.
The data for a CSV file is gathered based on the activity type and period of time you choose on the top of the page. In order to export the data click the Export button and choose CSV.
Read more about exporting to CSV and what data is included in a report.
REST API
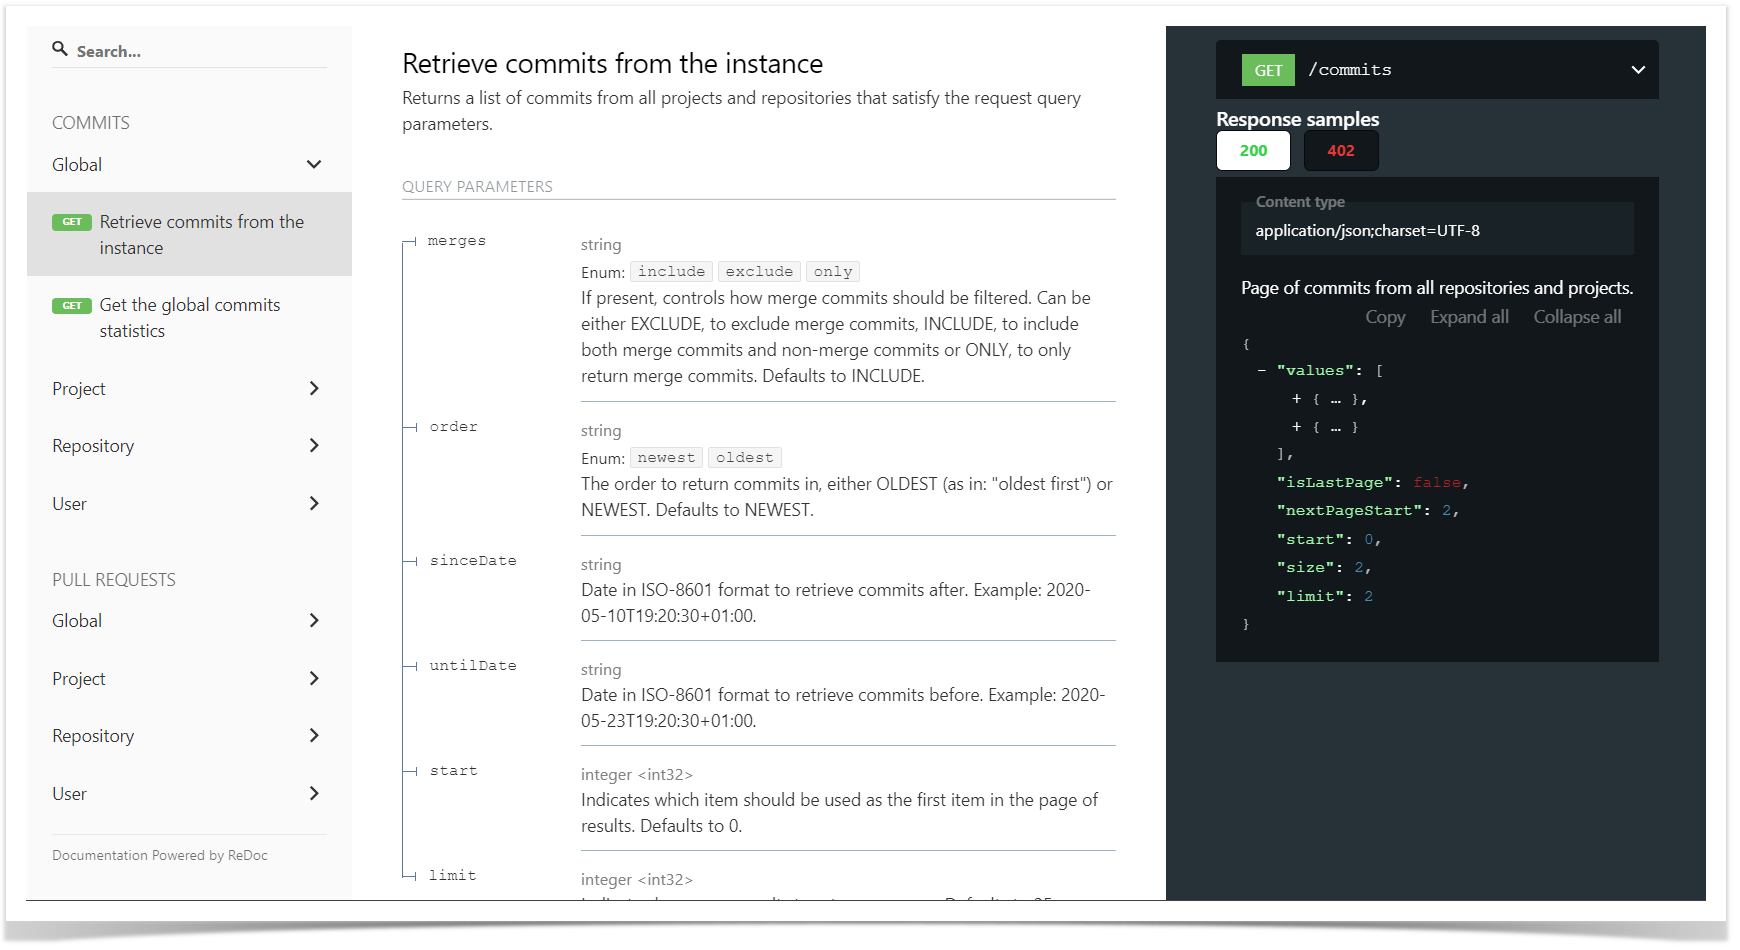
The Awesome Graphs' REST API gives you the capability to export raw data about commits, lines of code, and pull requests. Using it, you can:
- Integrate seamlessly with analytics platforms.
- Build custom graphs.
- Aggregate and merge data from Bitbucket, and other sources.
You can access the REST API reference documentation at the People page by clicking on Export > REST API or via the link: <bitbucket-host>/plugins/servlet/graphs-api.