| Warning |
|---|
This version of the app's documentation is outdated. Please find the information you're looking for here:Visualizing of the Amount of Planned and Spent Time Within the Project |
| Excerpt | ||
|---|---|---|
| ||
Visualizing of the Amount of Planned and Spent Time Within the Project
|
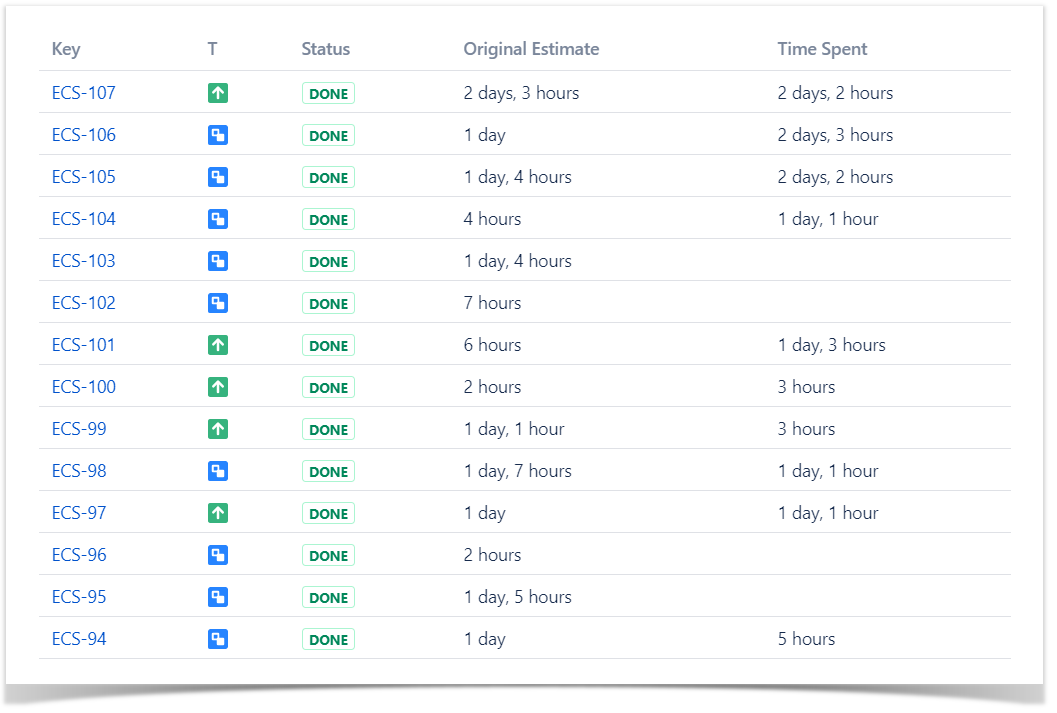
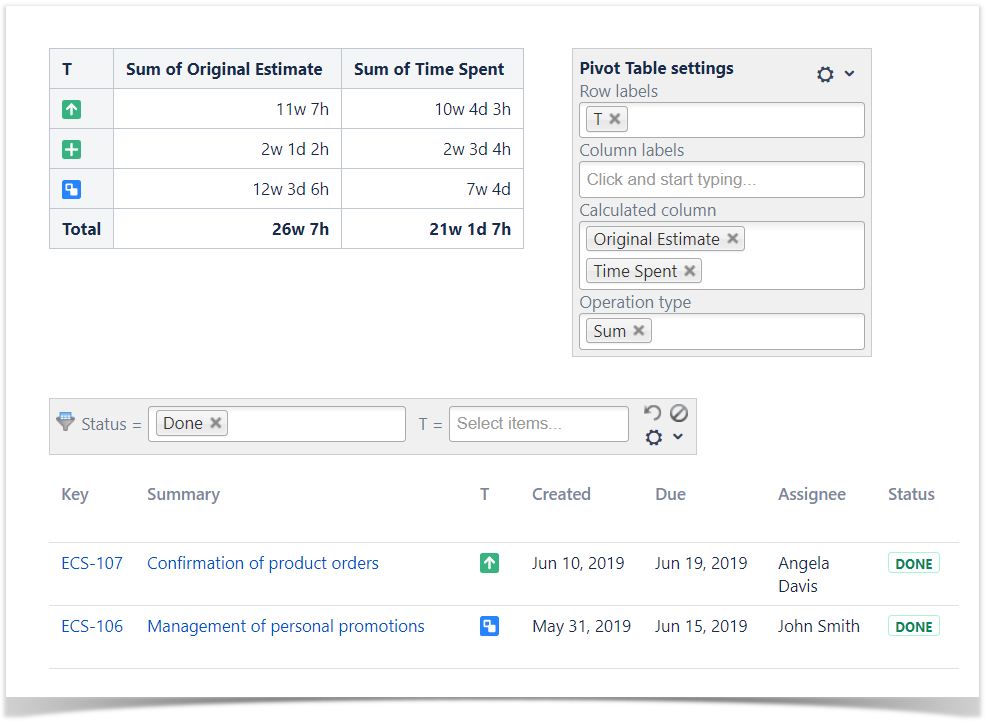
The Source Table:
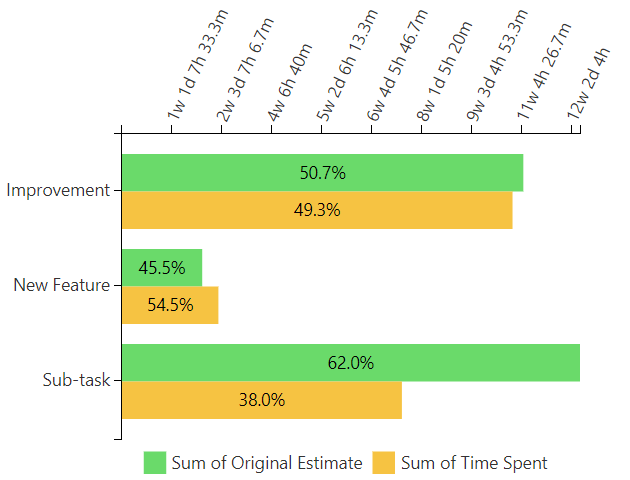
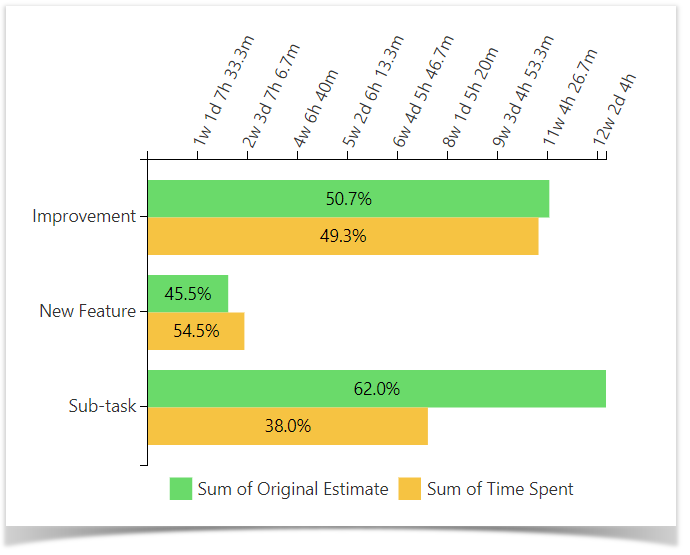
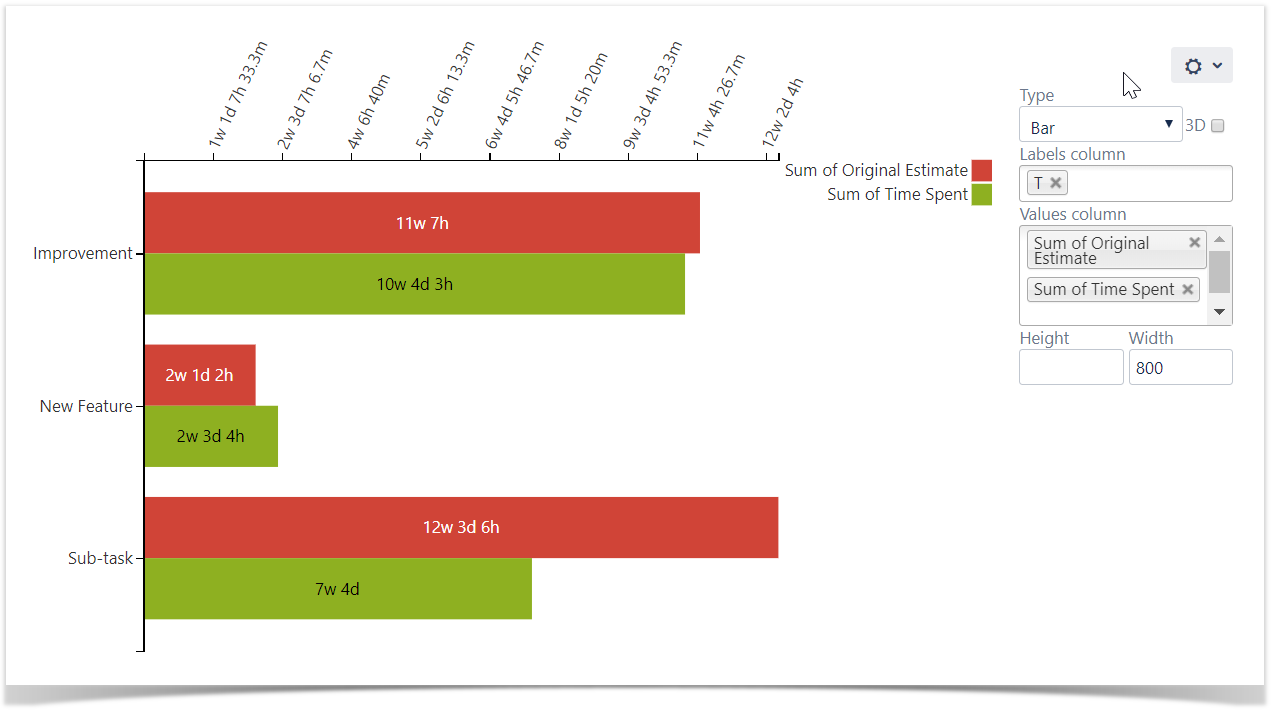
The Result:
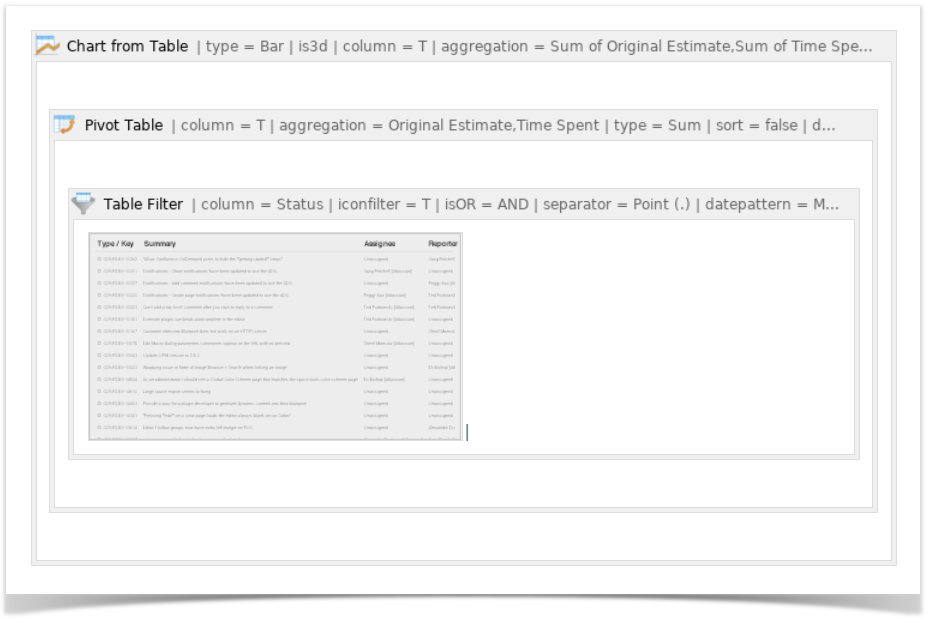
Macro combination:
- Insert the Jira Issues macro.
- Wrap the Jira Issues macro in the Table Filter macro.
- Wrap the Table Filter macro in the Pivot Table macro.
- Wrap the Pivot Table macro in the Chart from Table macro.
Macro configuration:
Table Filter:
| Filter Column | Status |
|---|---|
| Filter Type | Dropdown |
| Filter Values | Done |
Pivot Table:
| Row Labels | T |
|---|---|
| Column Labels | - |
| Calculated Column | Original Estimate, Time Spent |
| Operation Type | Sum |
Chart from Table:
| Type | Bar |
|---|---|
| Labels Column | T |
| Values Column | Sum of Original Estimate, Sum of Time Spent |
| Handy Carousel |
|---|
|
| Excerpt Include | ||||||
|---|---|---|---|---|---|---|
|