| Warning |
|---|
This version of the app's documentation is outdated. Please find the information you're looking for here:Building a Gantt Chart |
| Excerpt | ||
|---|---|---|
| ||
Building a Gantt Chart
|
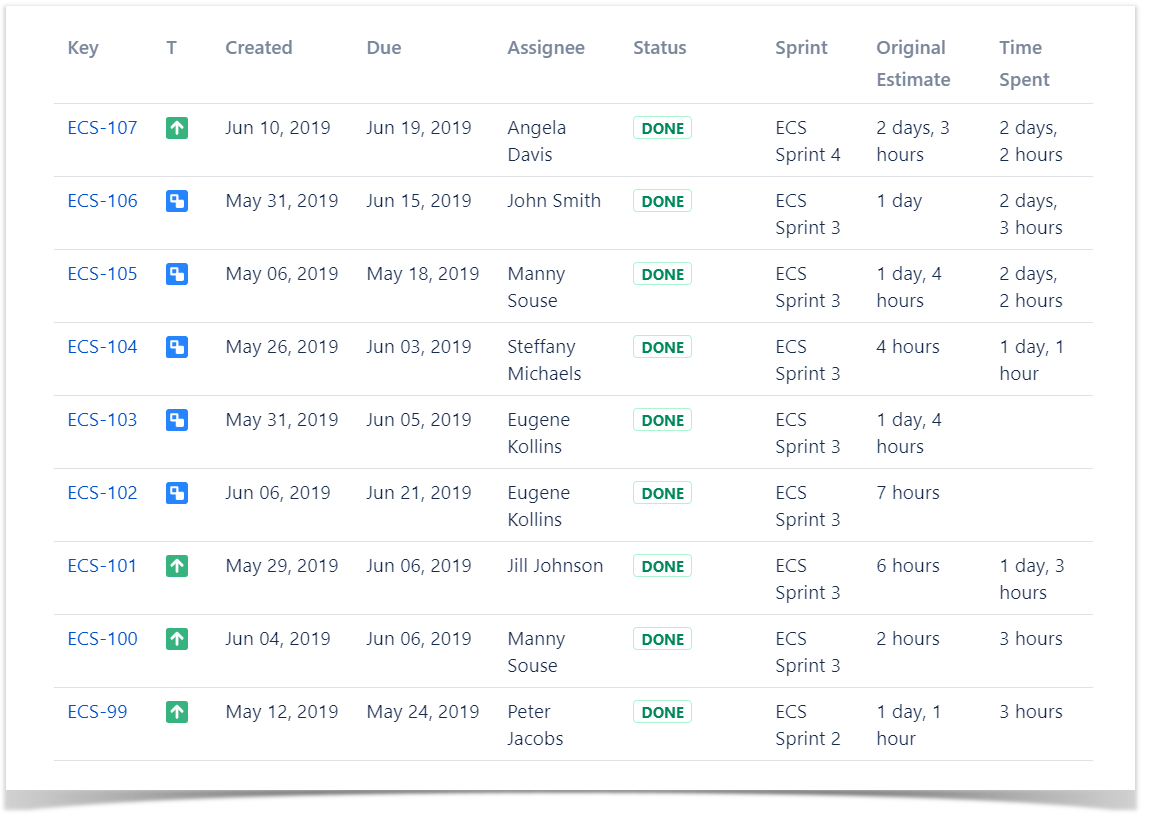
The Source Table:
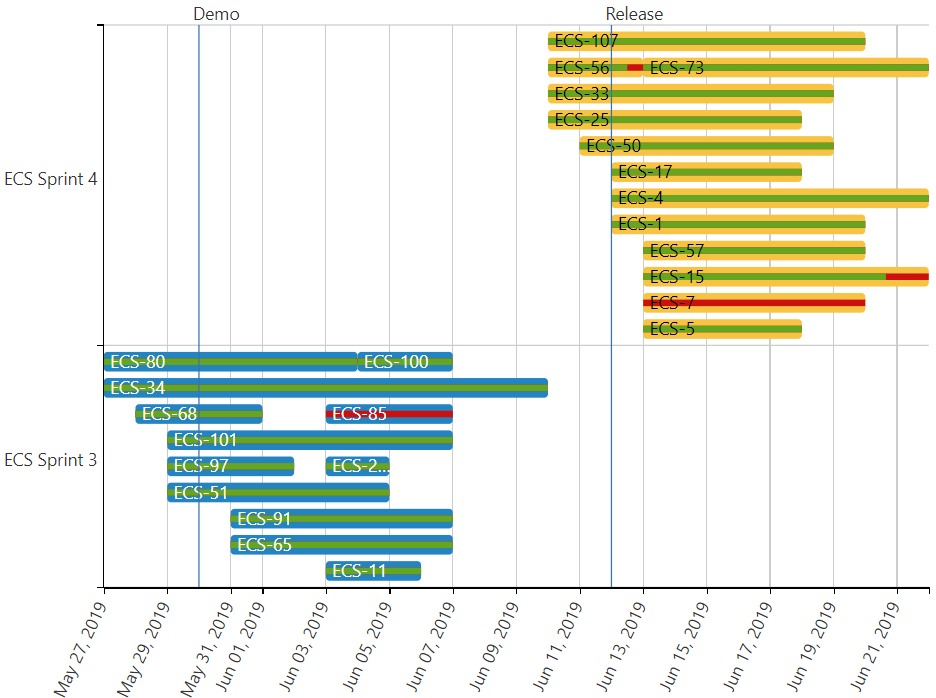
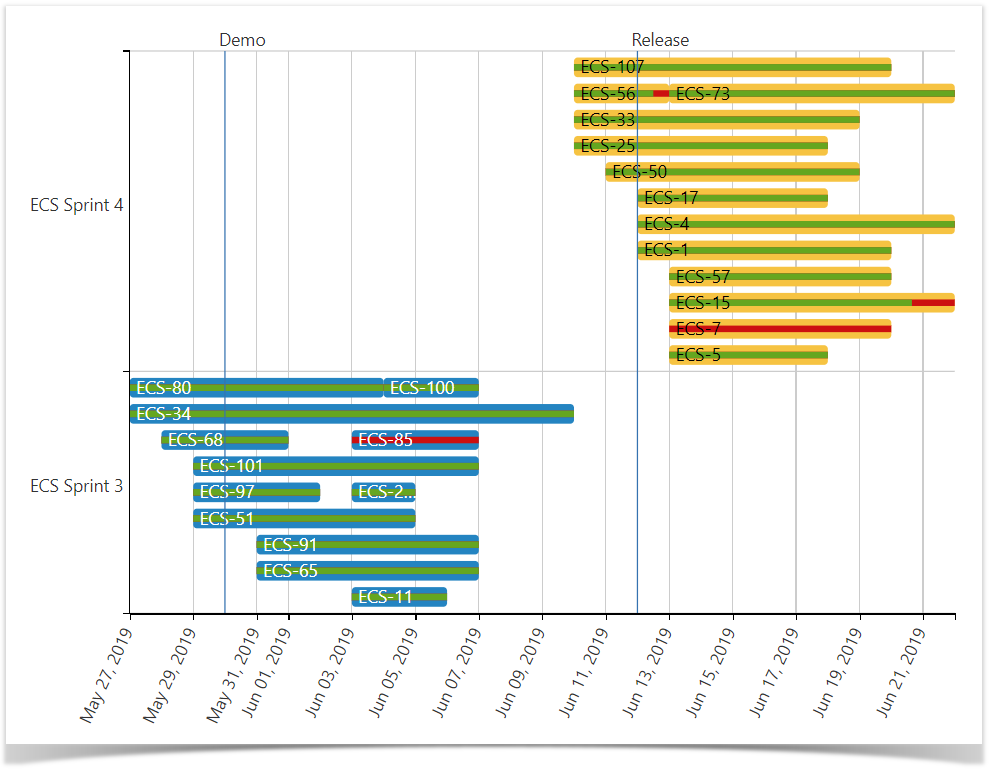
The Result:
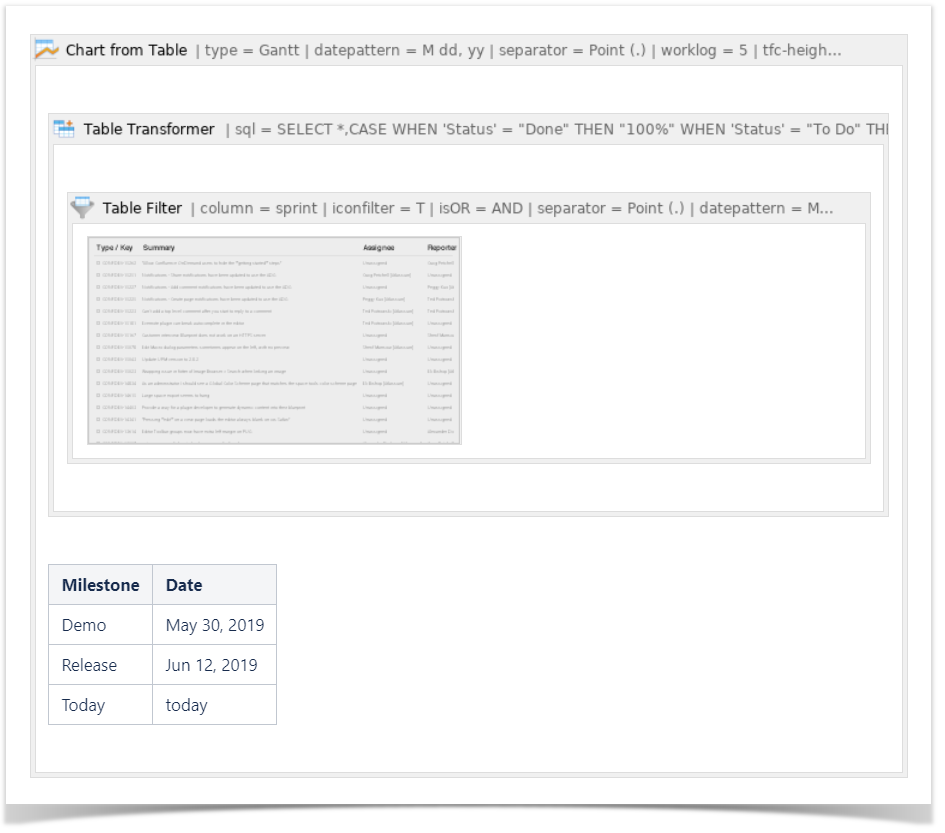
Macro combination:
- Insert the Jira Issues macro.
- Wrap the Jira Issues macro in the Table Filter macro.
- Wrap the Table Filter macro in the Table Transformer macro.

- Add a table containing project milestones.

- Wrap the Table Filter macro and the table containing milestones in the Table Transformer macro.
- Wrap the Table Transformer macro and the table in the Chart from Table macro.
| Handy Tip | ||
|---|---|---|
| ||
You can include any table from your Confluence instance using the Table Excerpt and Table Excerpt Include macros or use any default and custom columns of the Jira Issues macro. |
| Handy Tip | ||
|---|---|---|
| ||
We insert the Table Transformer macro in order to calculate the Completion ratio based on the Jira Issues macro columns. If you have any other column containing percentage values or don't need to visualize progress bars in the chart, you can skip this step. |
Macro configuration:
Table Filter:
| Filter Column | Issue type | Sprint |
|---|---|---|
| Filter Type | Visual | Dropdown |
| Filter Values | New feature, Improvement | ECS Sprint 2, ECS Sprint 3, ECS Sprint 4 |
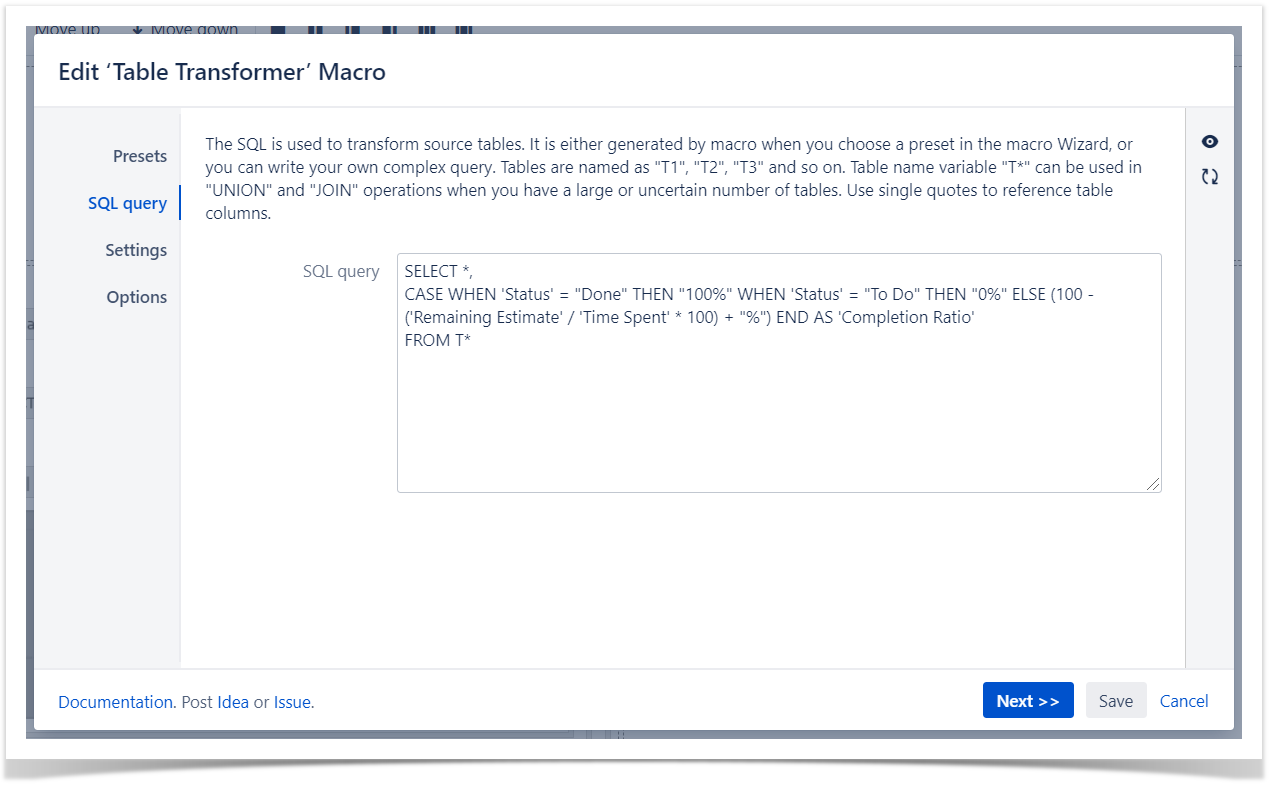
Table Transformer:
Use the following SQL query:
| Code Block | ||
|---|---|---|
| ||
SELECT *,
CASE WHEN 'Status' = "Done"
THEN "100%"
WHEN 'Status' = "To Do"
THEN "0%"
ELSE (100 - ('Remaining Estimate' / 'Time Spent' * 100) + "%")
END AS 'Completion Ratio'
FROM T* |
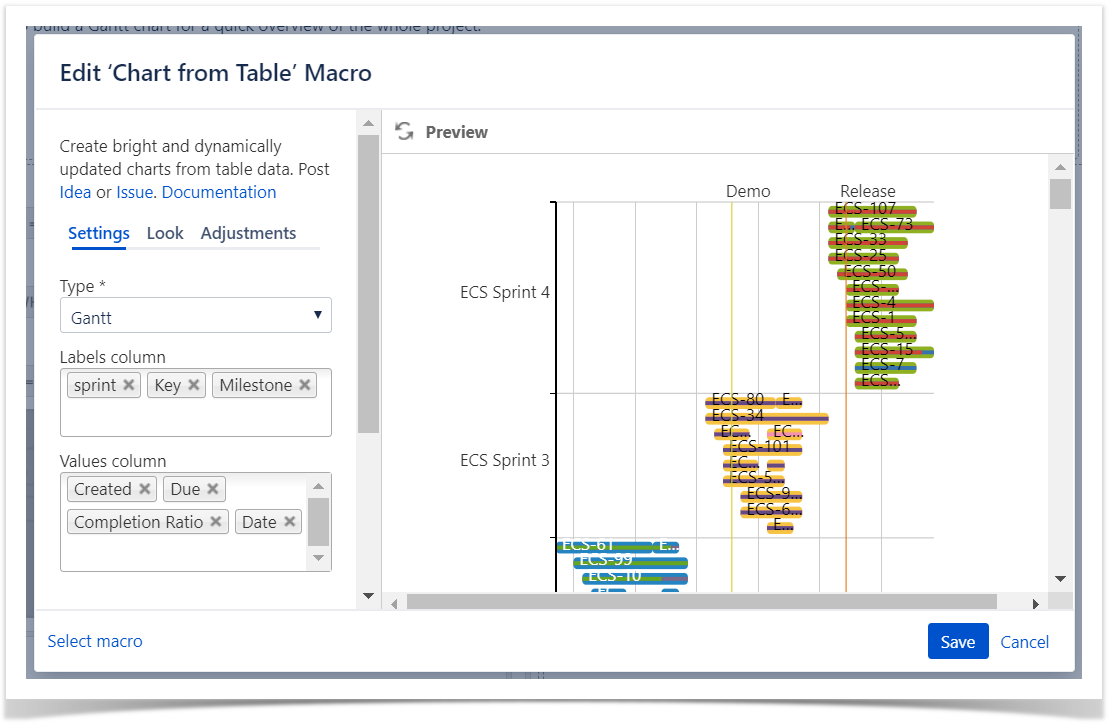
Chart from Table:
| Type | Gantt |
|---|---|
| Labels Column | Sprint, Key, Milestone |
| Values Column | Created, Due, Completion ratio, Date |
| Handy Carousel |
|---|
|
| Excerpt Include | ||||||
|---|---|---|---|---|---|---|
|