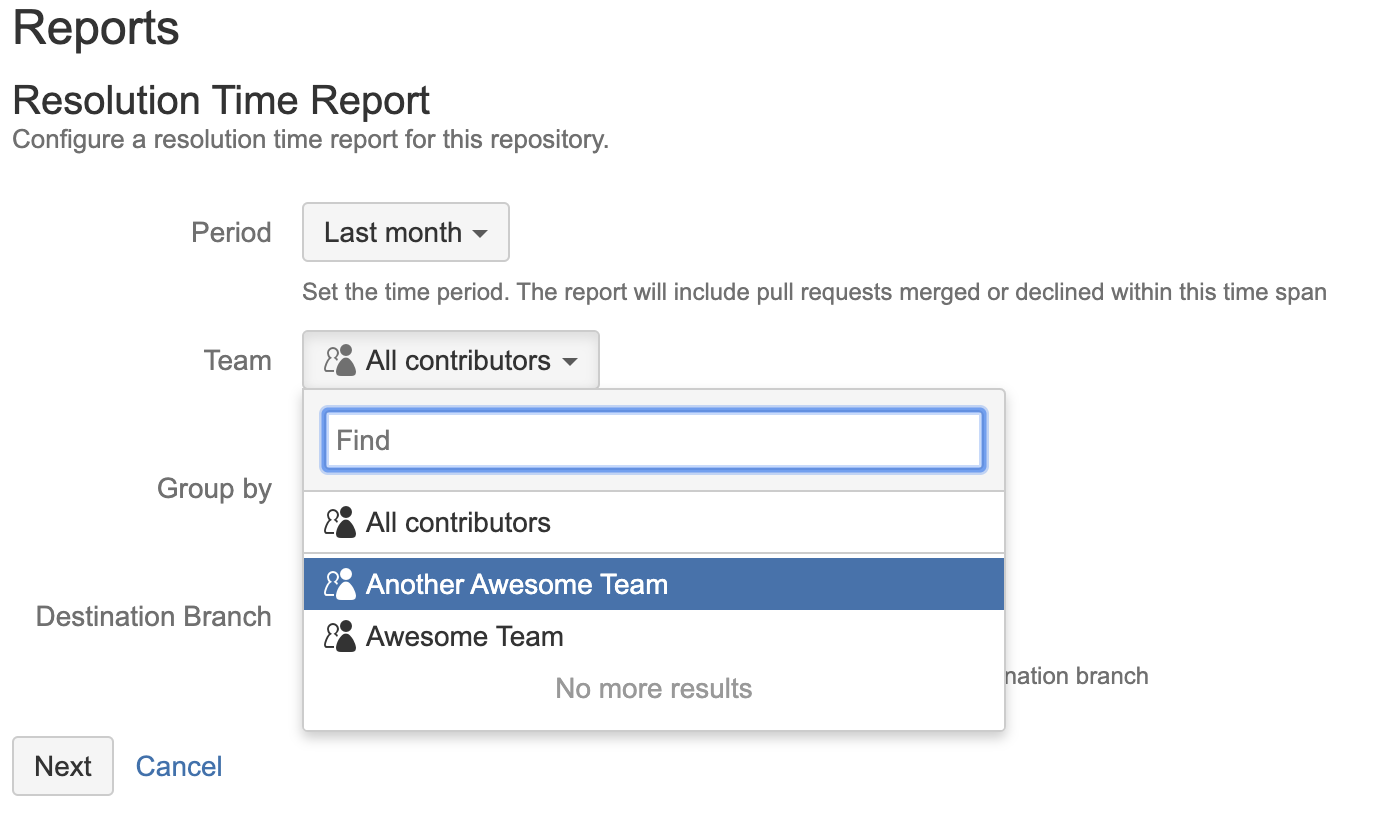
In this release, we added the ability of watching pull requests and commits reports for teams. Using this feature, you can:
analyze code review processes of a single team, excluding contributors from the others
compare the statistics for pull requests of several teams
exclude the data added by automated users from reports.
Before that, it was only possible to see the team's statistics on the Graphs page. Read more about teamshere.
Also in this release
Fixed the issue that occurred while watching the Pie Chart report grouped by author or reviewer when there're more than 1000 users to display. Errors happened in Bitbucket instances with the Oracle database.
Changed column names in exported CSV files. We replaced the User Display Name with the Author Name, and the Bitbucket Username with the Author Username columns in the lists of commits to make them similar to the lists of pull requests exported to CSV. Identical names make it easier to create pivot tables and graphs with the data for both commits and pull requests using the Table Filter and Charts for Confluence app.
Cookie Notice
This website uses cookies for analytics, personalization and advertising. By continuing to browse, you agree to our use of cookies. Learn more