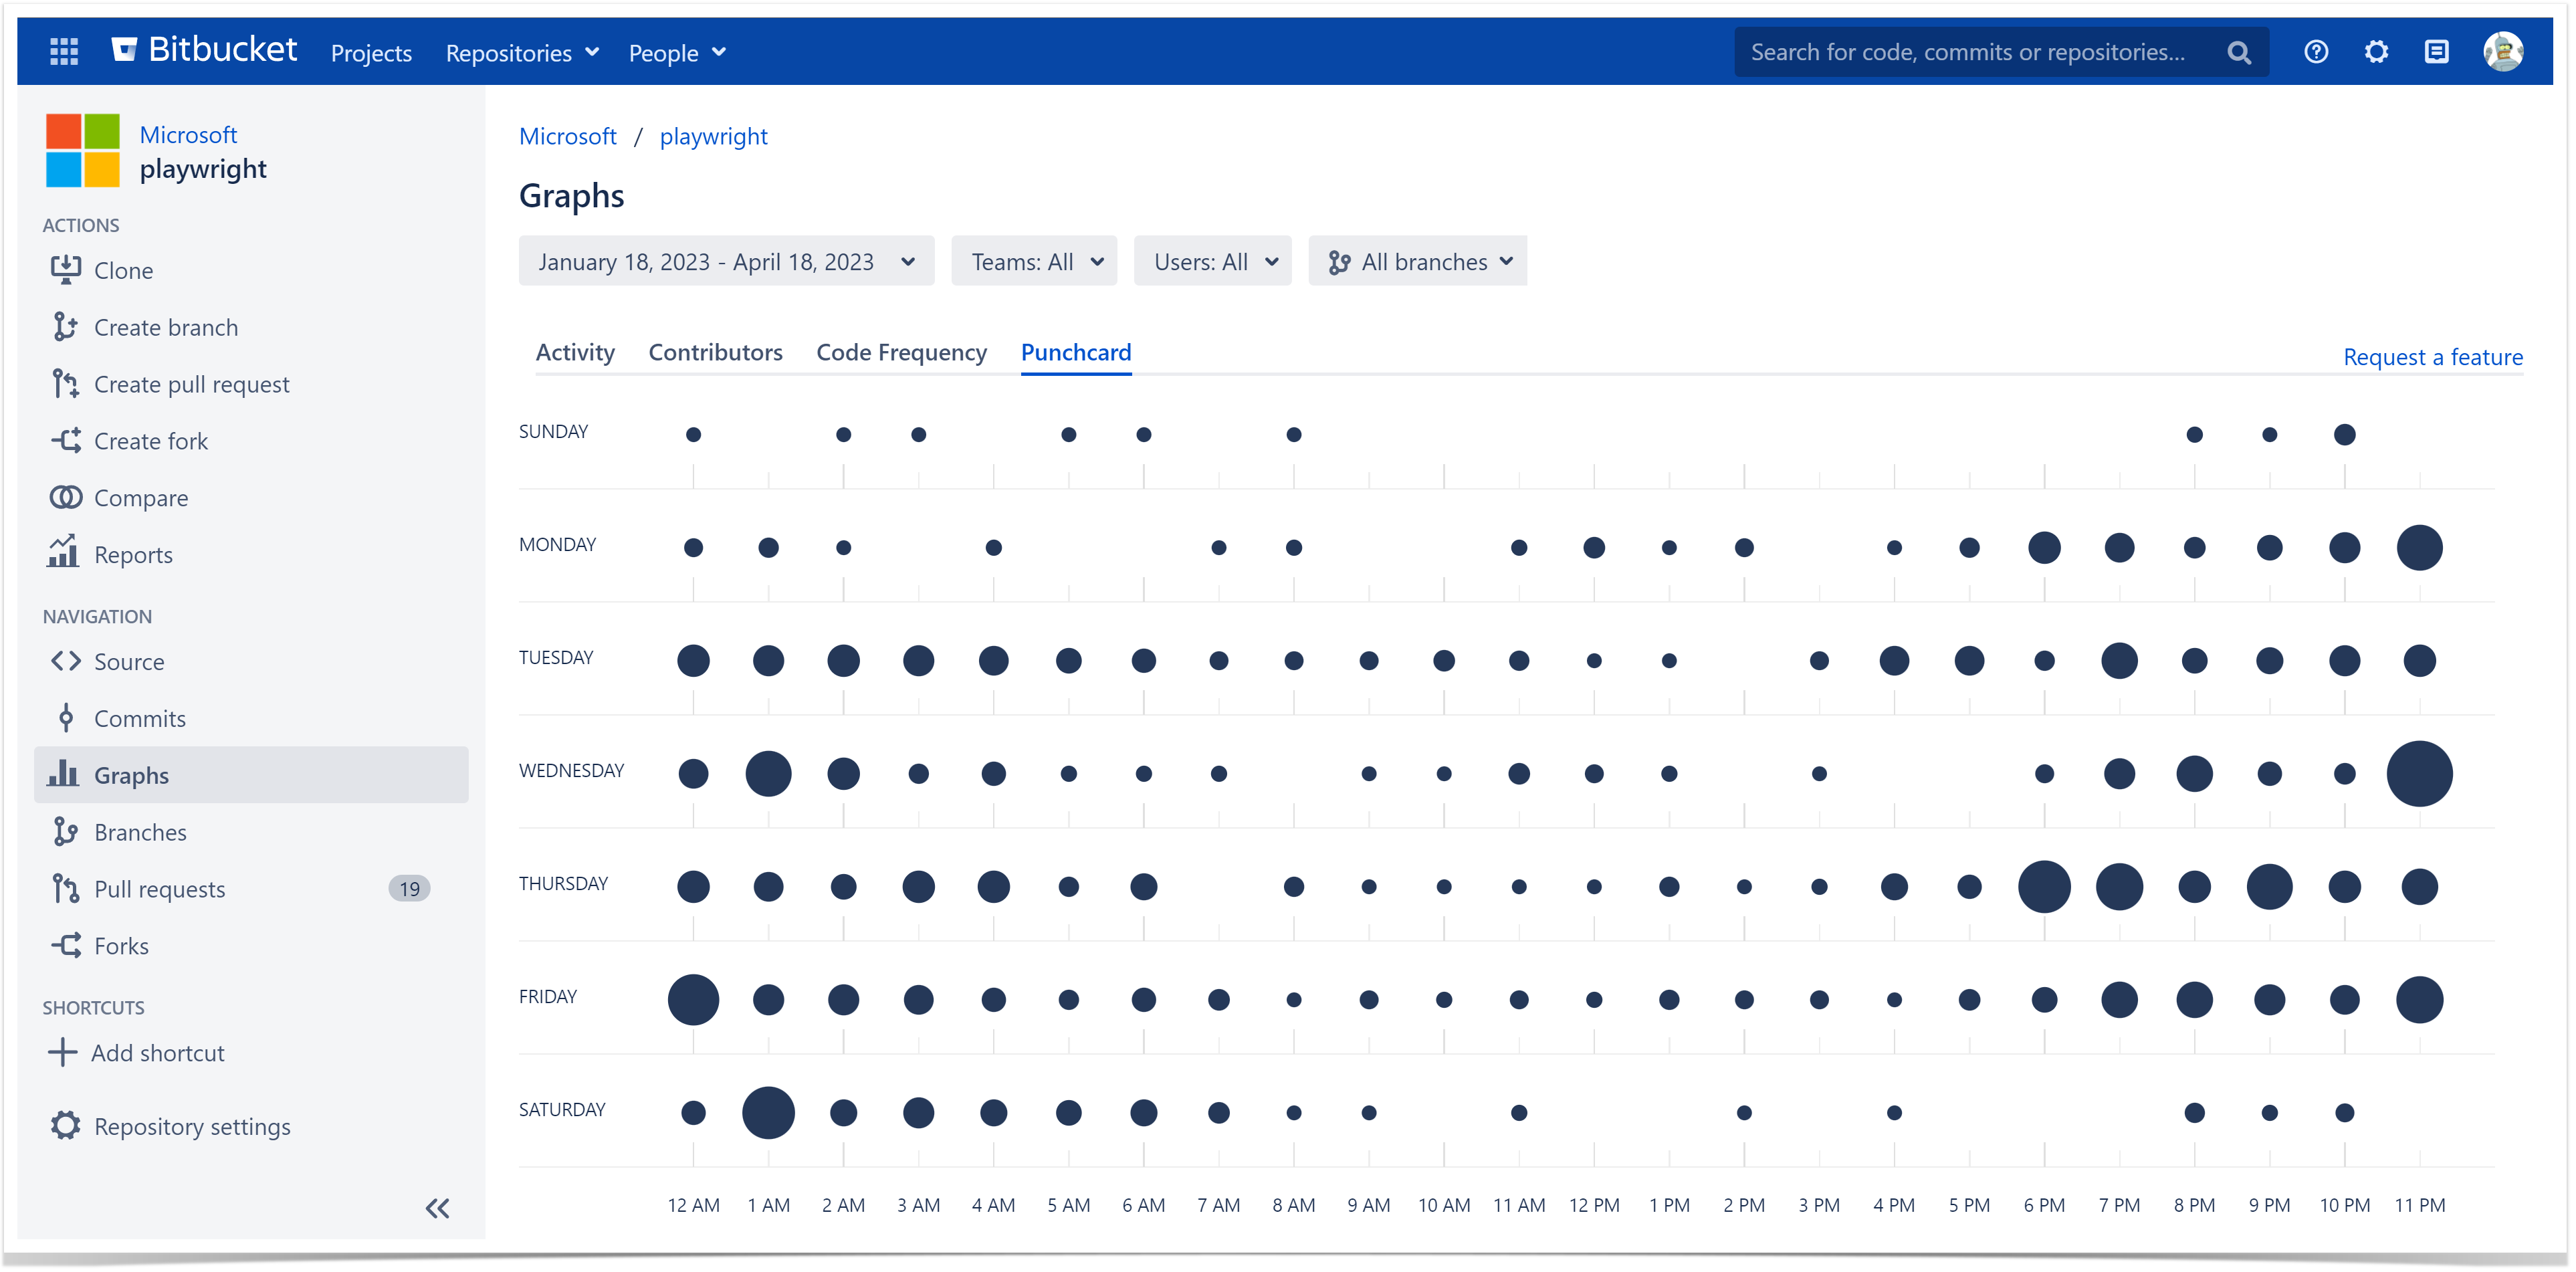
In the Punchcard tab of the Graphs page, you can see a commit summary by day of the week and hour.
Below on the page, you'll find:
- instructions on how to view the Punchcard graph for projects and repositories
- a detailed description of all elements
- an overview of the filtering capabilities
For easier navigation, use the Table of Contents at the top-right of the page.
How to view the Punchcard graph
The Punchcard graph is available both on the project and repository levels. To view the Punchcard graph:
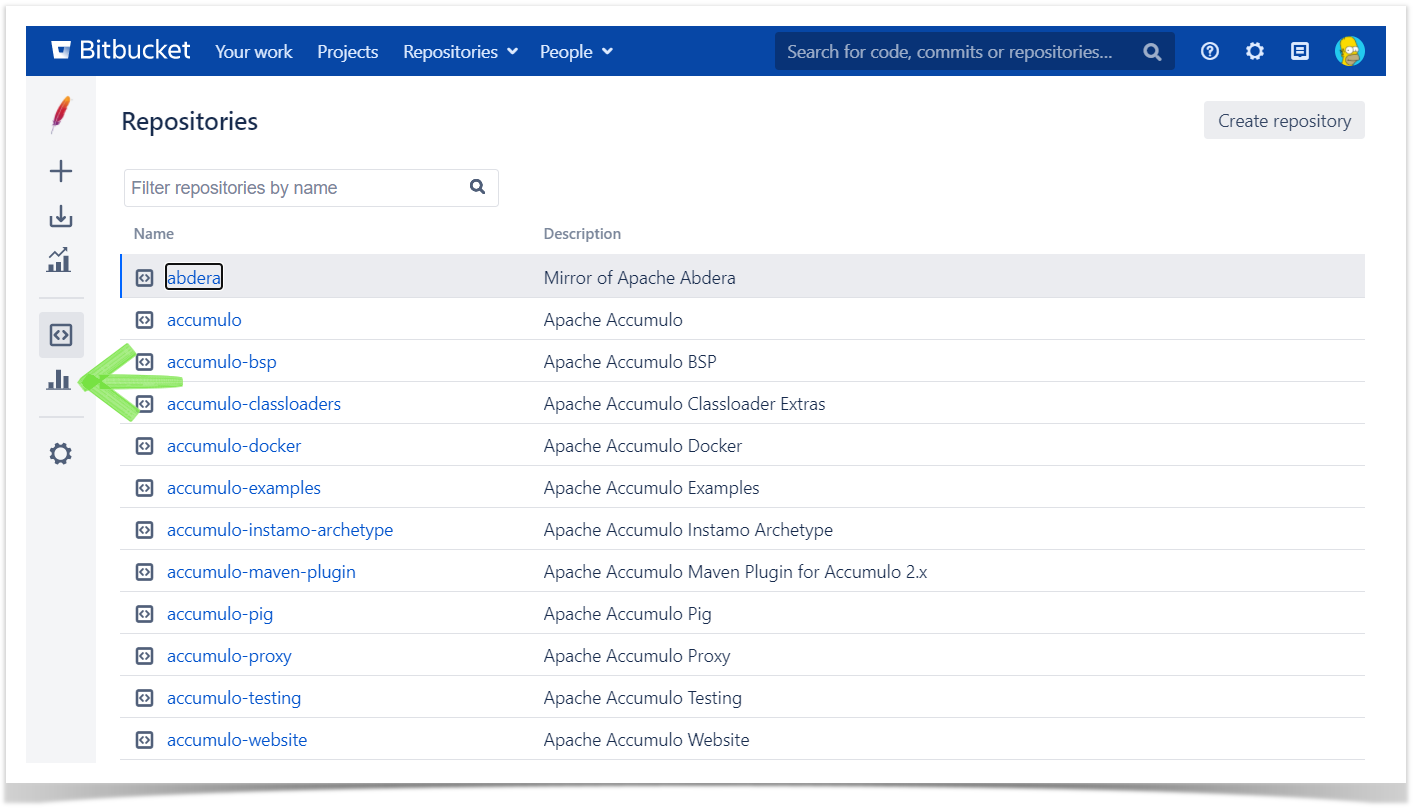
- Navigate to the project or repository of your choice.
- Click on the Graphs icon in the left-hand sidebar.
- Choose the Punchcard tab.
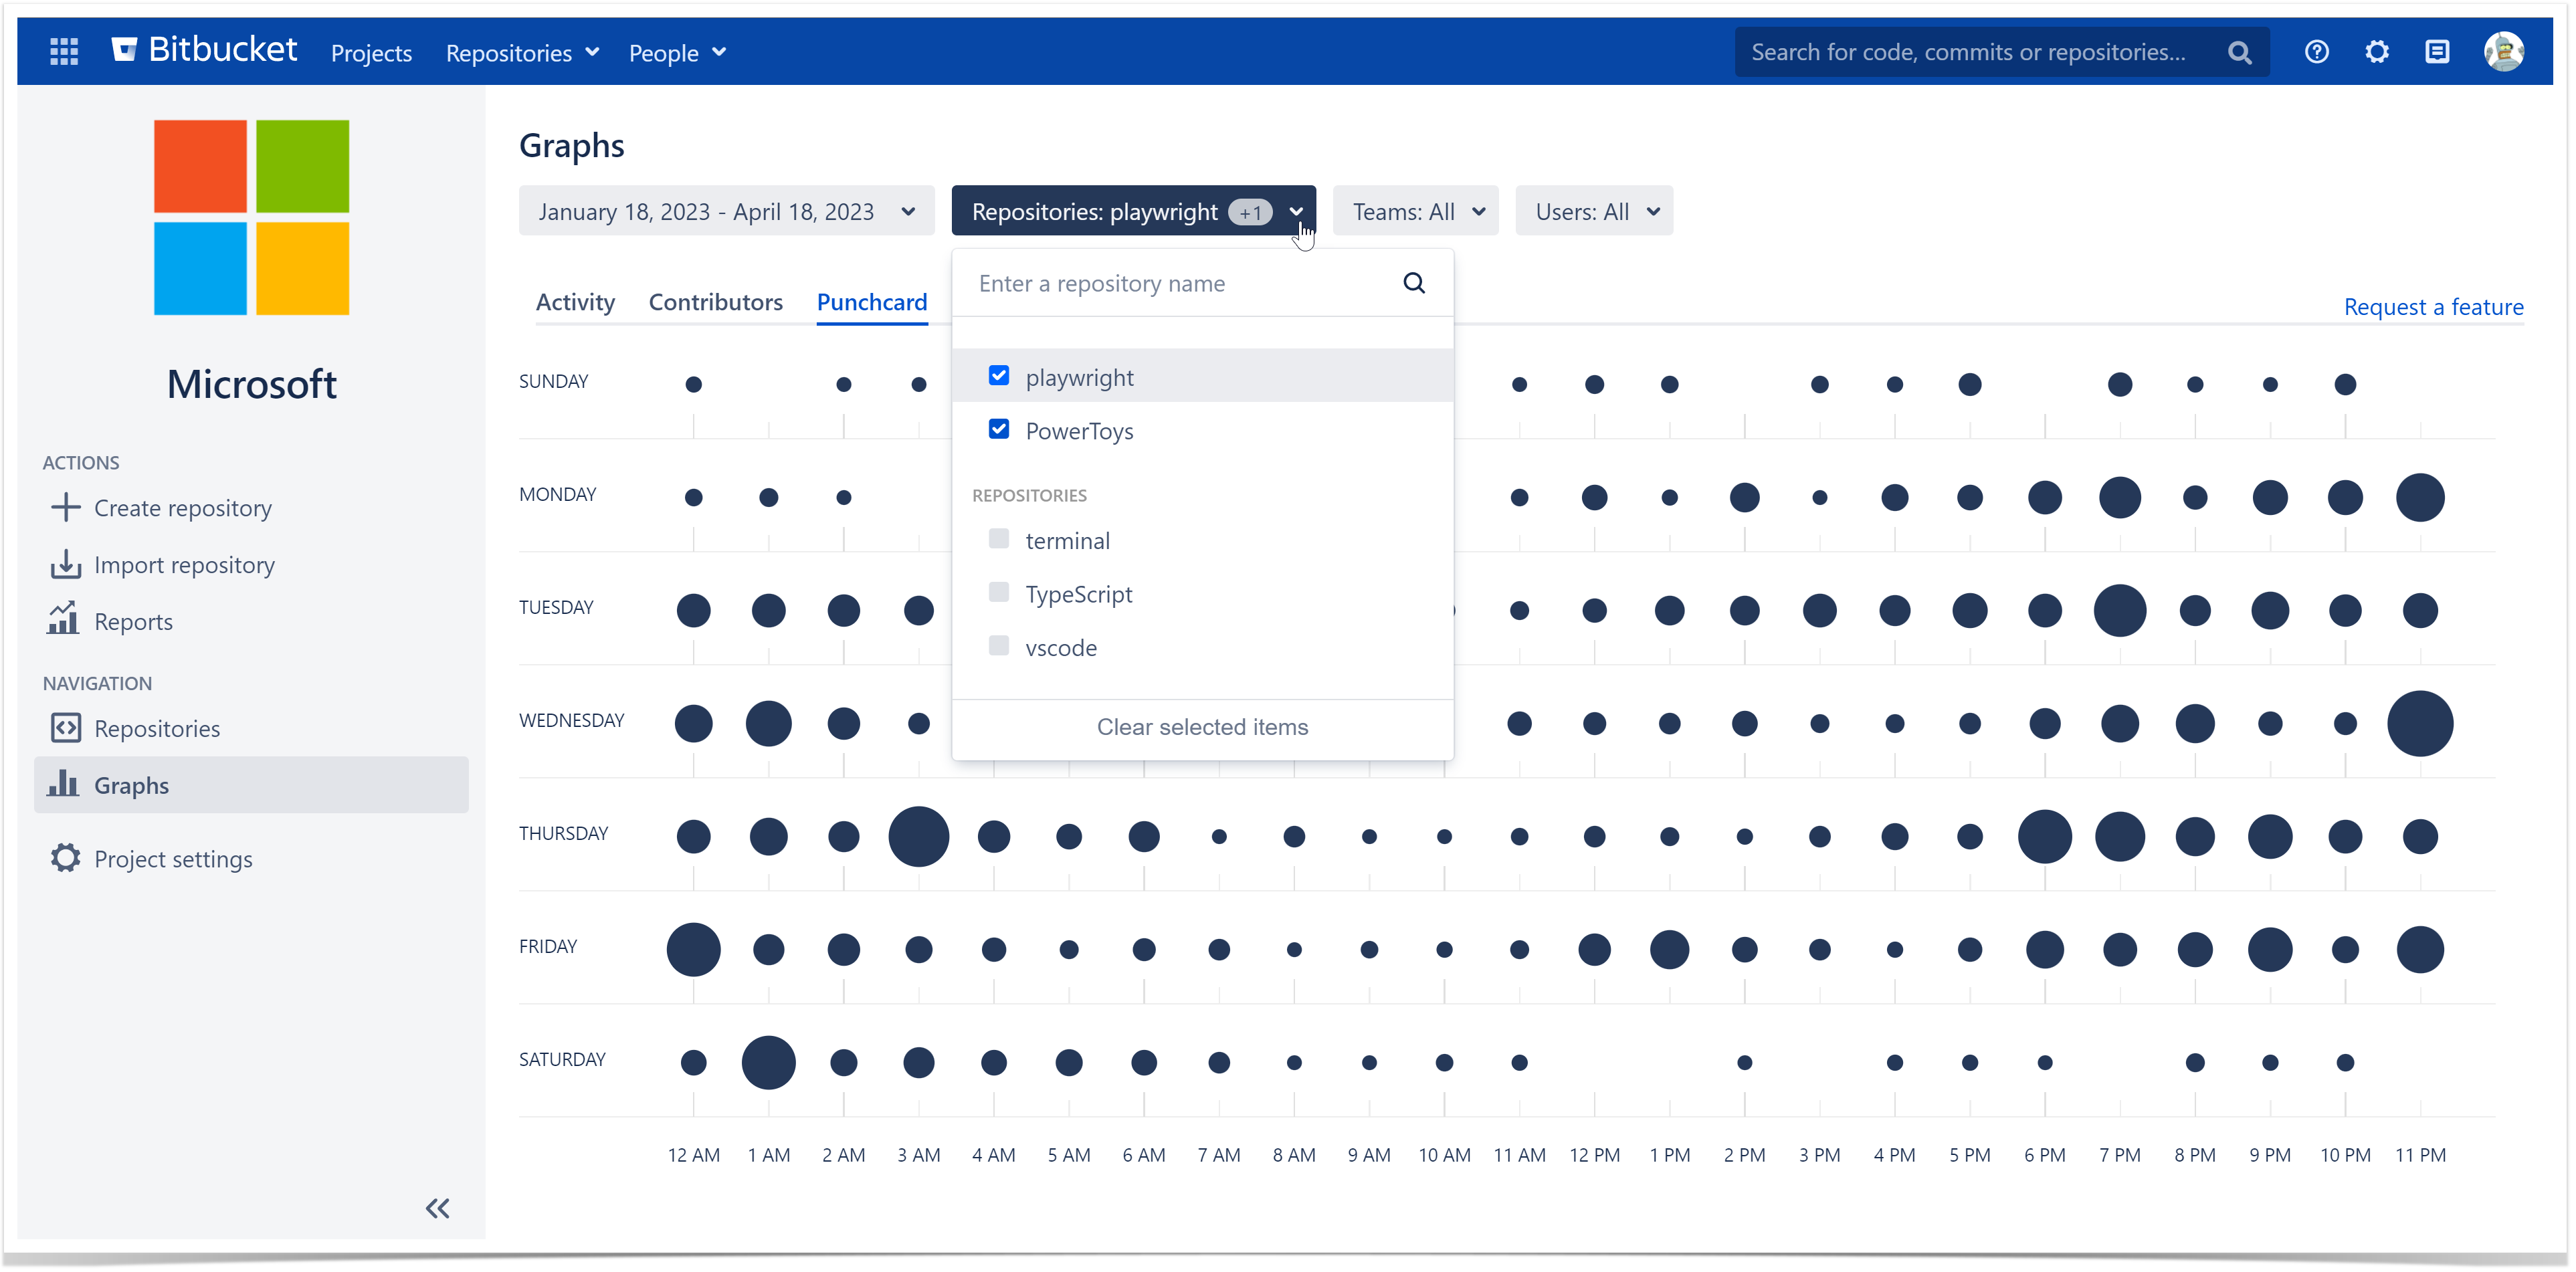
While browsing the Punchcard graph of a certain project, you can select multiple repositories in the Repositories checkbox menu to monitor and analyze two or more repos at the same time without having to click through each one.
Analyze the distribution of commits by time
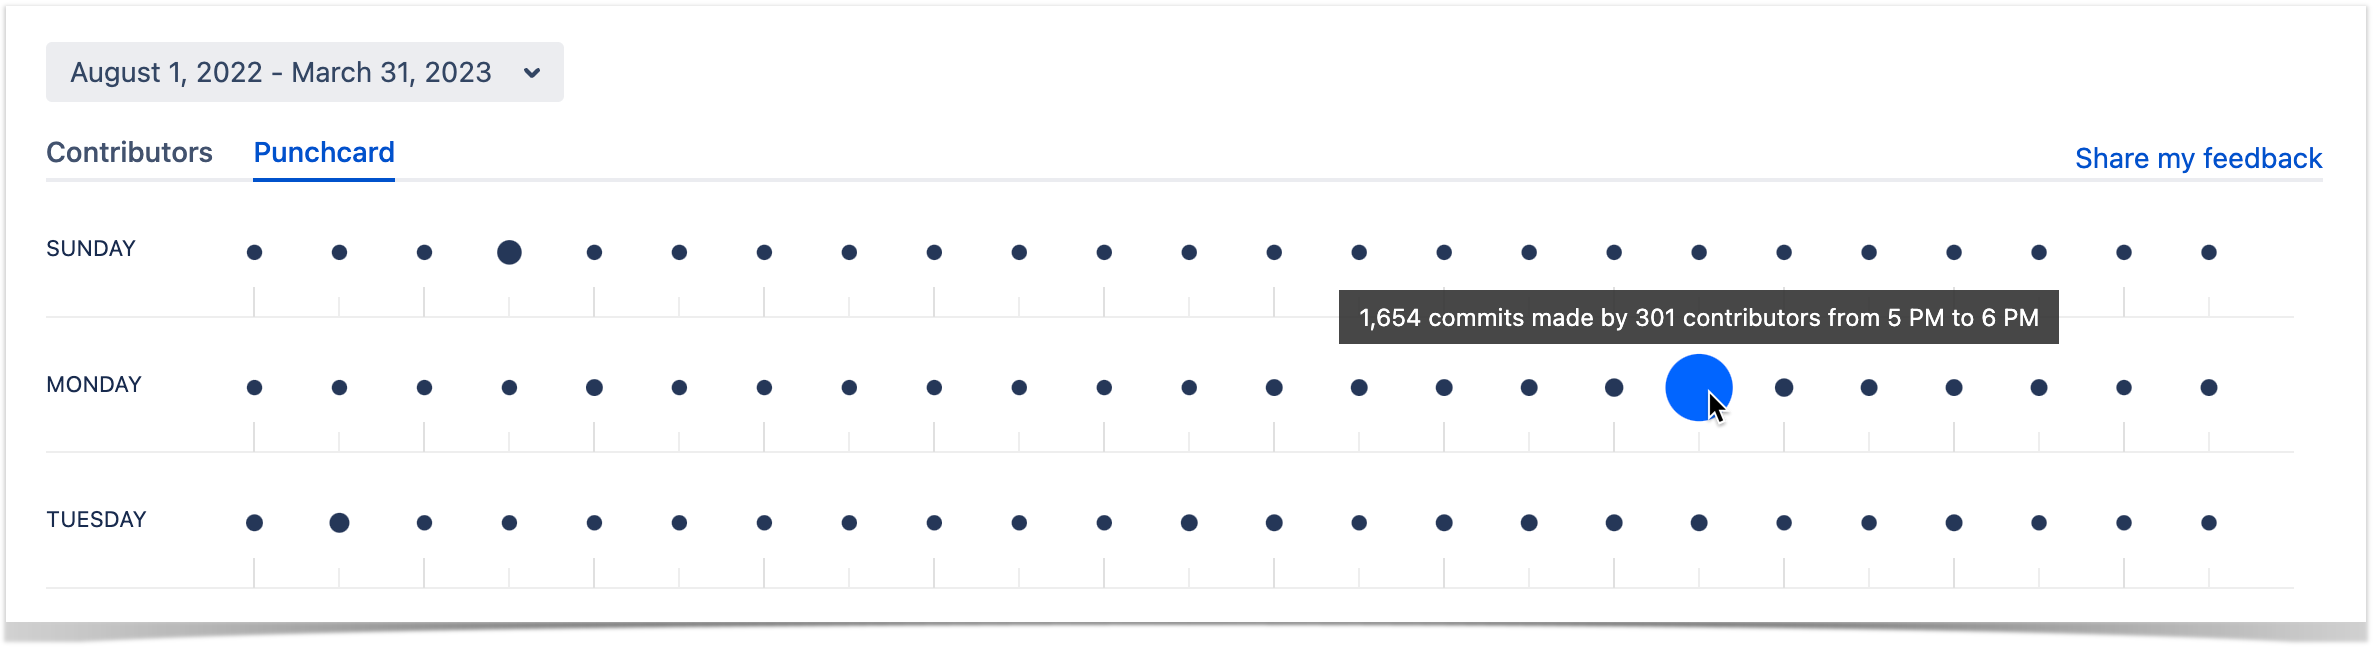
The Punchcard graph visualizes the distribution of commits by day of the week and hour.
Hovering your mouse over a circle will display the exact number of commits made during that hour on that day.
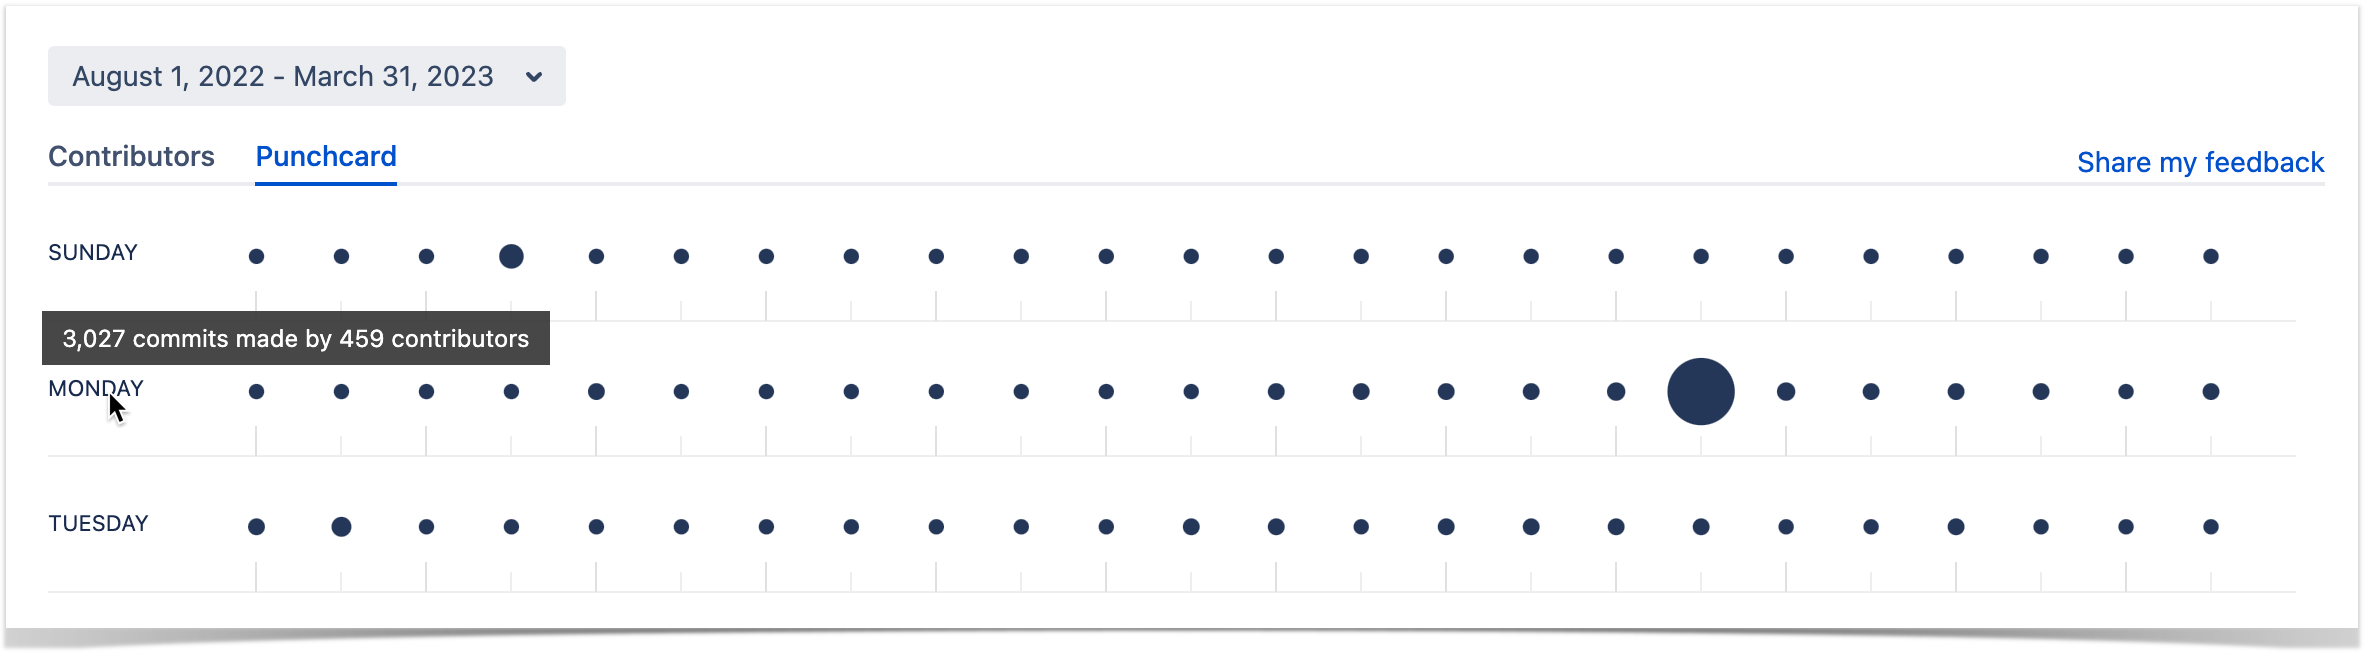
If you hover over a day of the week, you'll see how many commits were made on that day.
Filtering the displayed data
You can filter all the information displayed in the Punchcard graph by certain contributors and by period.
Track the activity of a particular user or a team
By default, the graph displays commits of all contributors of a project or repository.
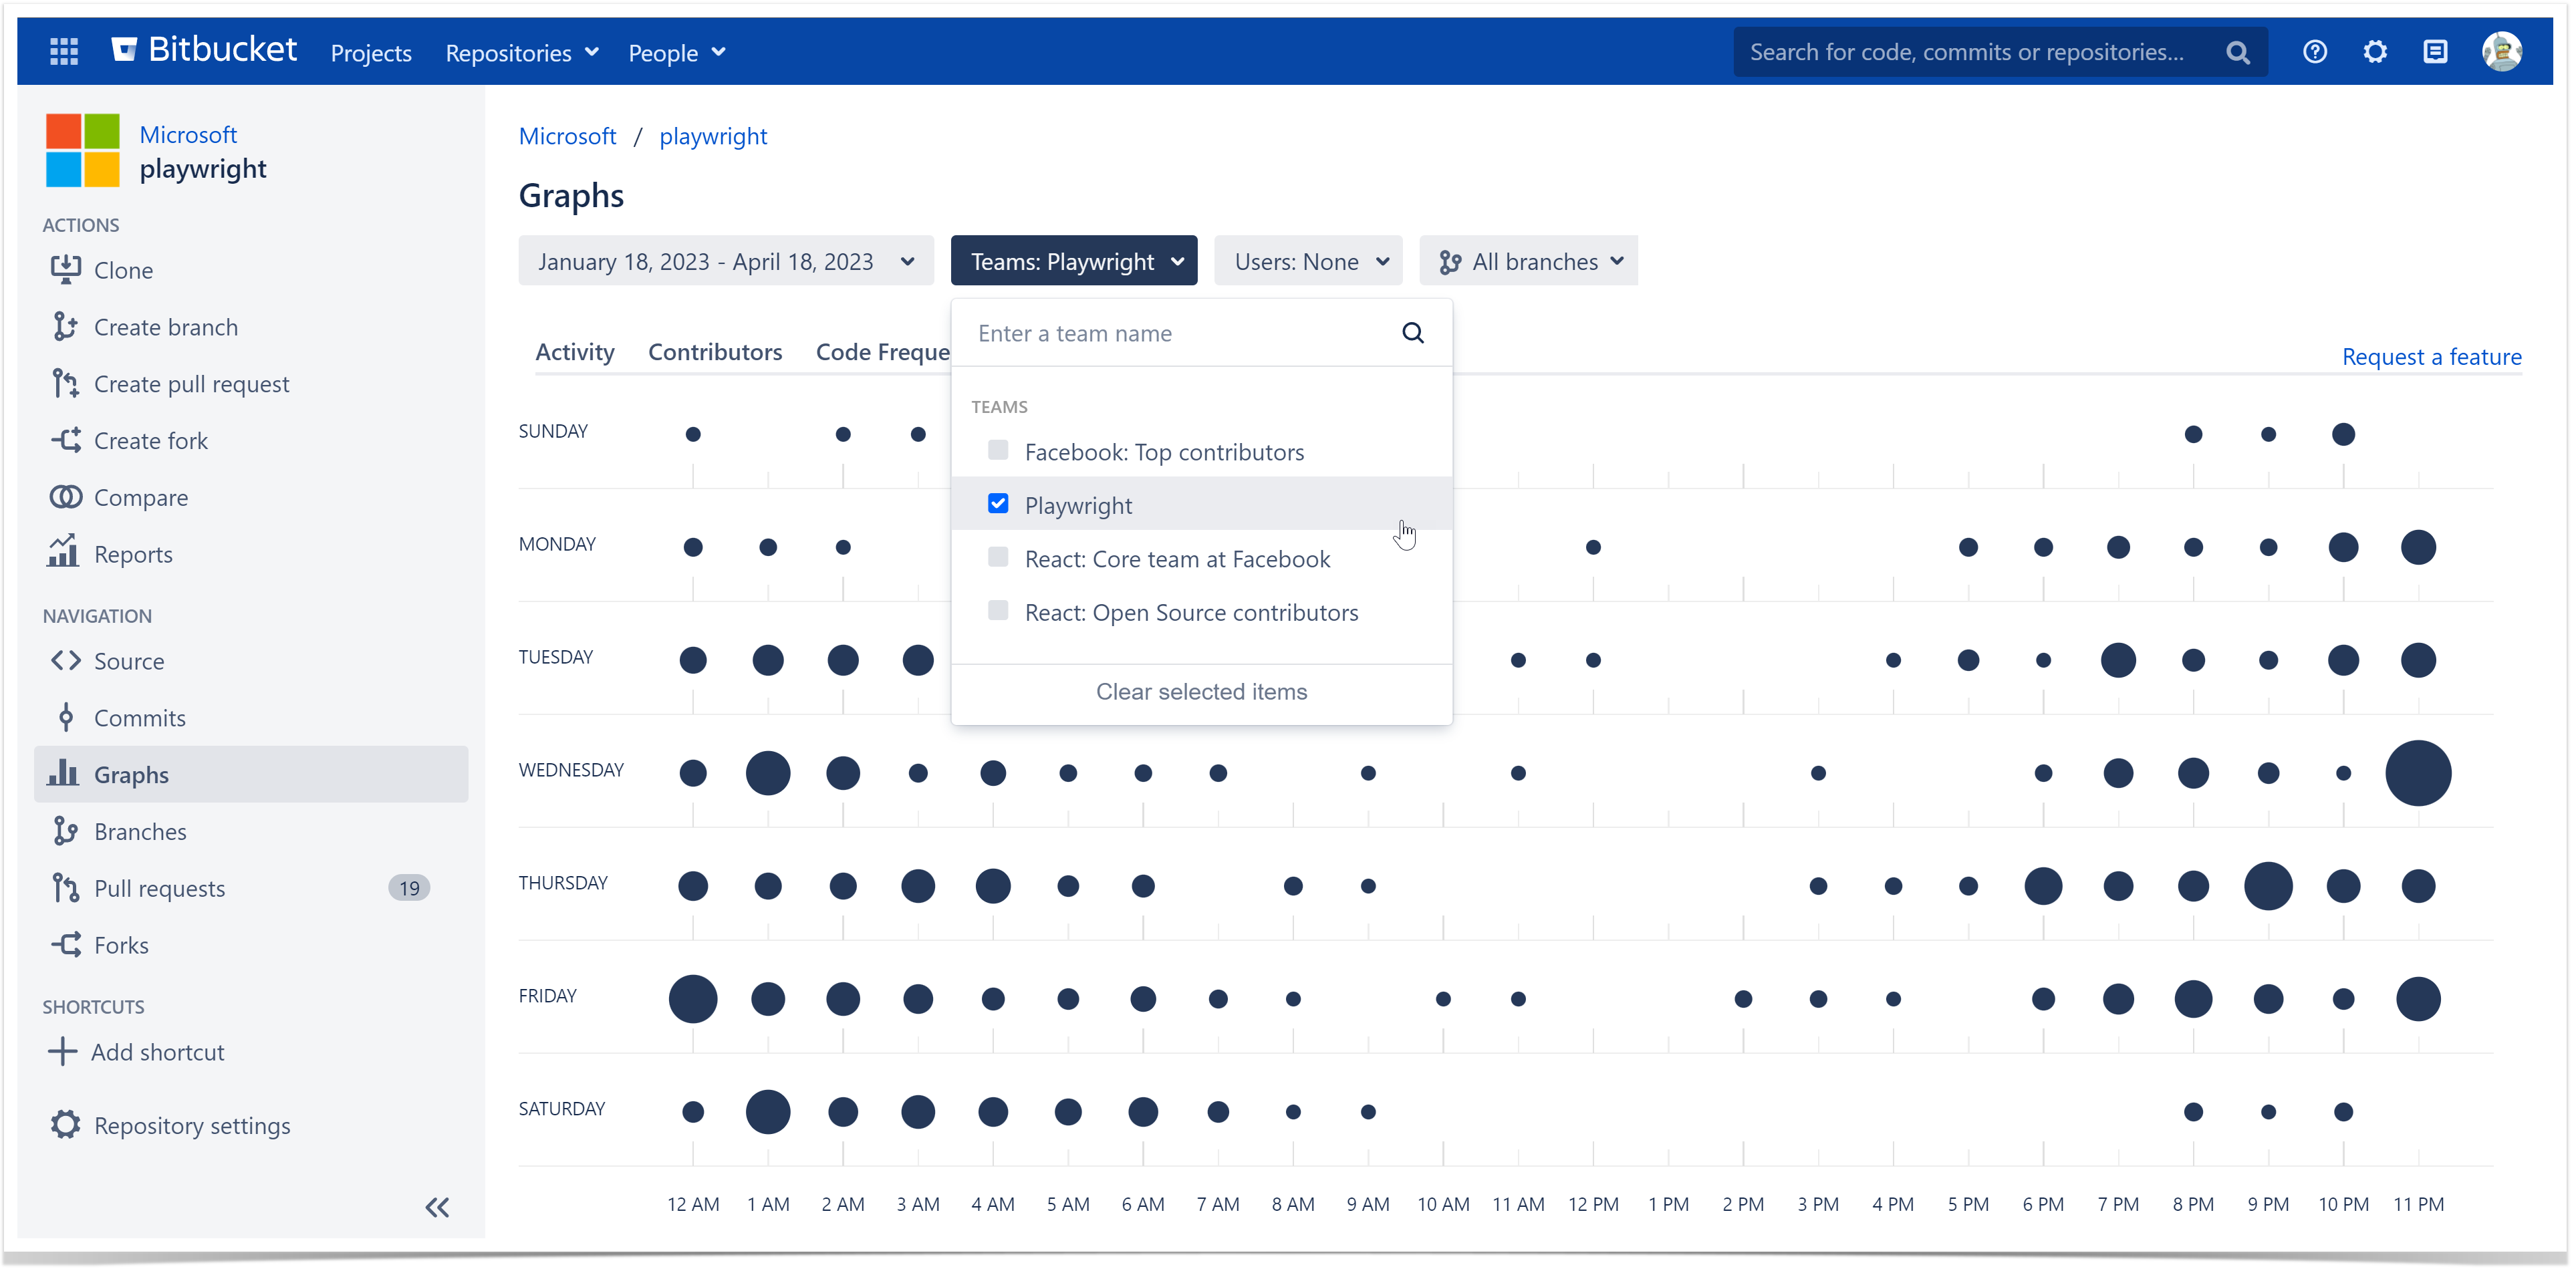
You can use the Teams and Users dropdown menus, separately and combined, to filter the results shown on the page.
Choose a team in the Teams tab to see team statistics. Read more about teams here.
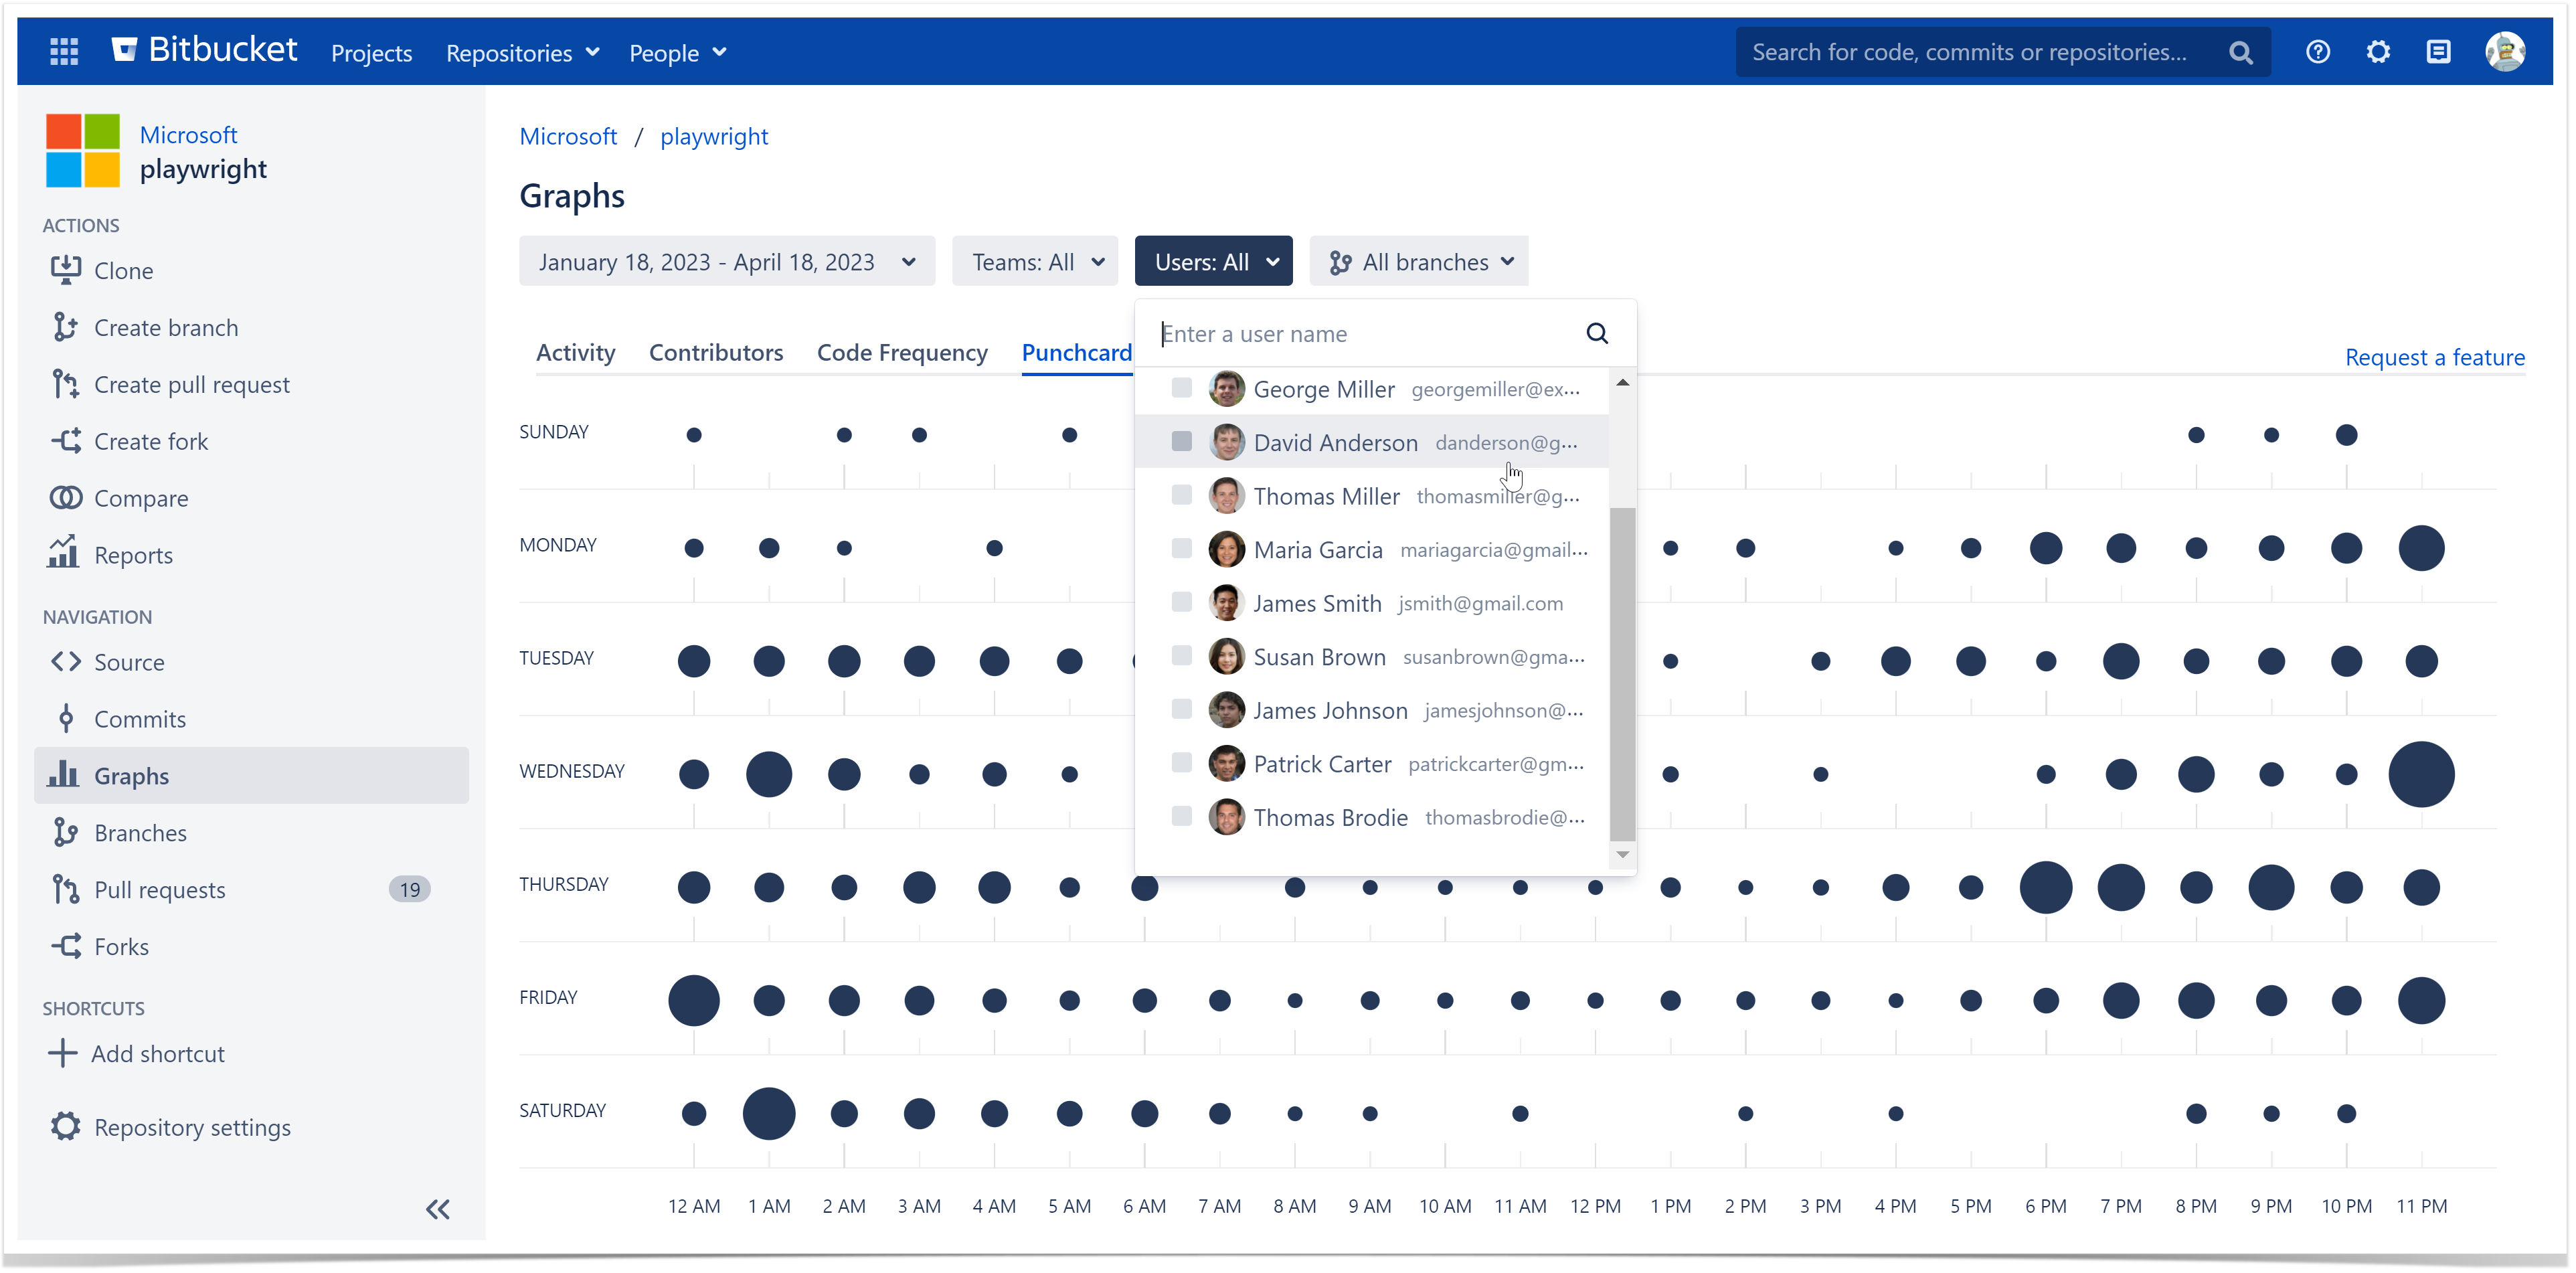
Choose a user in the Users tab to see personal statistics. The users are selected from the list of Bitbucket users who have read access to the current repository or project.
Track the activity over a certain period
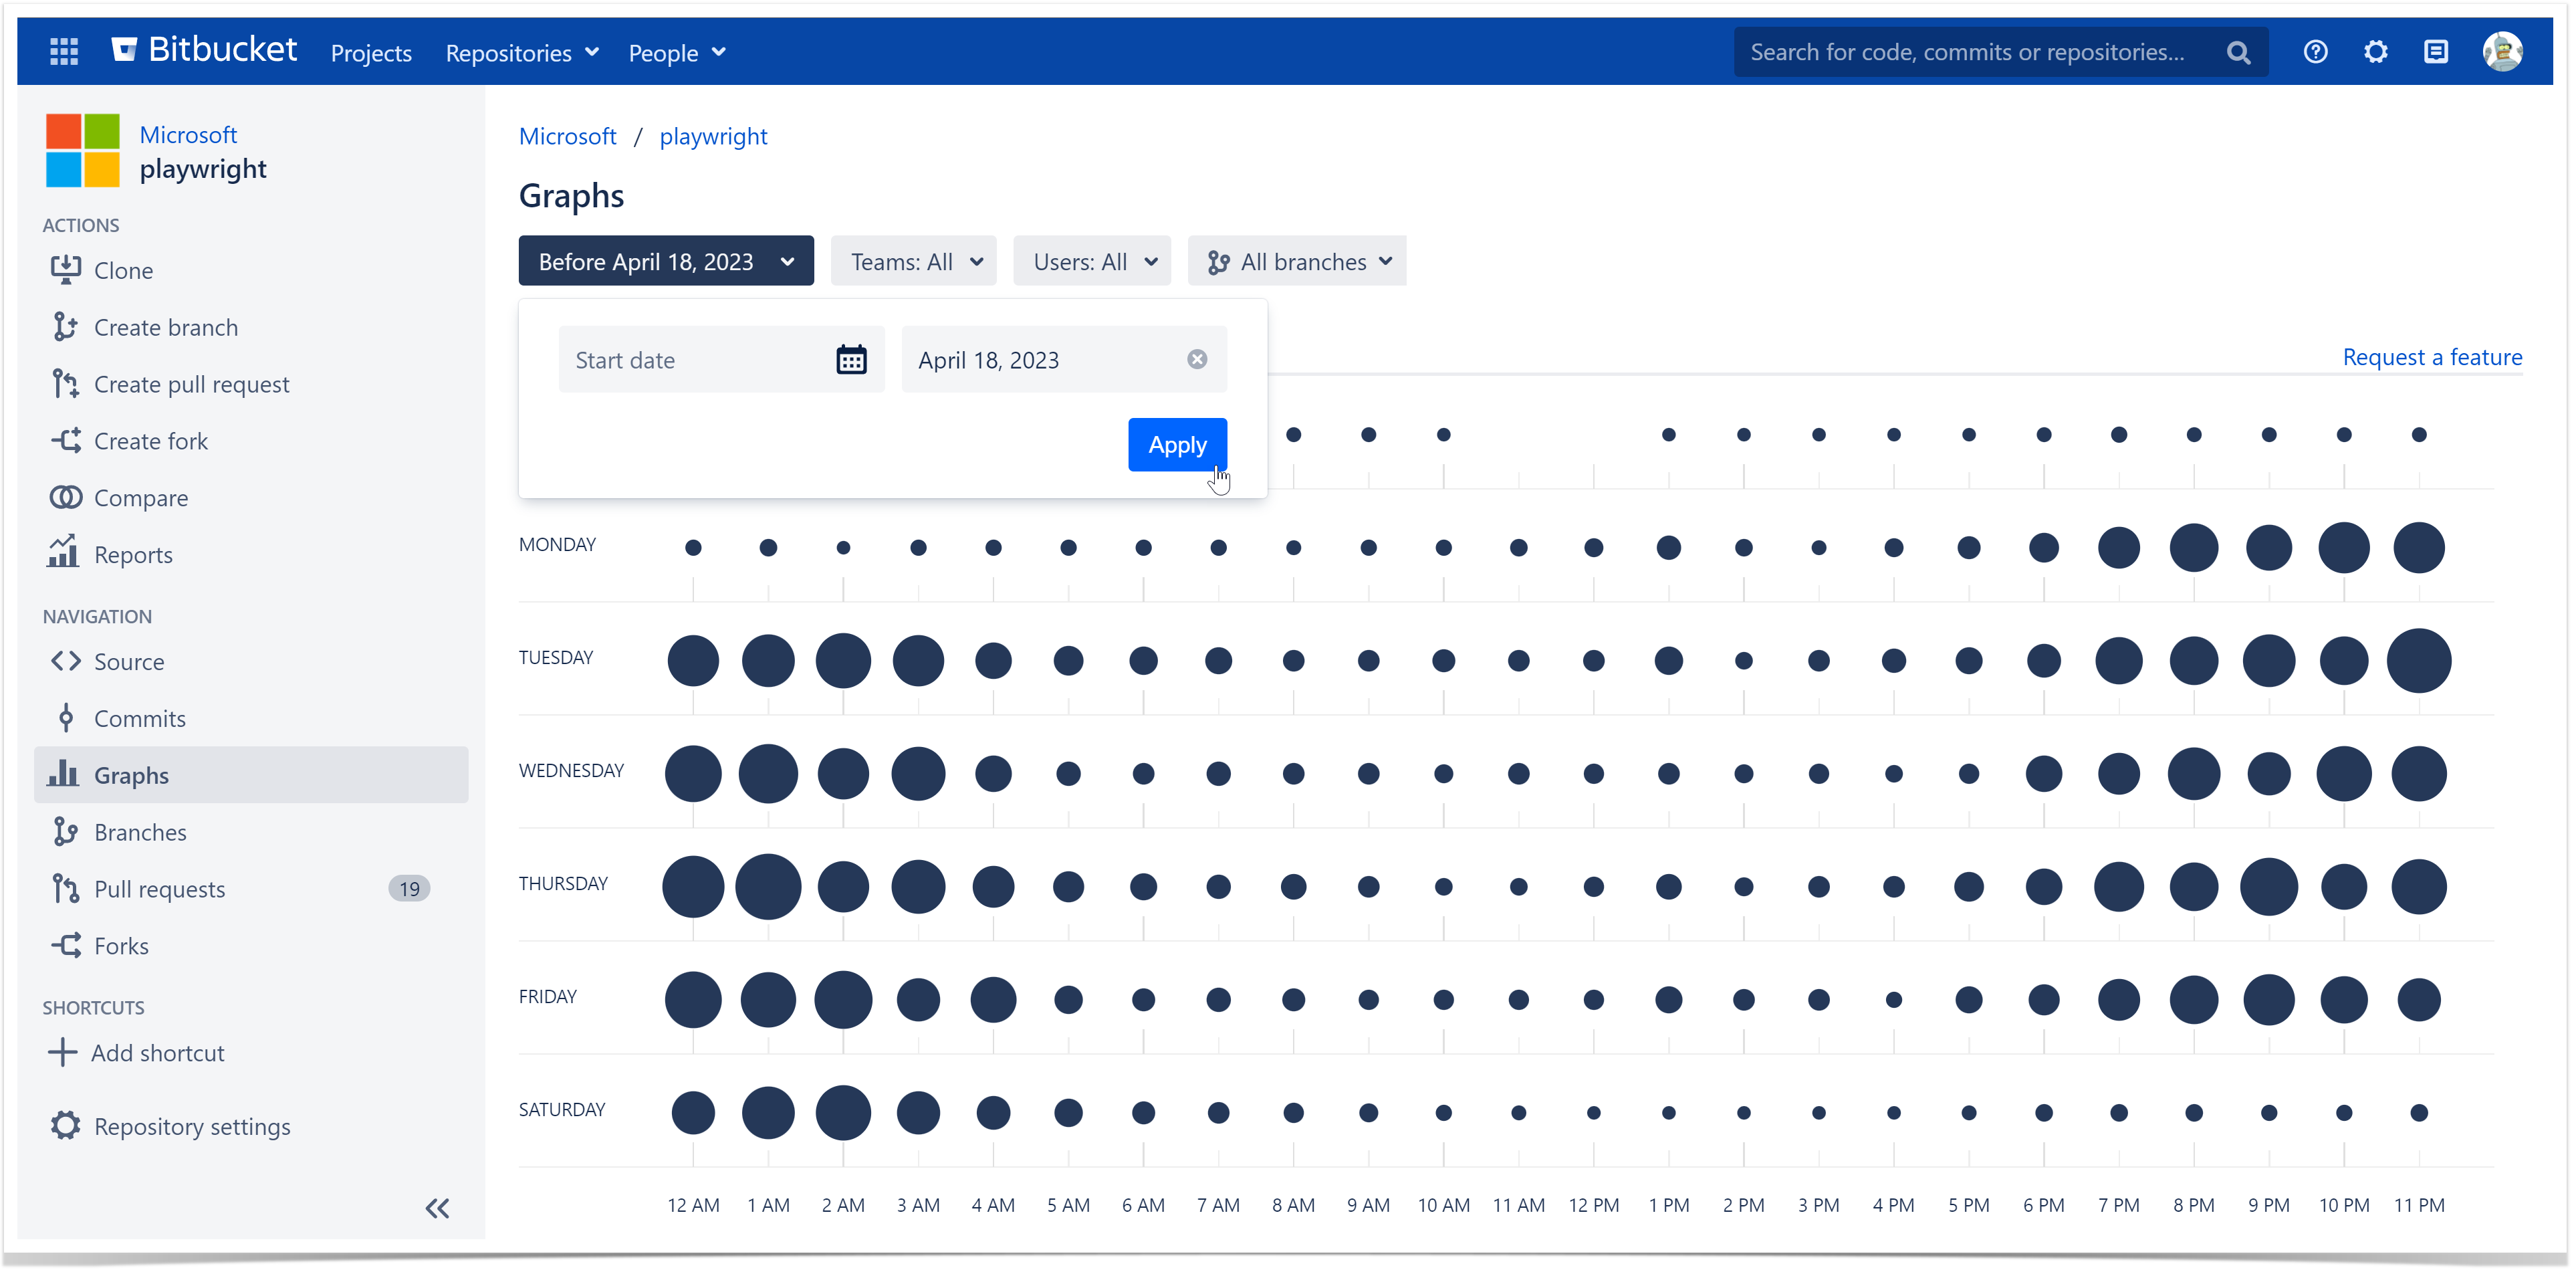
To select a time period for your Punchcard, navigate to the Time Span menu and select one of the options or click Custom to set a custom time span.
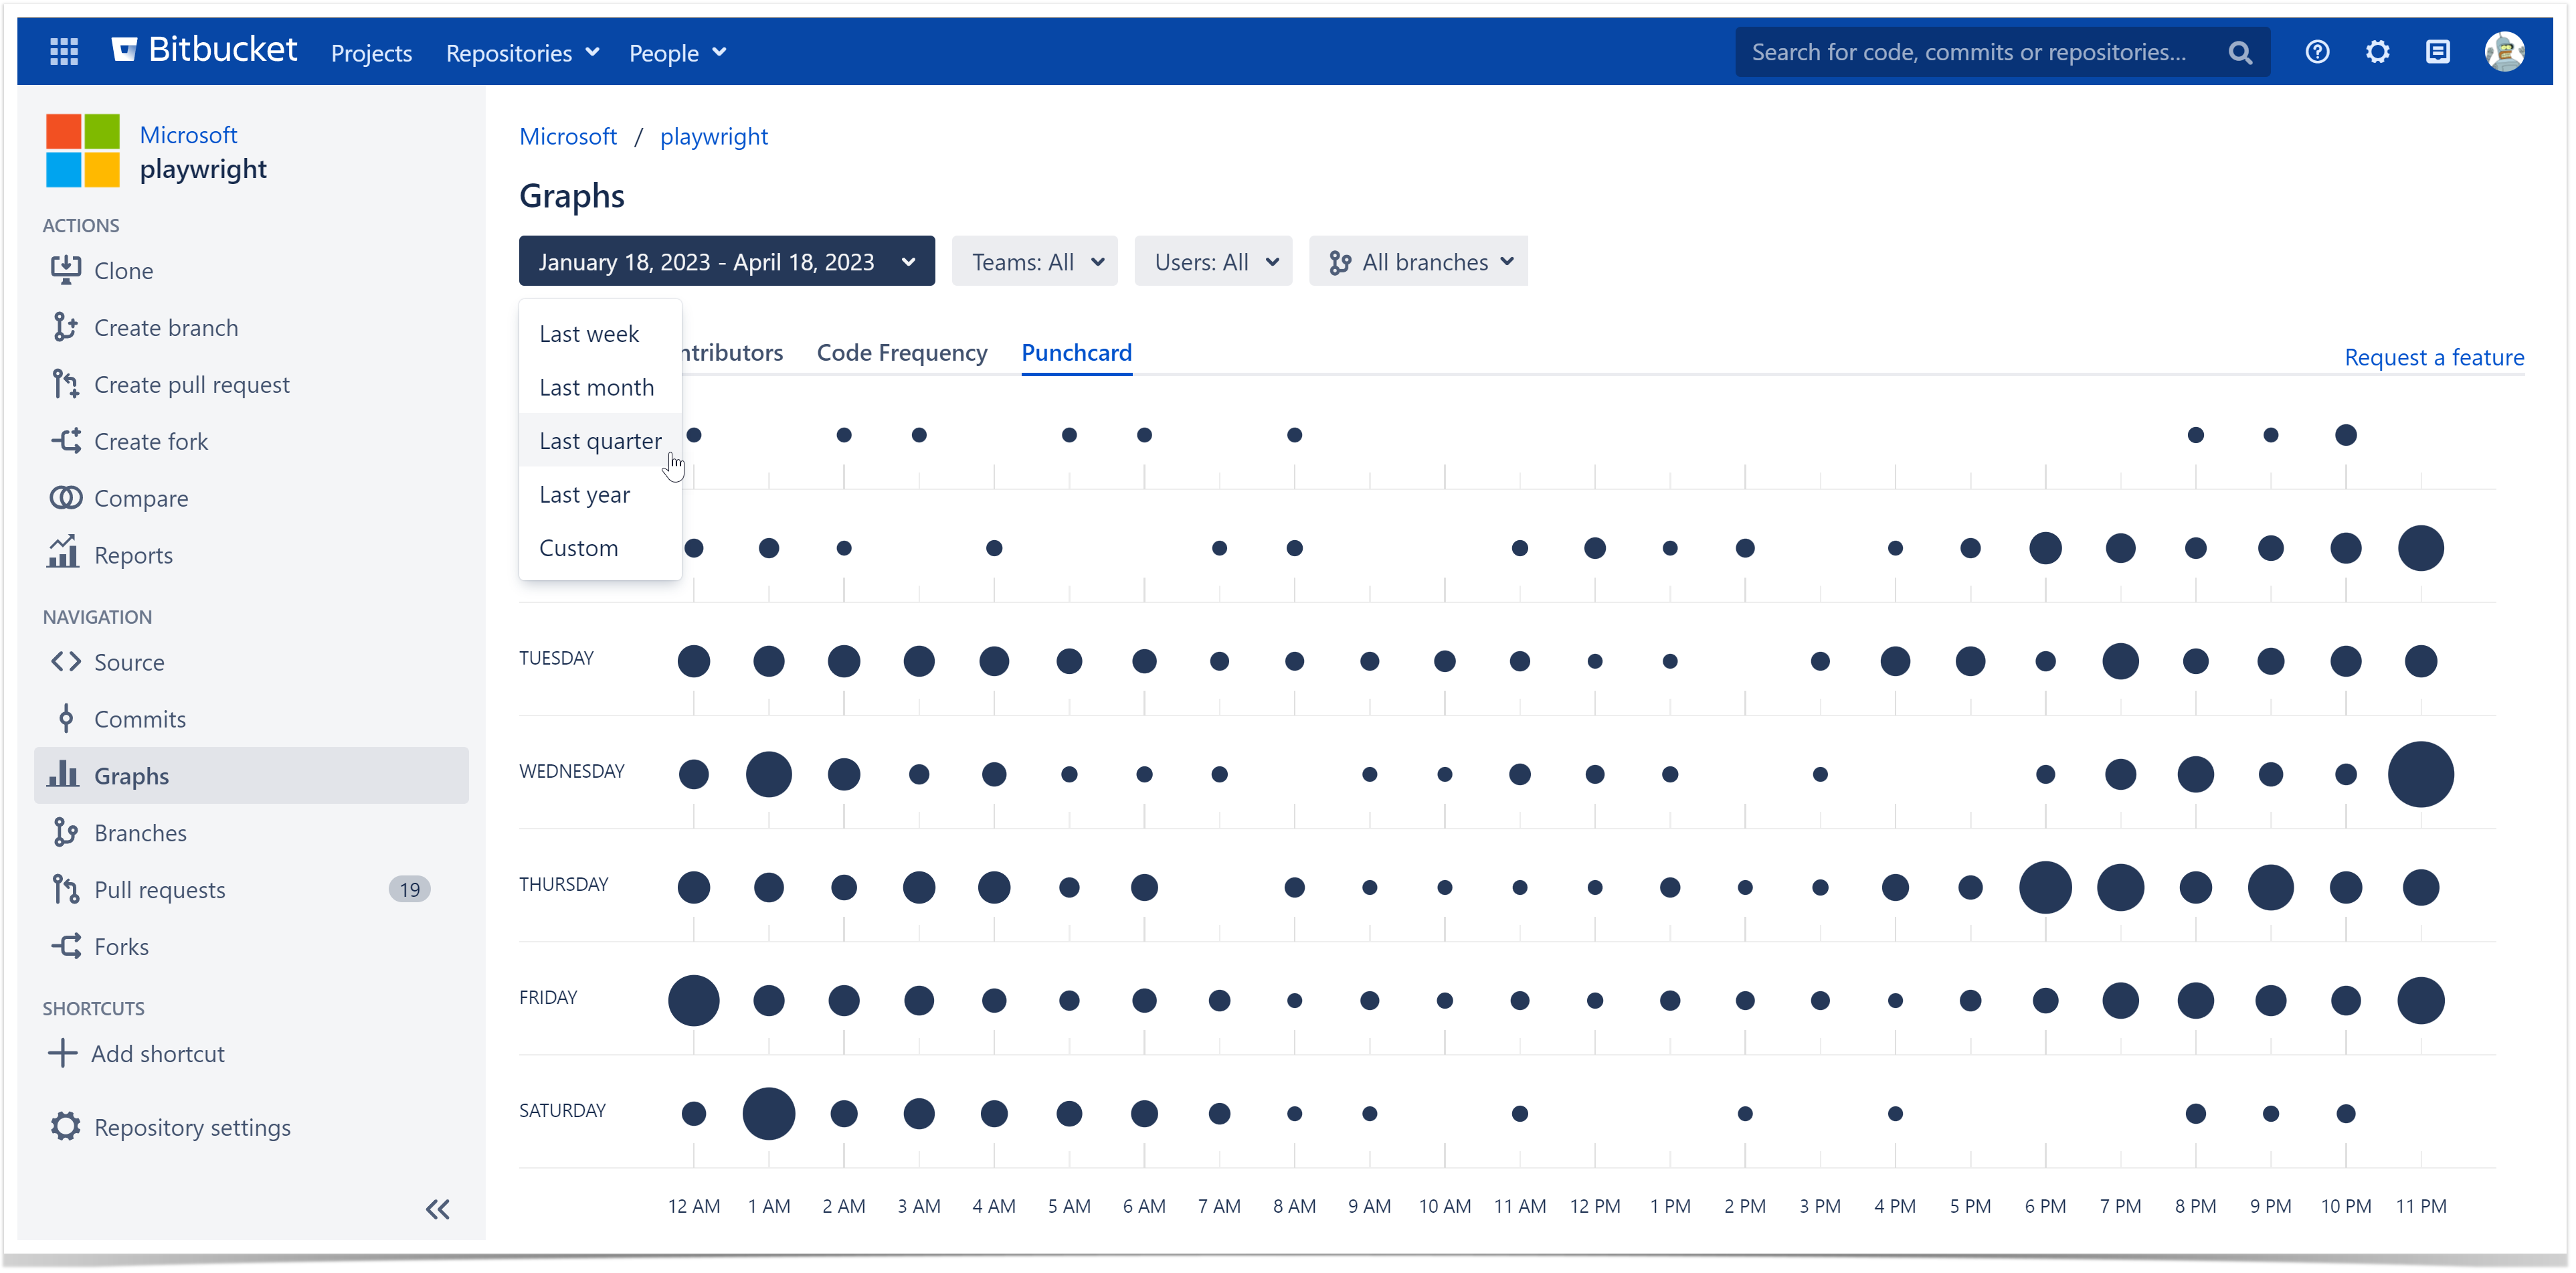
Hint: If you want to see the data from the beginning of a repository or a project, use the Custom period and leave the Start date blank.