Commit Activity Report allows you to see the number of commits made over the last year grouped by week and detailed daily commit statistics of the selected week.
Below on the page, you'll find:
- instructions on how to view the Commit Activity Report for projects and repositories
- how to configure the report
- how to read the report
For easier navigation, use the Table of Contents at the top-right of the page.
How to view the Commit Activity Report
The Commit Activity Report is available both on the project and repository levels. To view Commit Activity Report:
- Navigate to the project or repository of your choice.
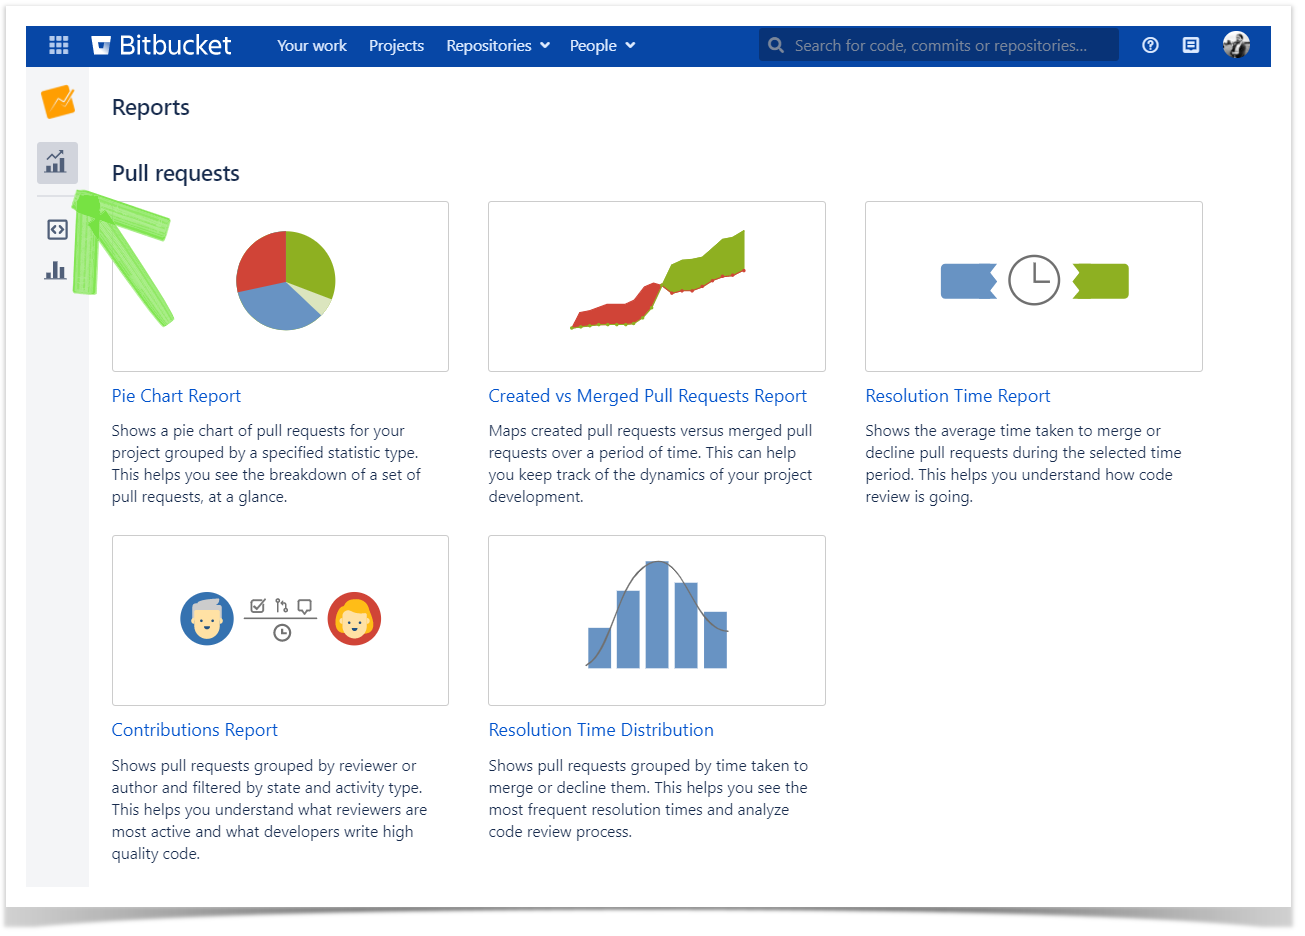
- Click on the Reports icon in the left-hand sidebar.
- Choose Commit Activity Report in the Commits section.
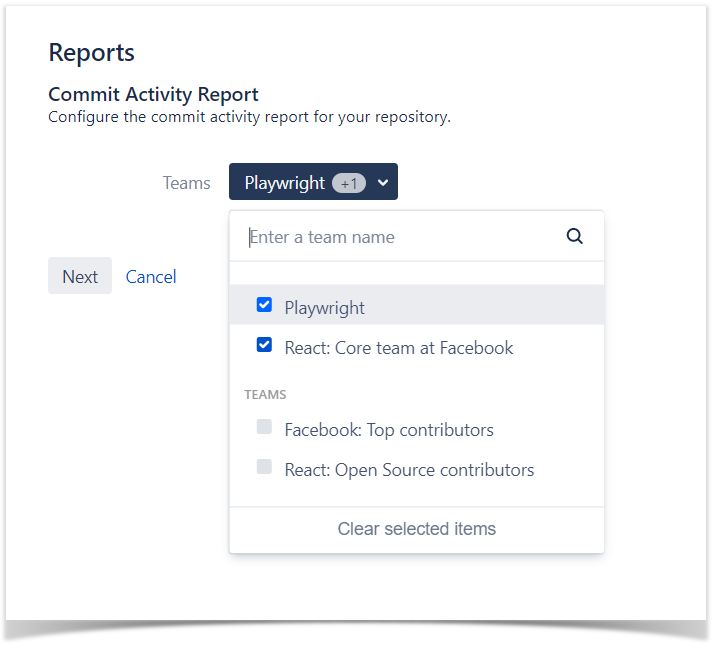
You can use the Teams menu to filter the results shown on the page to see team statistics. Read more about teams here.
How to read Commit Activity Report
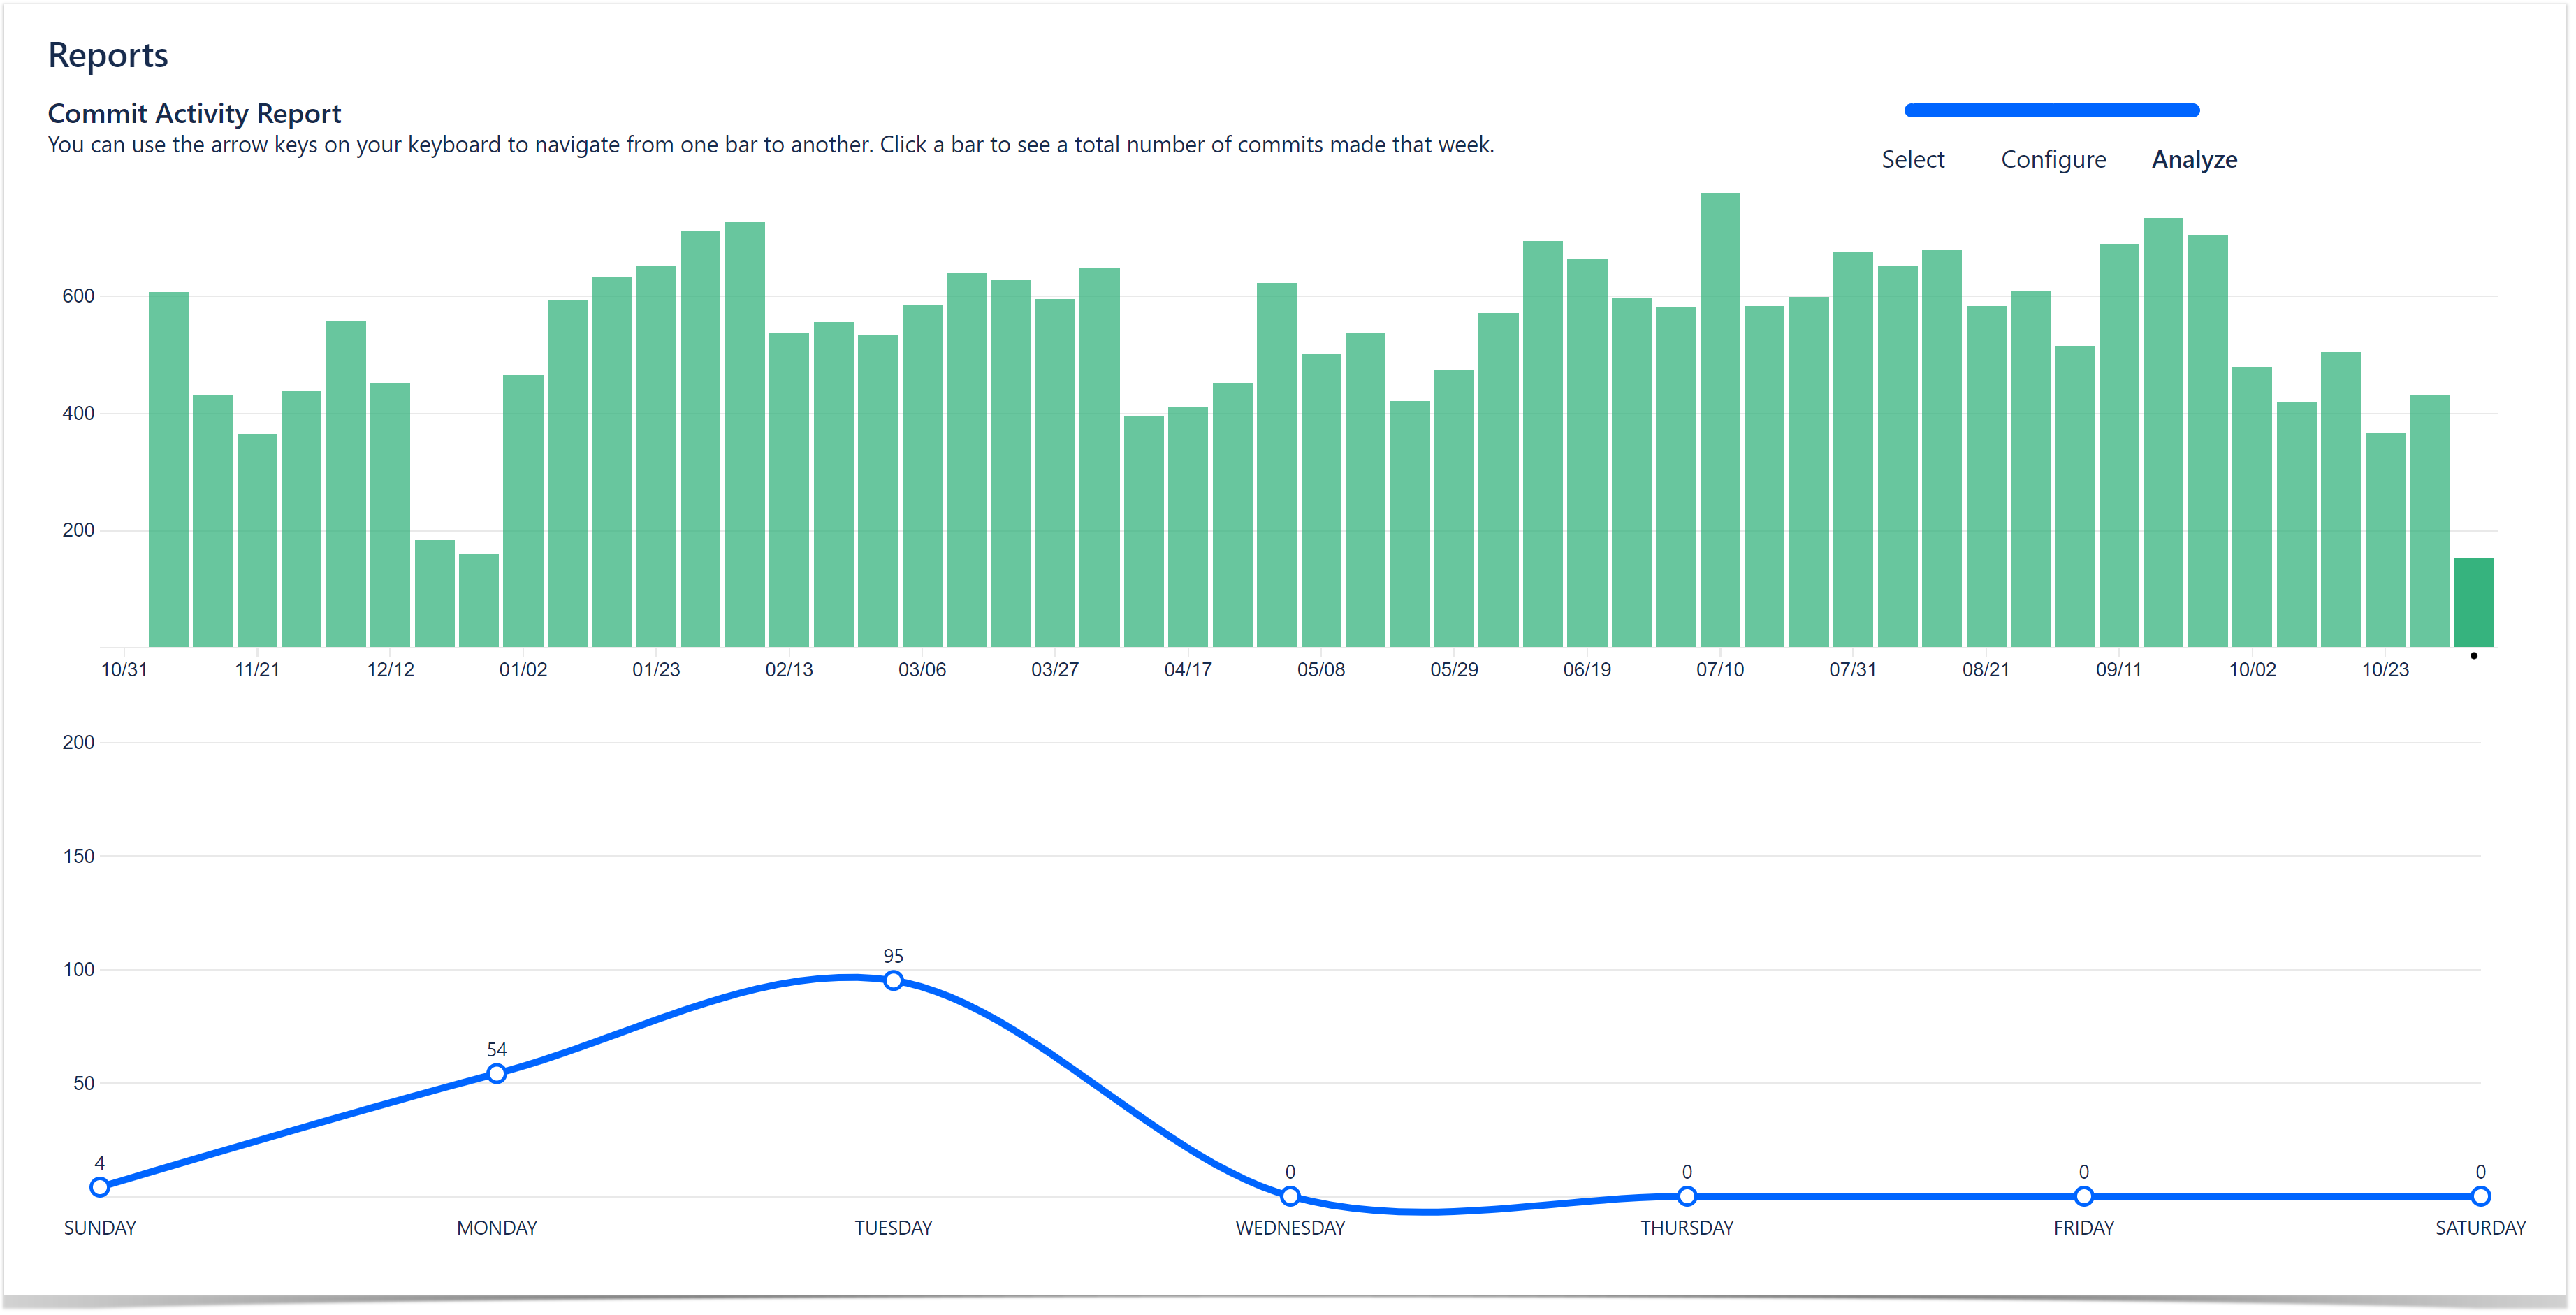
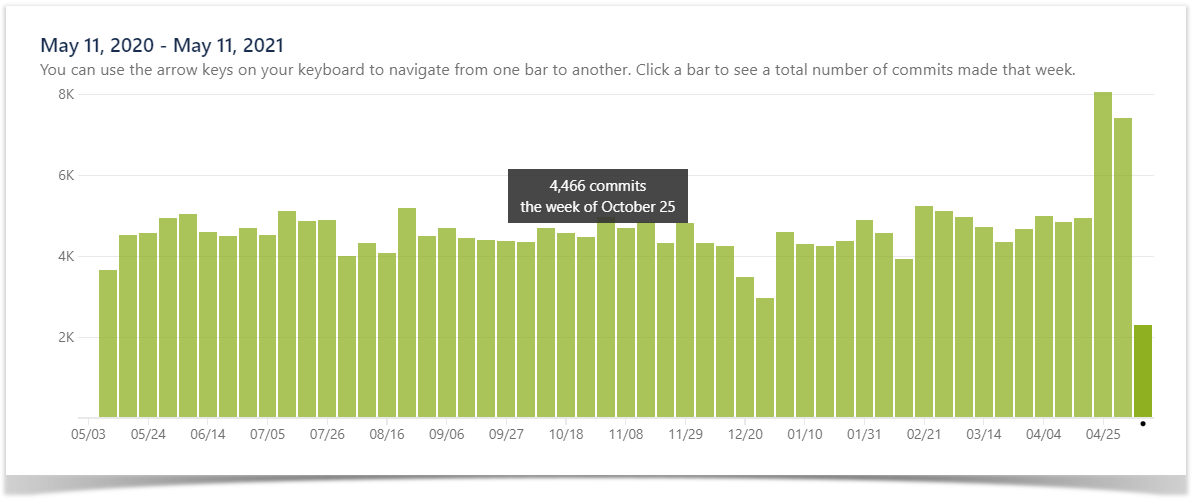
In the upper part, you will see the interactive Commits bar chart. It displays all commits made over the last year grouped by week. Each bar represents one week.
Click on a bar to see the total number of commits made that week. You can use arrow keys on your keyboard to navigate from one bar to another. When you click on a bar or switch from one bar to another you see changes in the scatter chart below.
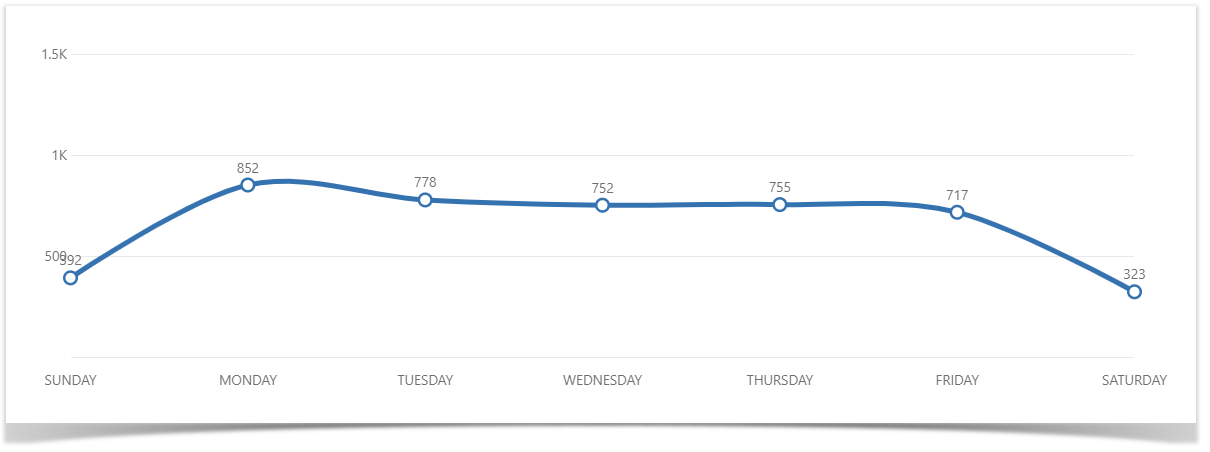
In the lower part, you will see the interactive Commits scatter chart. It displays detailed daily commit statistics of the week selected in the upper Commits bar chart. Each chart marker represents one day.