In the Code Frequency tab of the Graphs page, you can get an overview of the project dynamics in terms of lines of code.
Below on the page, you'll find:
- instructions on how to view the Code Frequency graph for repositories
- a detailed description of elements of the graph
- an overview of the filtering capabilities
For easier navigation, use the Table of Contents at the top-right of the page.
How to view the Code Frequency graph
The Code Frequency graph is available only on the repository level. To view the Code Frequency graph:
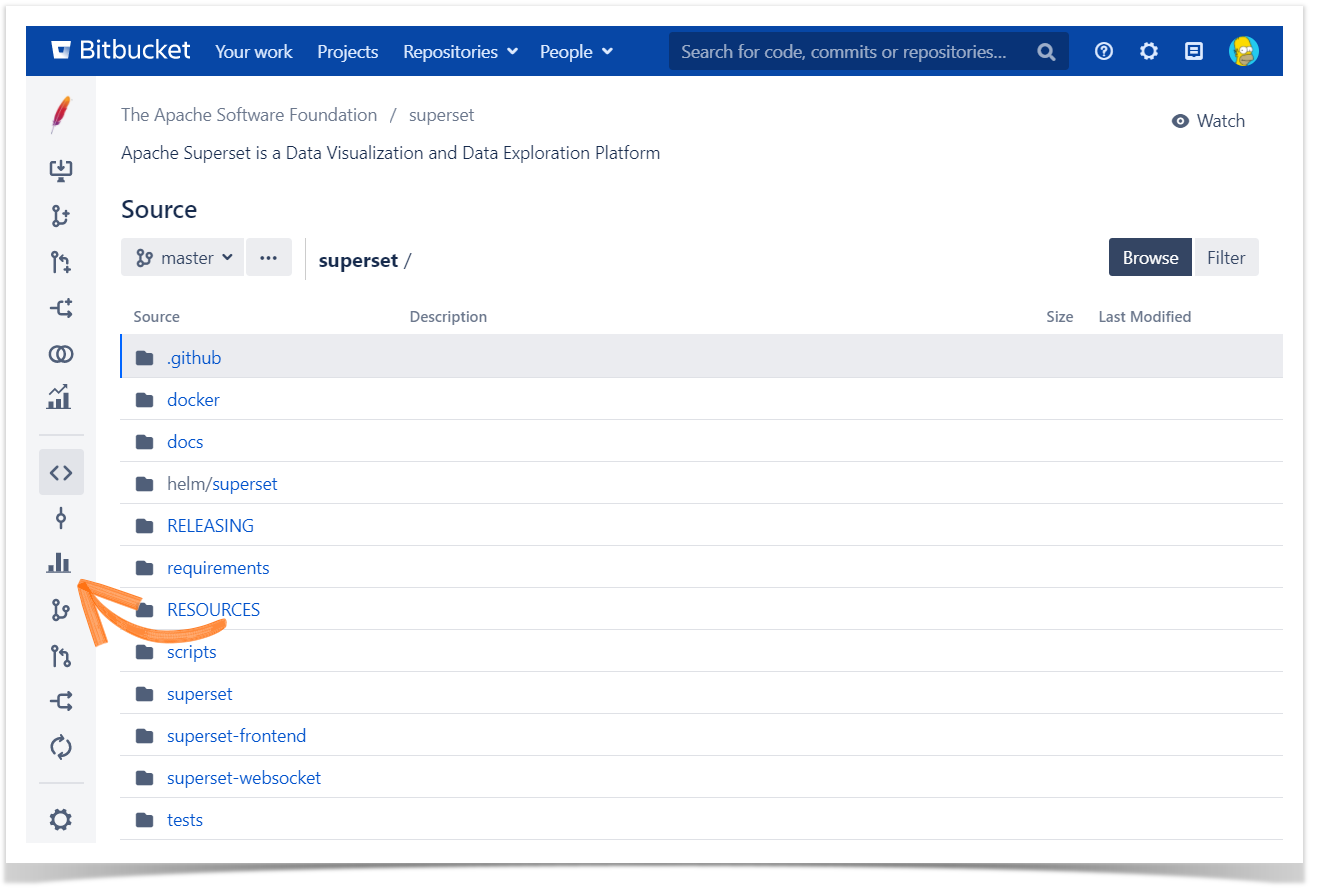
- Navigate to the repository of your choice.
- Click on the Graphs icon in the left-hand sidebar.
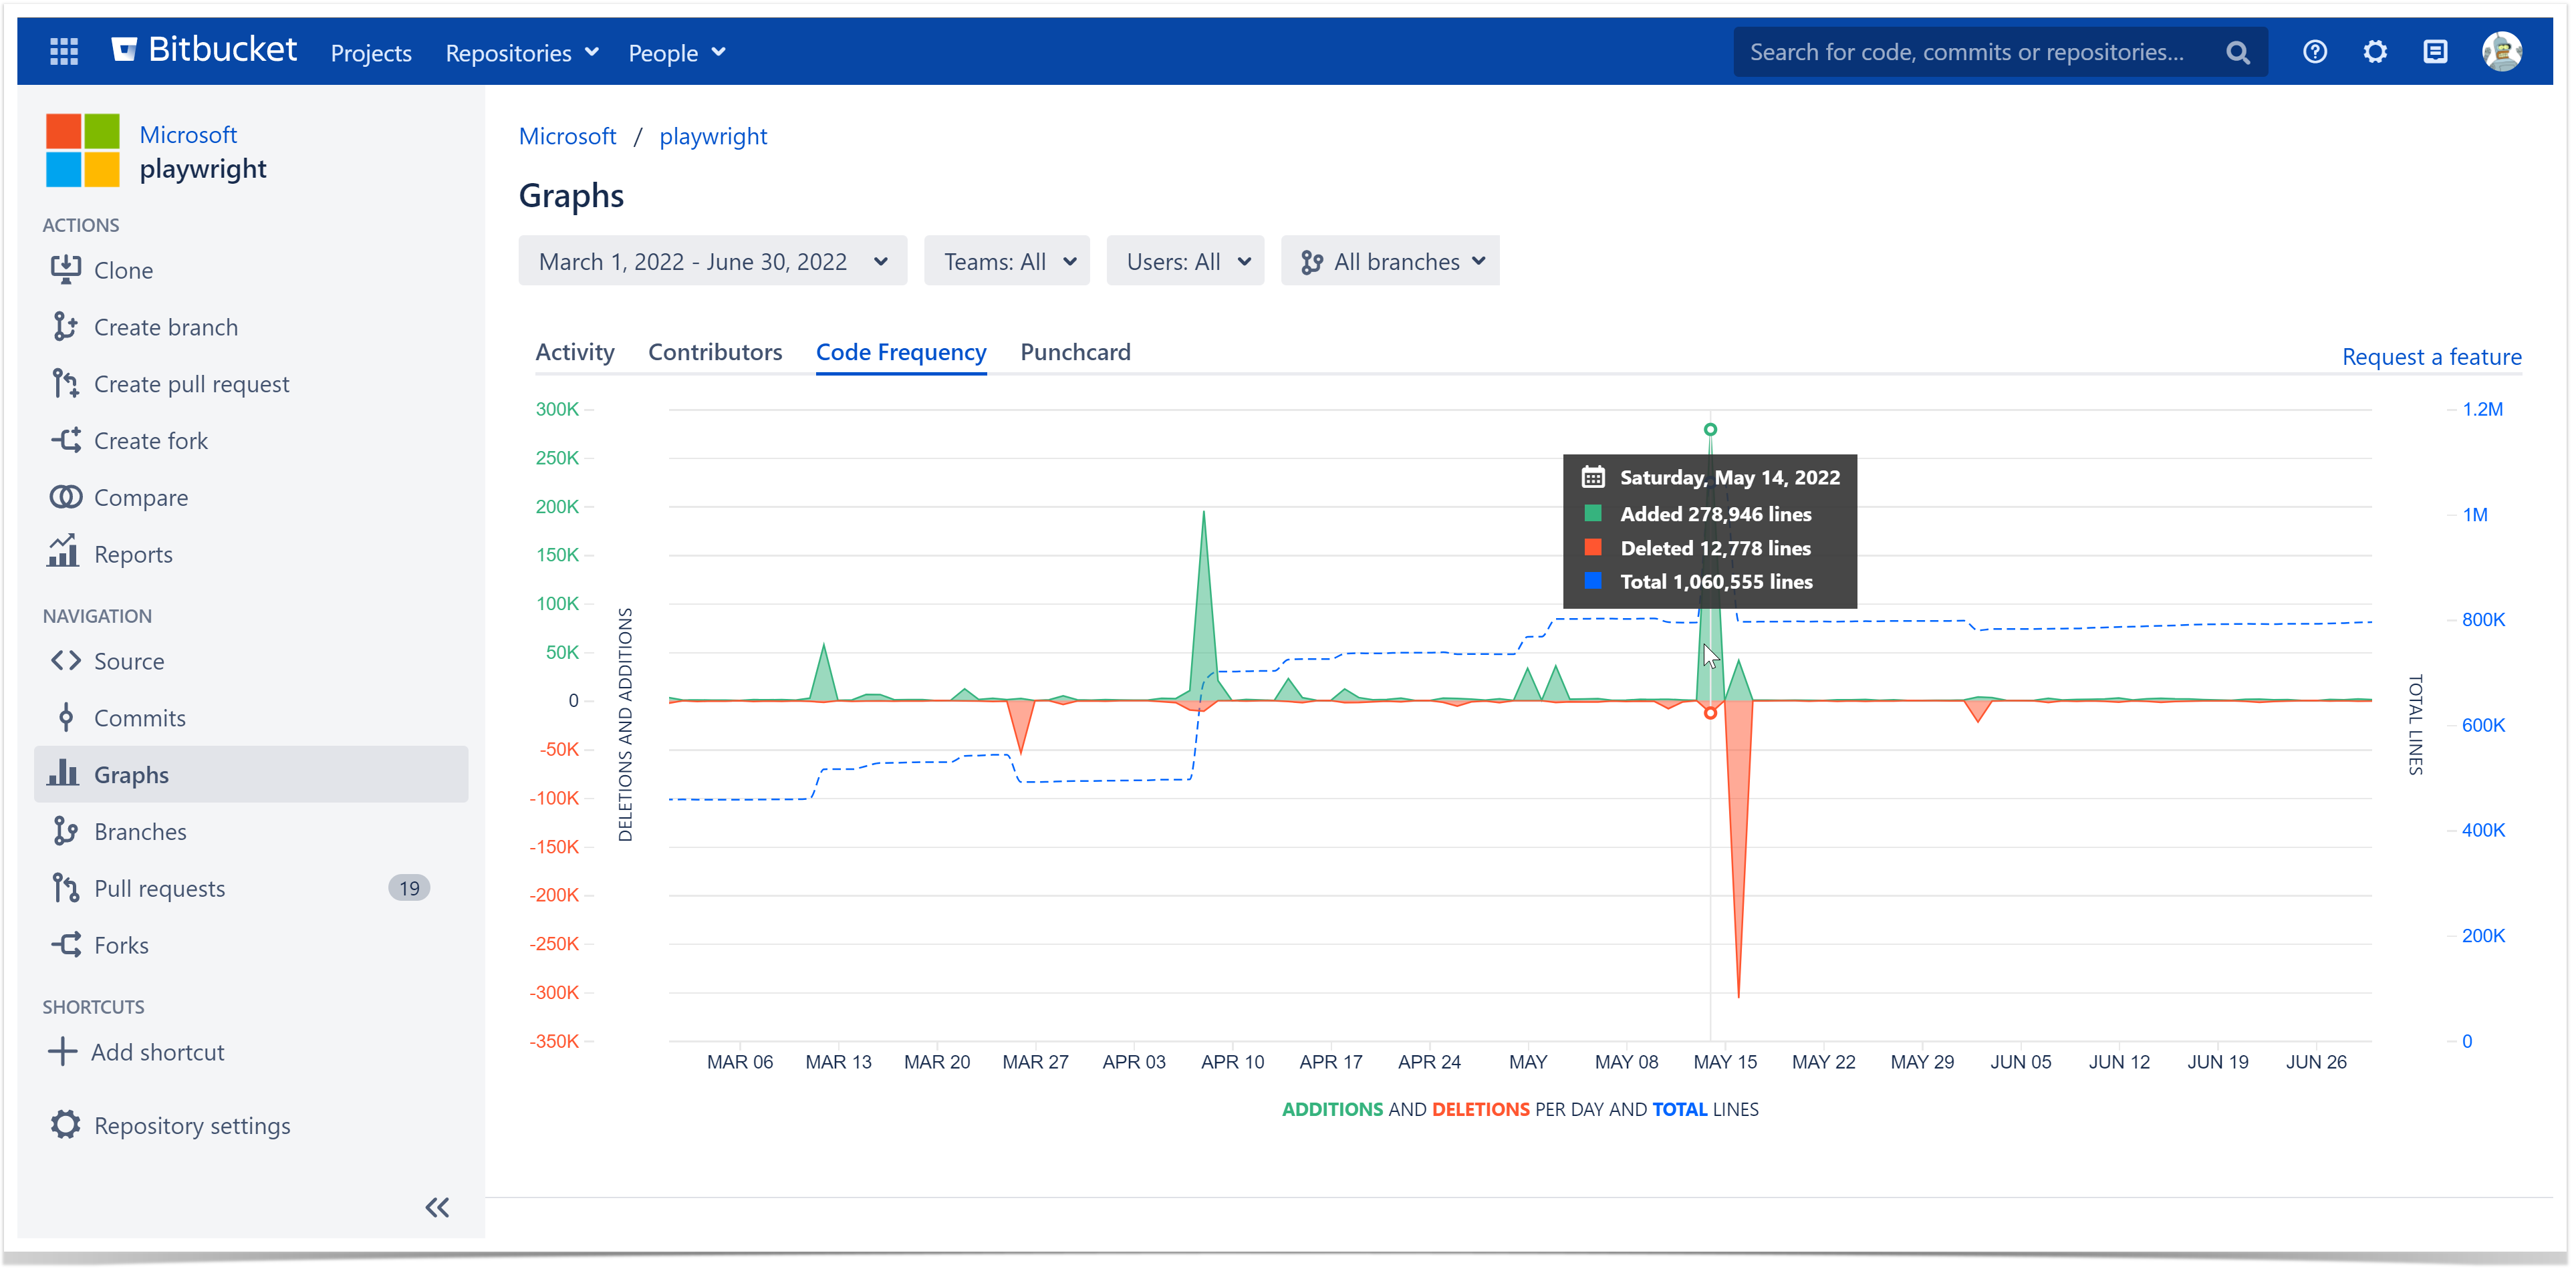
- Choose the Code Frequency tab.
Analyze the dynamics in your repositories
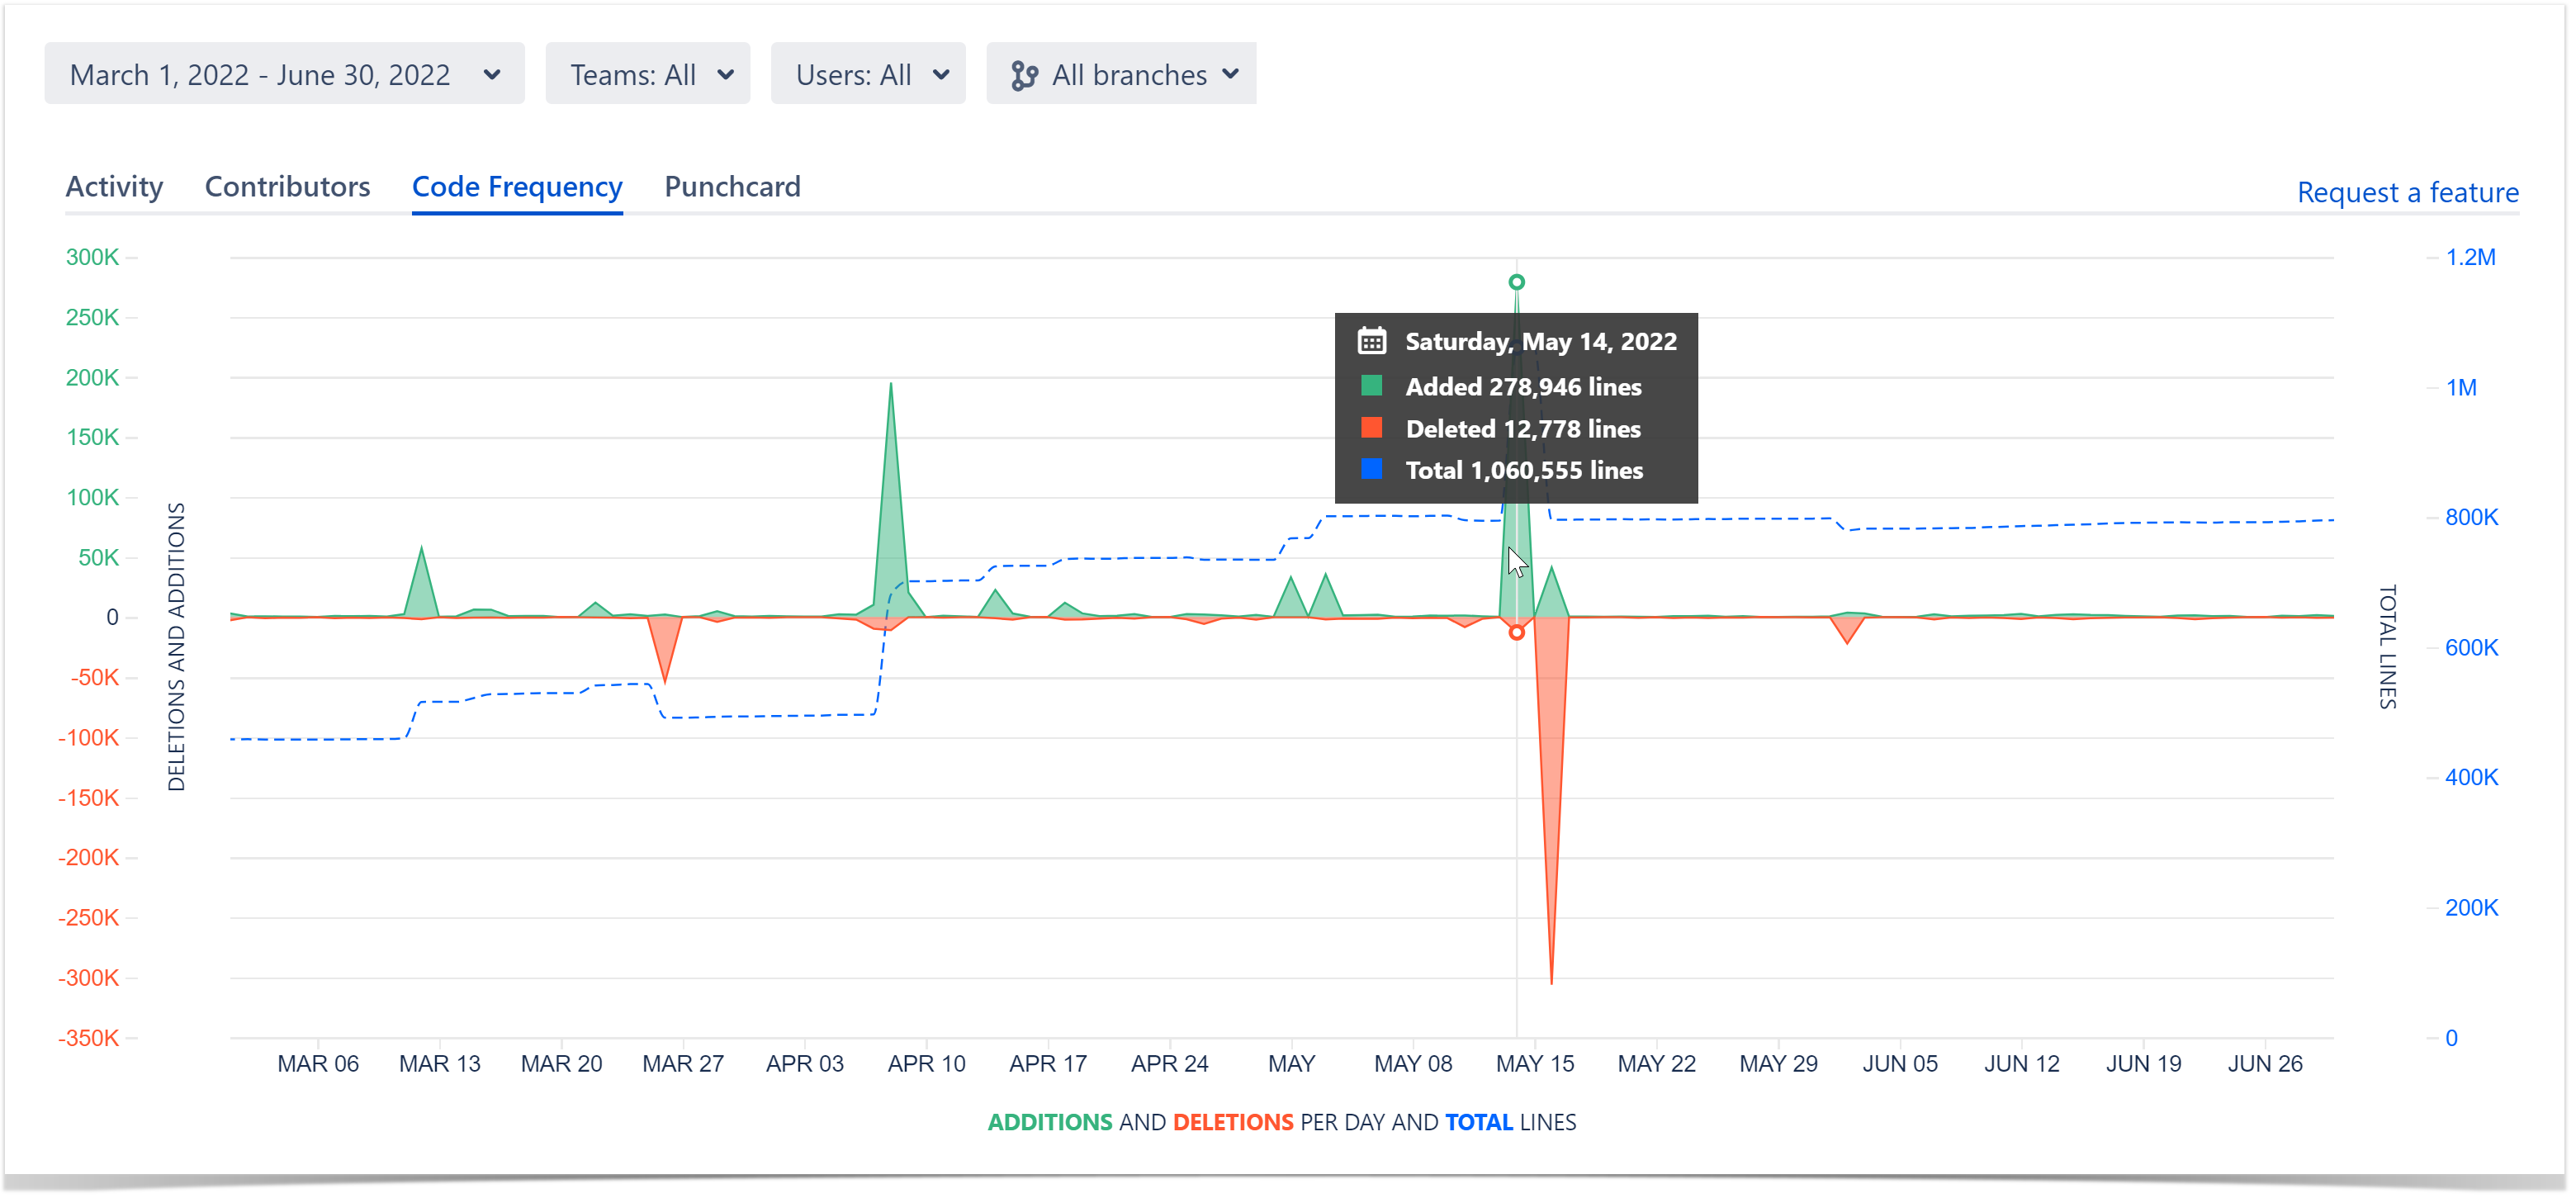
The green and red graphs with the left-hand scale show added and deleted lines of code per week, respectively. The dotted blue line with the right-hand scale represents the total number of existing lines. Hover over a specific day in the graph to view detailed statistics for it in a pop-up tip.
By default, all files except binaries are counted in lines of code statistics. It is possible to exclude files and directories from statistics. Learn more
Filtering the displayed data
You can filter all the information displayed in the Code Frequency graph to show the activity of certain contributors over a specified period.
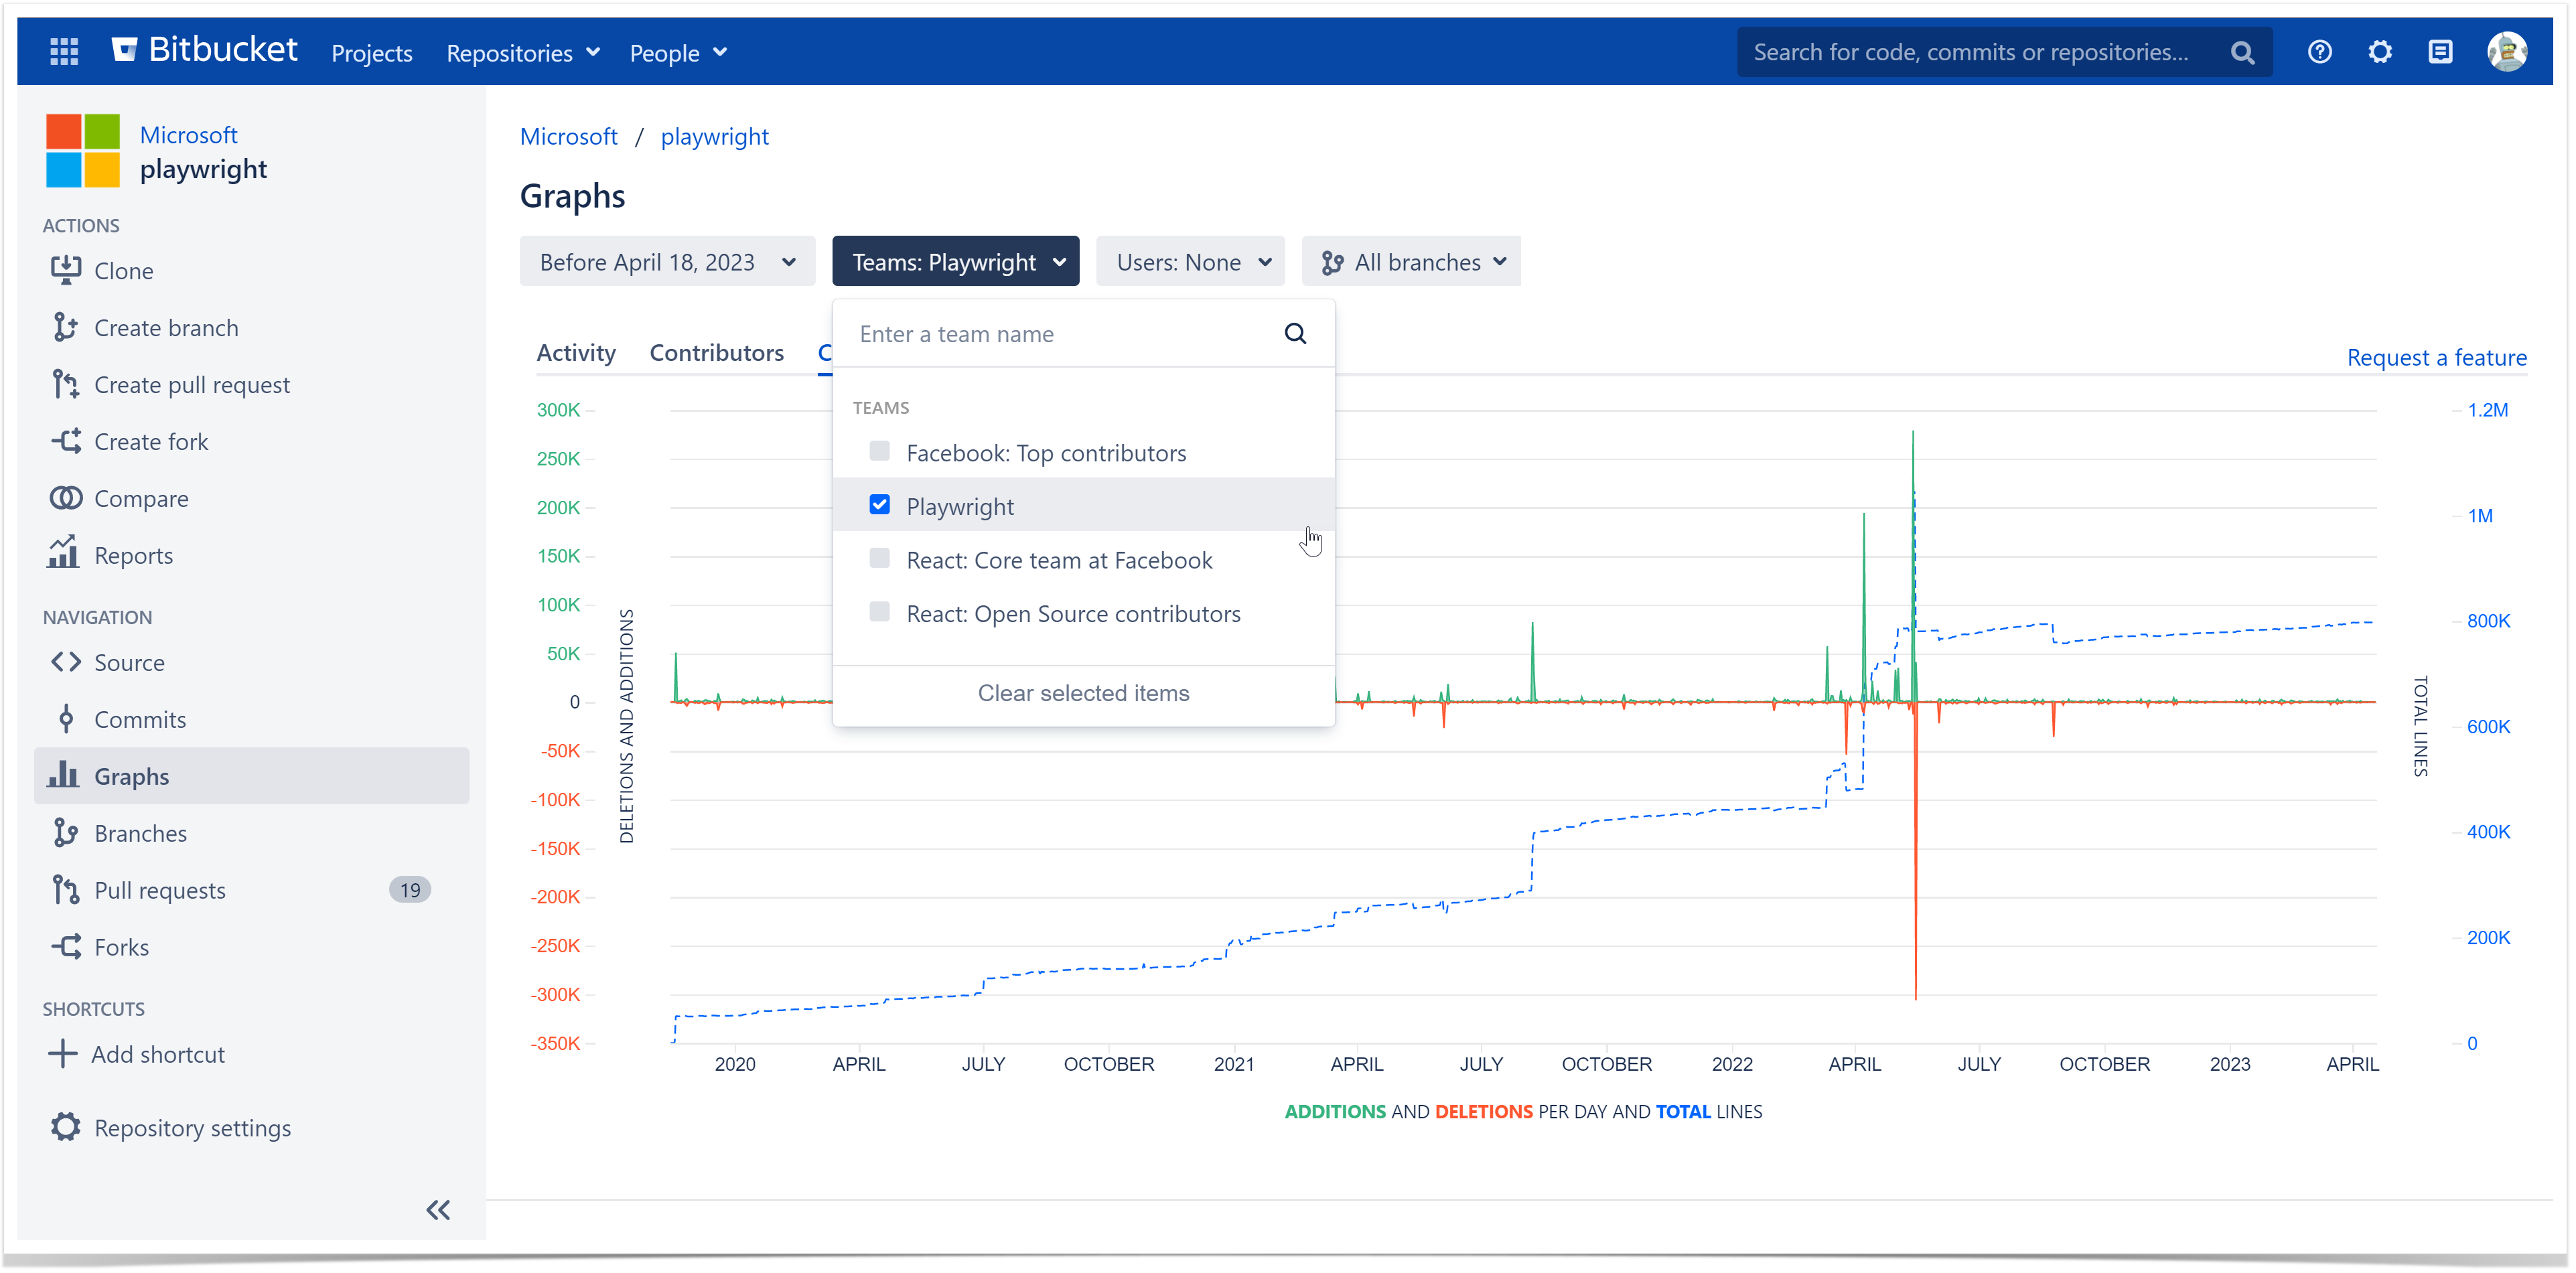
Track the dynamics of a particular user or a team
By default, the Code Frequency graph displays added, deleted, and total lines of code of all contributors of a repository.
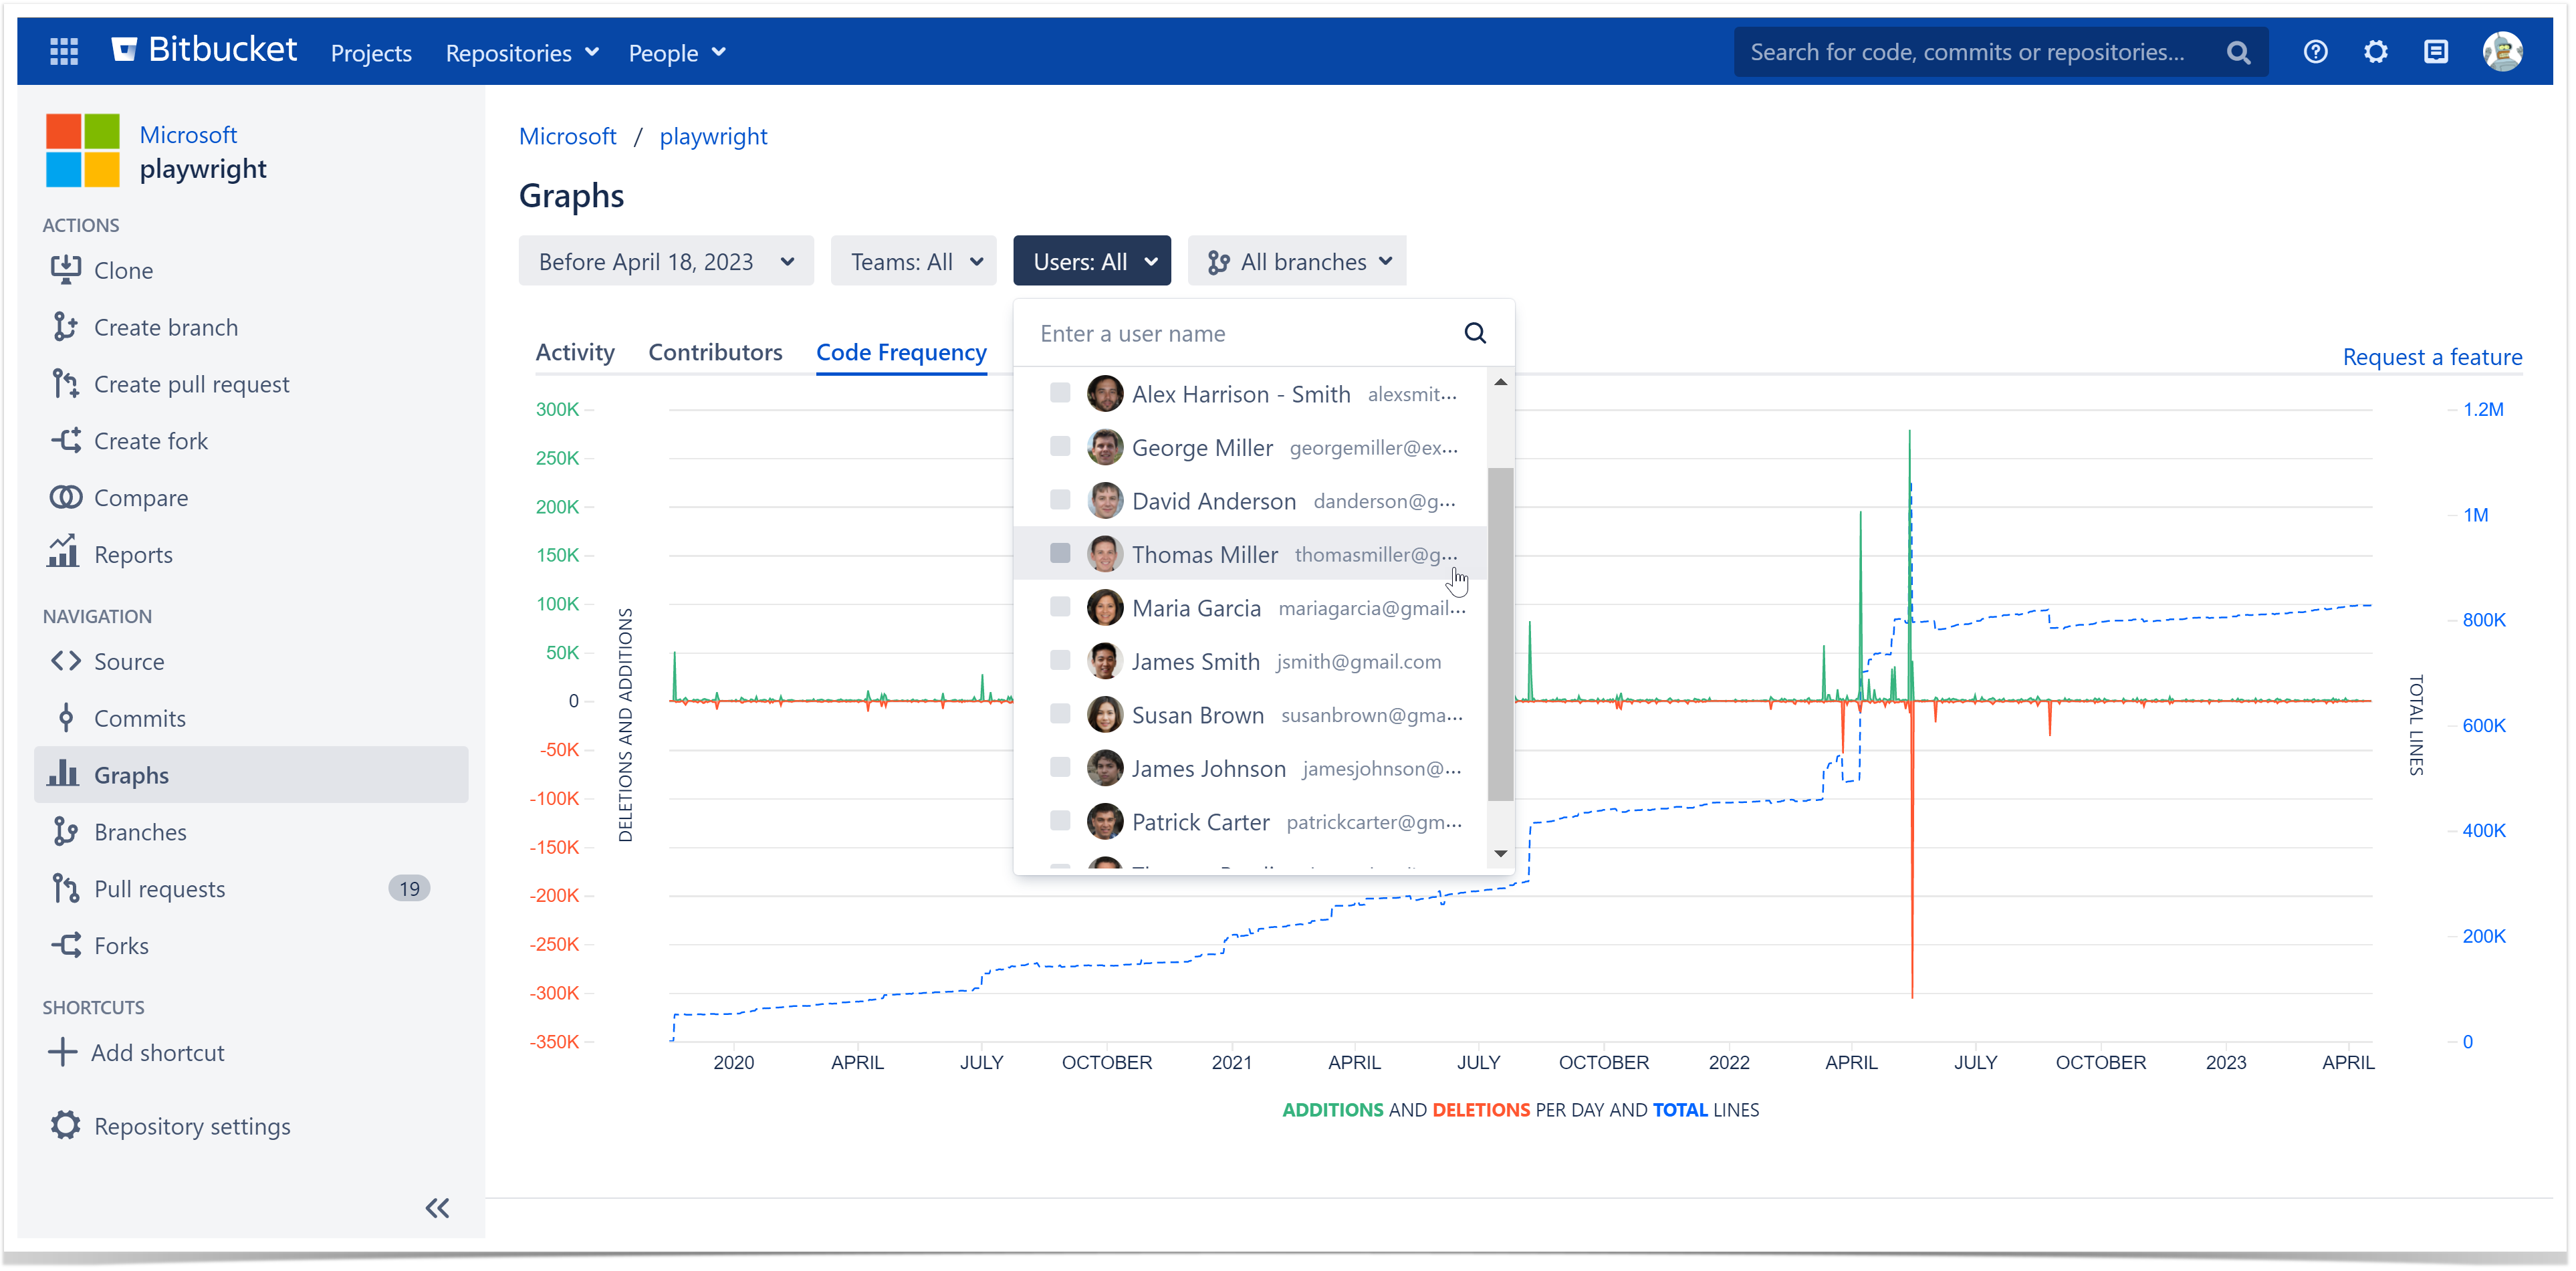
You can use the Teams and Users dropdown menus, separately and combined, to filter the results shown on the page.
Choose a team in the Teams tab to see team statistics. Read more about teams here.
Choose a user in the Users tab to see personal statistics. The users are selected from the list of Bitbucket users who have read access to the current repository or project.
Track the dynamics over a certain period
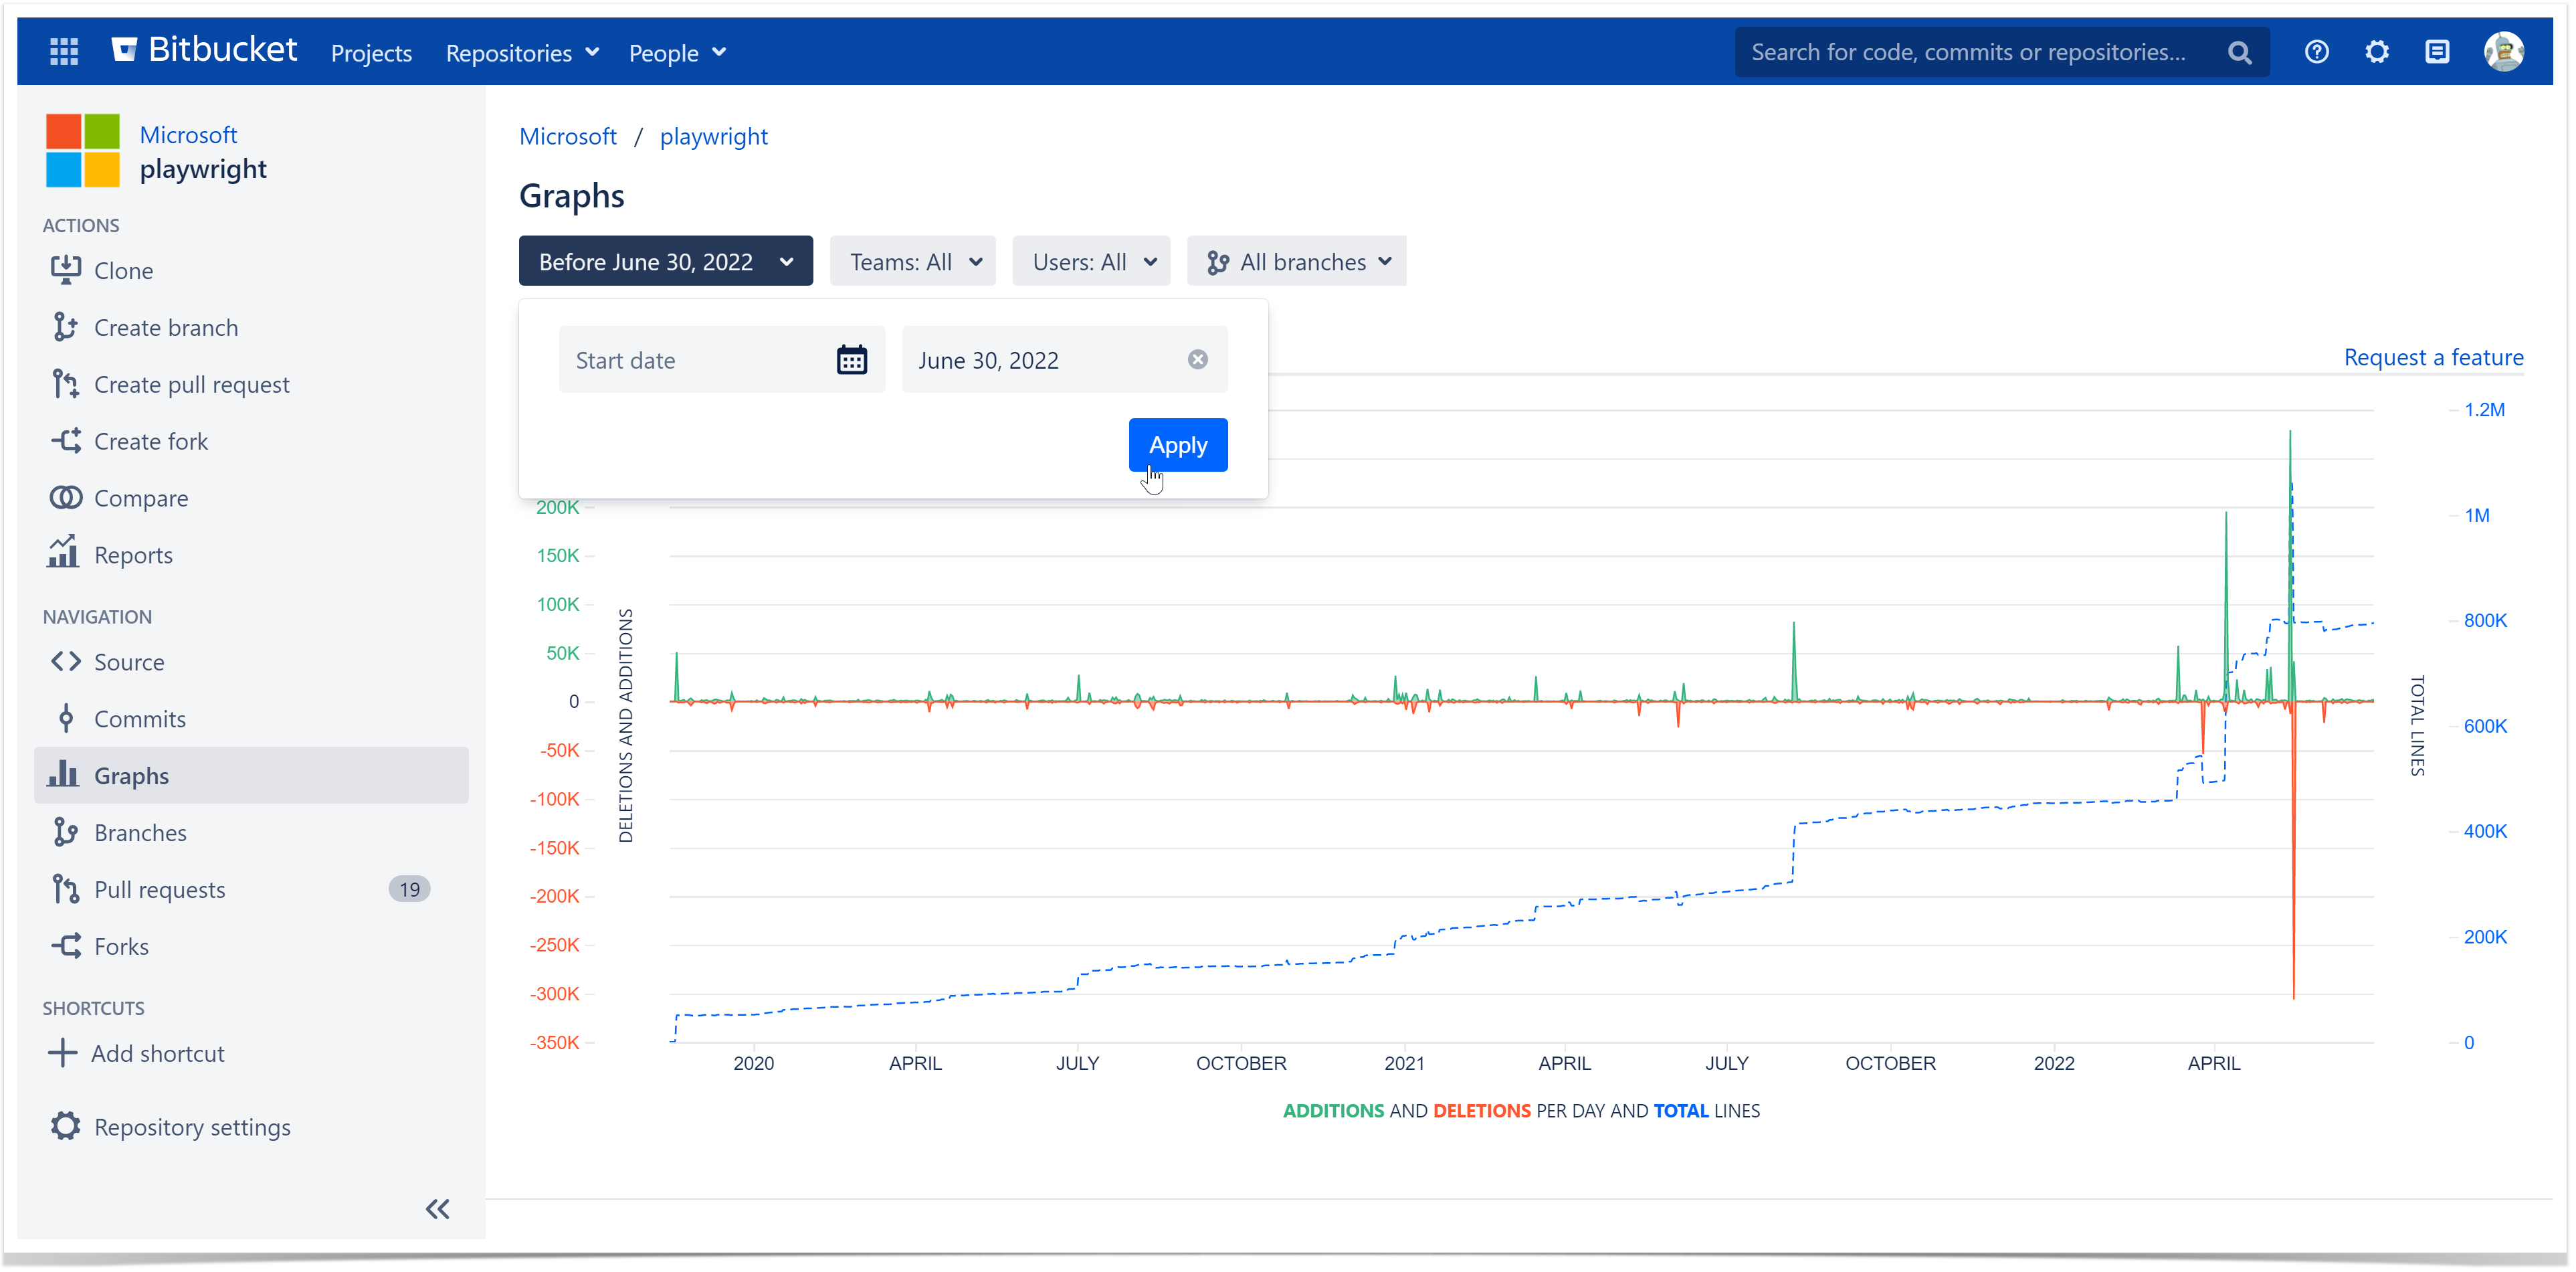
To set a time span, navigate to the Time Span menu and select one of the options or click Custom to set a custom time span.
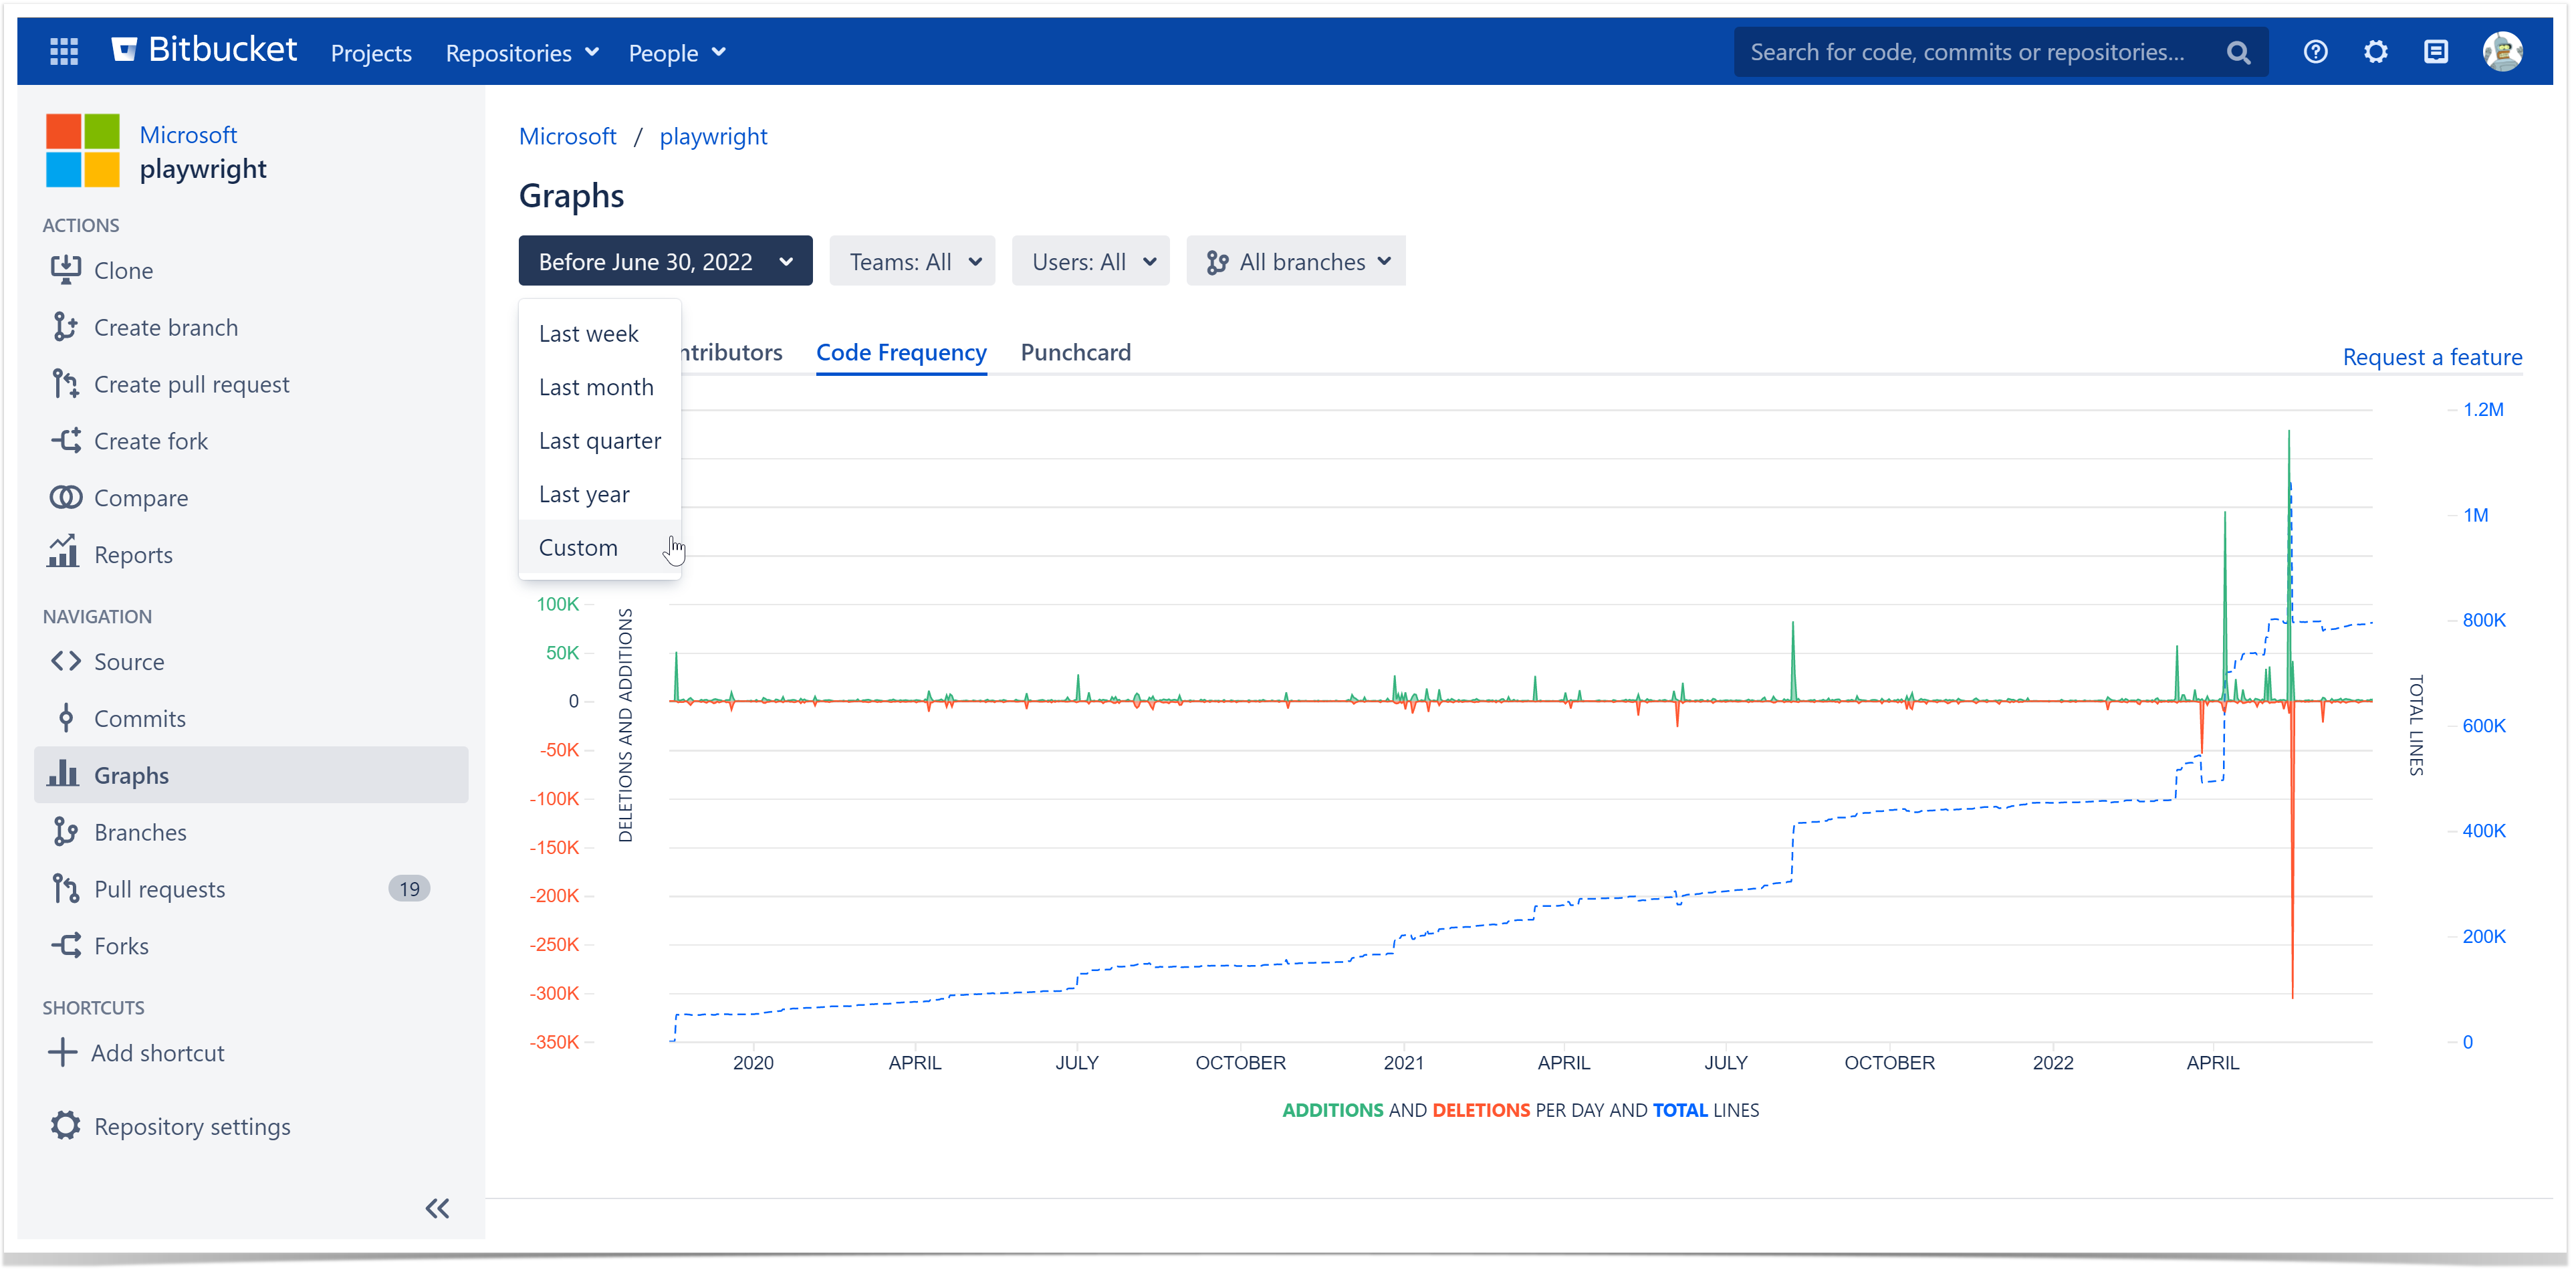
Hint: If you want to see the data from the beginning of the repository, use the Custom period and leave the Start date blank.