Download PDF
Download page Contributions.
Contributions
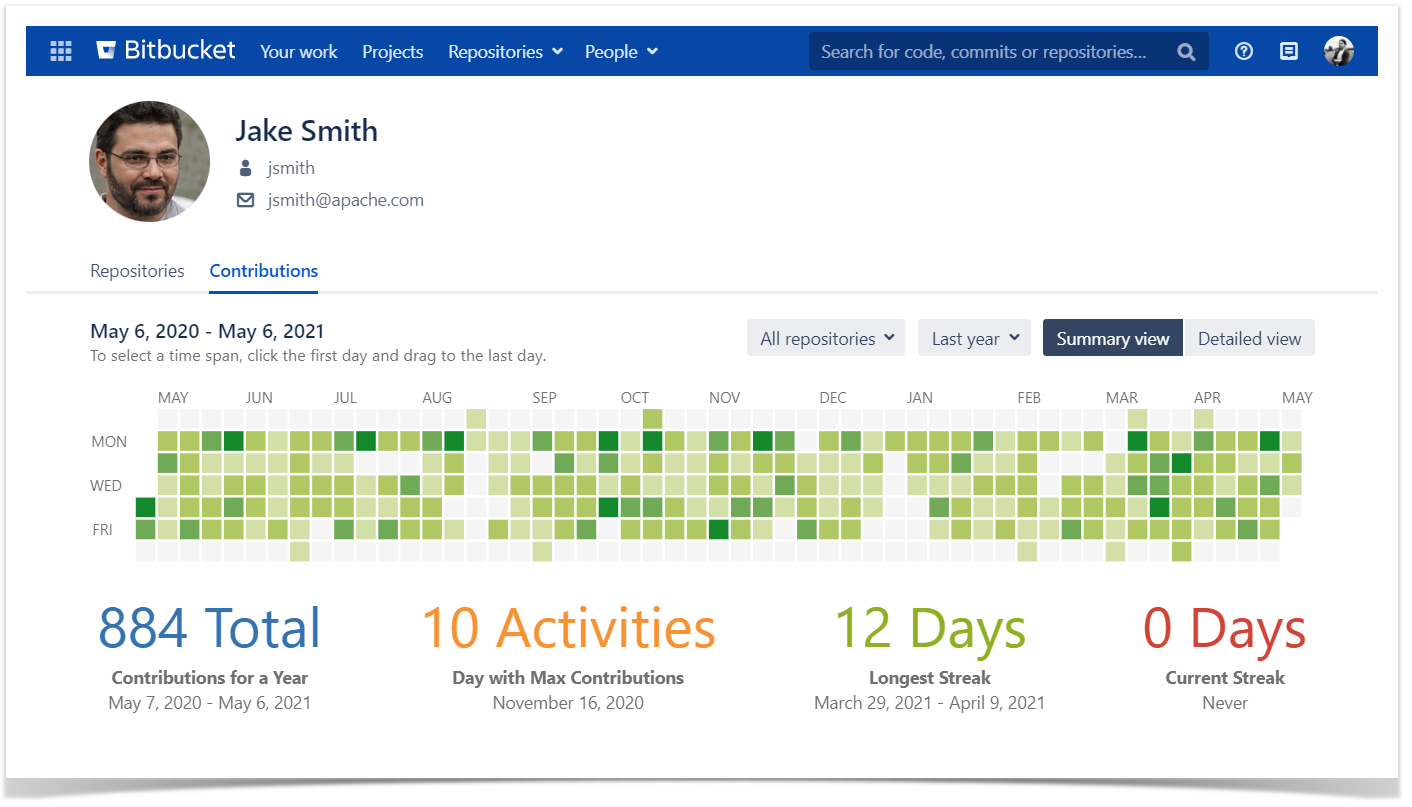
In the Contributions tab of the Bitbucket Server / DC user profile, you can see the activity of a single contributor in terms of commits and pull requests over a given period of time. You can see how the efforts of a developer were distributed during the past year and what repositories they worked in.
The data displayed includes:
- The Contributor Calendar, allowing you to get a summarized overview of all contributions or a detailed breakdown by repository or project.
- The Activity stream of all commits and pull requests within the selected time span, shown with links to the associated JIRA issues, hashes, and Change Type lozenges.
Here, by contribution, we understand the sum of all commits and pull requests made by a user across all projects, repositories, and branches.
Below on the page, you'll find:
- a detailed description of all elements
- instructions on how to view the activity statistics
For easier navigation, use the Table of Contents at the top-right of the page.
See how the efforts are distributed
You can get an overview of all contributions with the Contributor Calendar and track the stream of all commits and pull requests Activity section at the bottom of the page.
Contributor Calendar
The Contributor Calendar has two views:
- Summary — contributions from all/selected repositories are summarized and shown together.
- Detailed — visualizes the breakdown of all activity by repository and project.
Use the split button in the right top corner to switch between views.
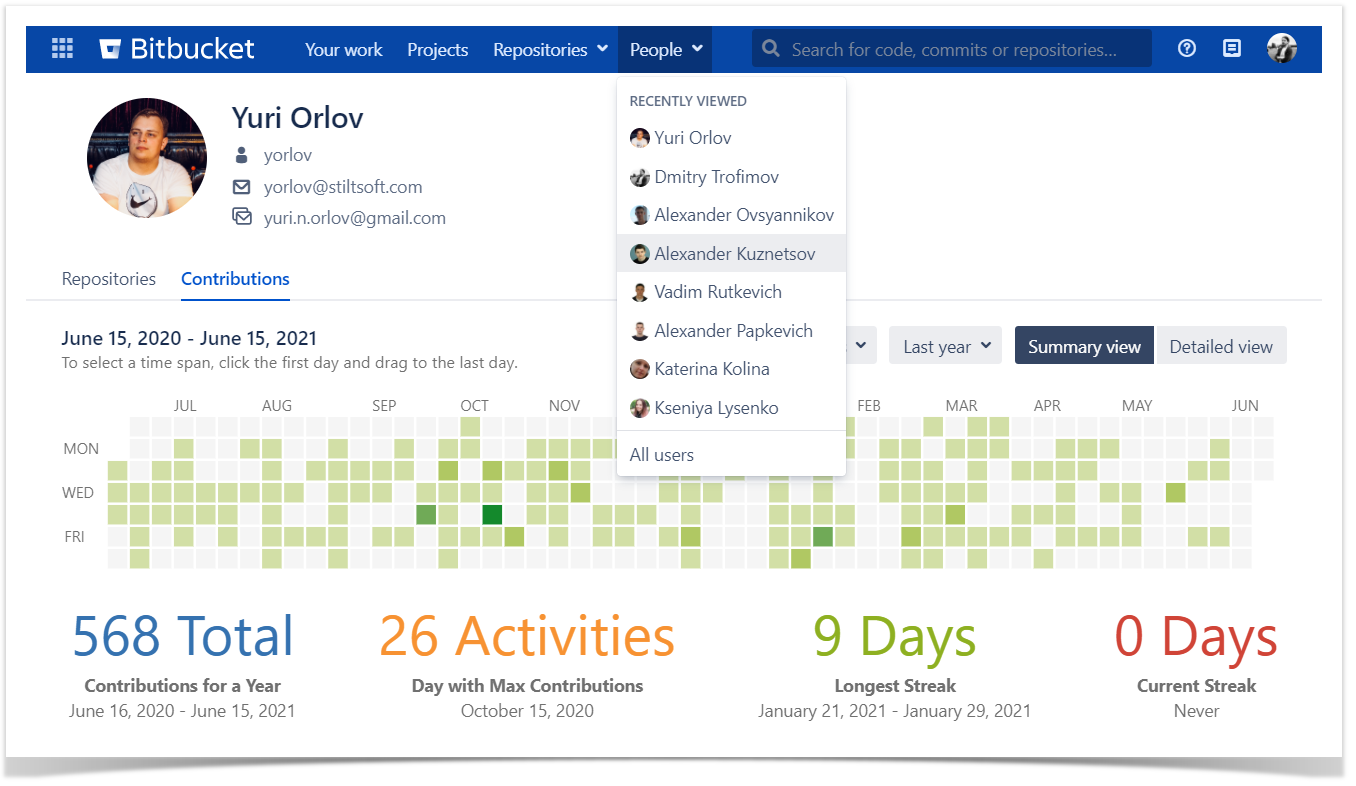
Summary view
The calendar in the Summary view has commits and pull requests from all repositories joined together.
By default, it shows the Calendar and Activity stream with commits and pull requests for the past year.
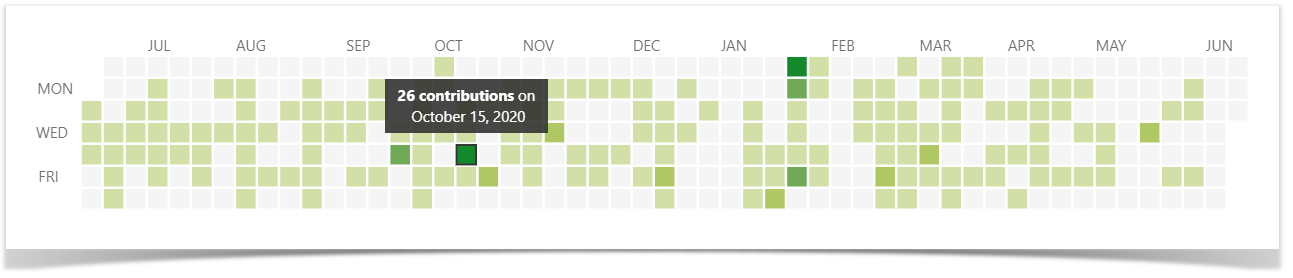
Hover your mouse over a square (each square represents one day), to see how many contributions were made that day.
To view the activity details over a certain time span, do one of the following:
- to see the contribution activity for one day, click the square representing that day in the calendar;
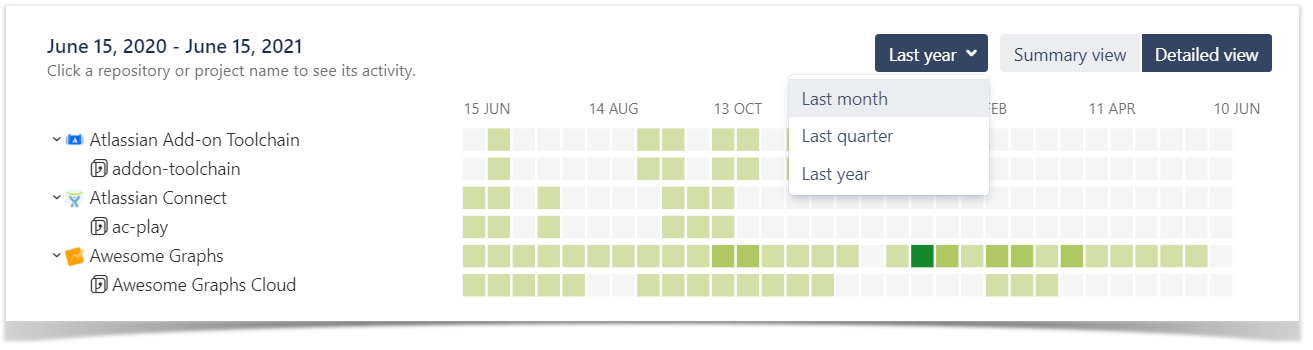
- to see the contribution activity for the last year/quarter/month/week/3 days/24 hours, choose a predefined value from the drop-down menu in the upper-right corner of the user calendar;
- to see the contribution activity for a custom time span, select a range of days by clicking the first day (start point of the time span) and dragging to the last day of the time span.
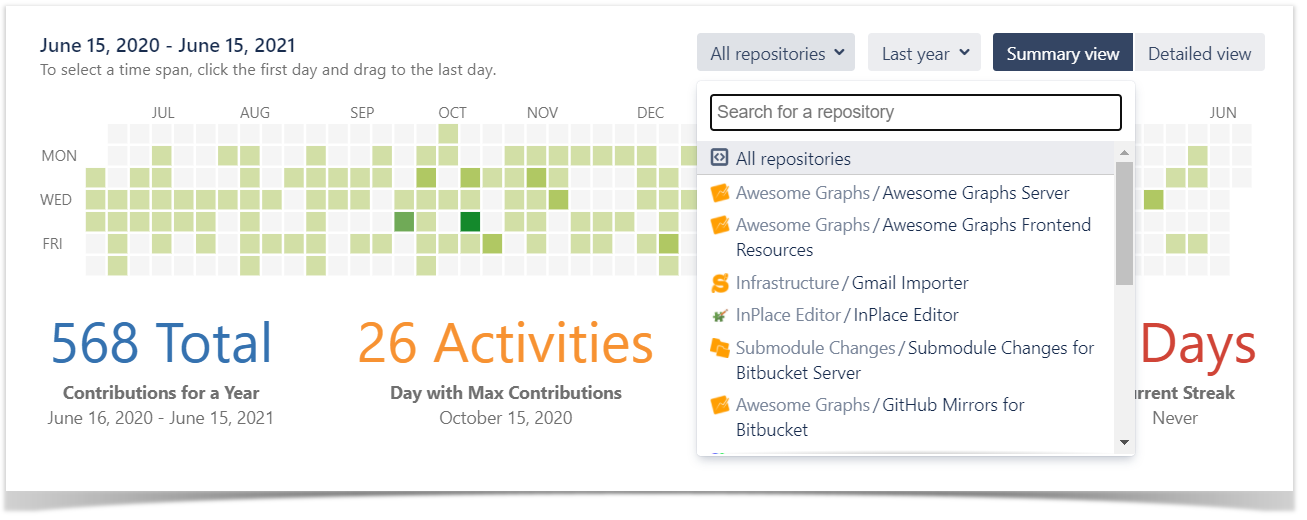
You can also see the list of all repositories a user contributed to within the last year in the Repositories filter. By default, All repositories is selected. When you select one of the repositories from the list, the contributions statistics are filtered and the Contributor Calendar is updated based on your repository selection.
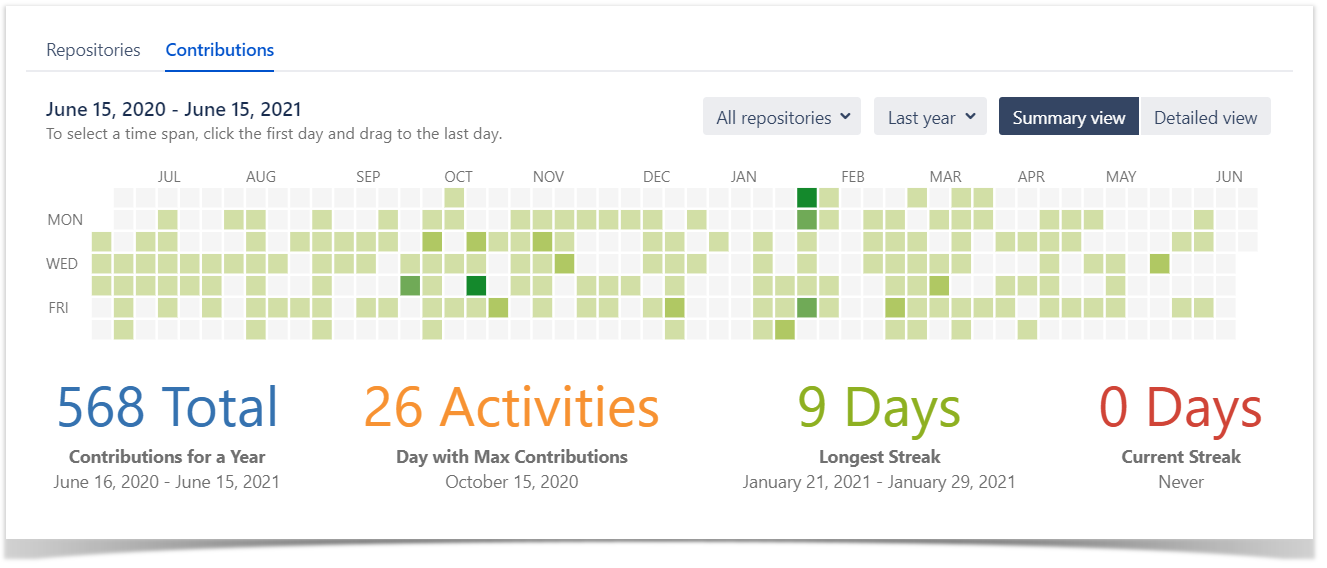
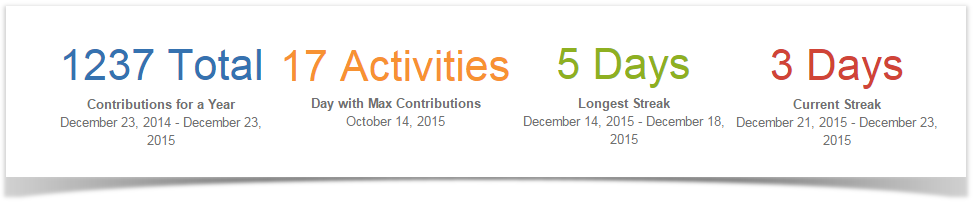
Below Contribution Calendar, you can see:
- contributor’s total amount of commits over the last year;
- the day on which the maximum number of contributions was made within last year (the date and the number of contributions);
- duration of the contributor's longest streak (streak is the number of days in a row the contributions were made by a Bitbucket user);
- duration of the contributor's current streak.
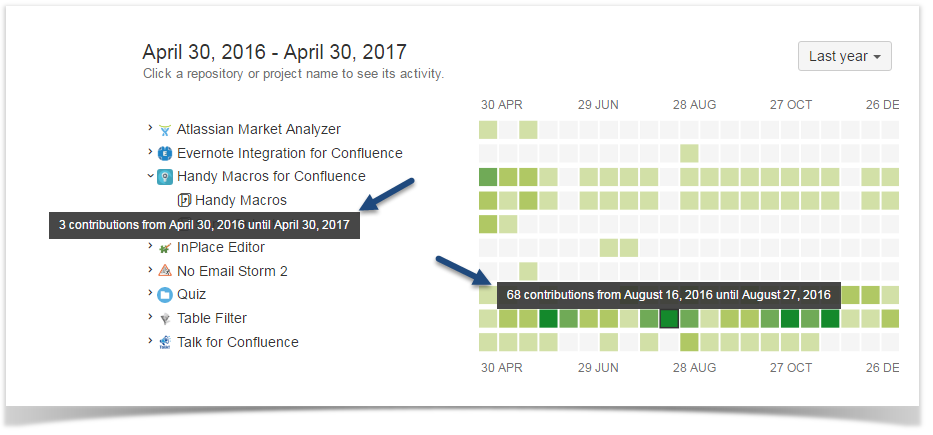
Detailed view
The calendar in the detailed view shows commits and pull requests summarized by repository and project.
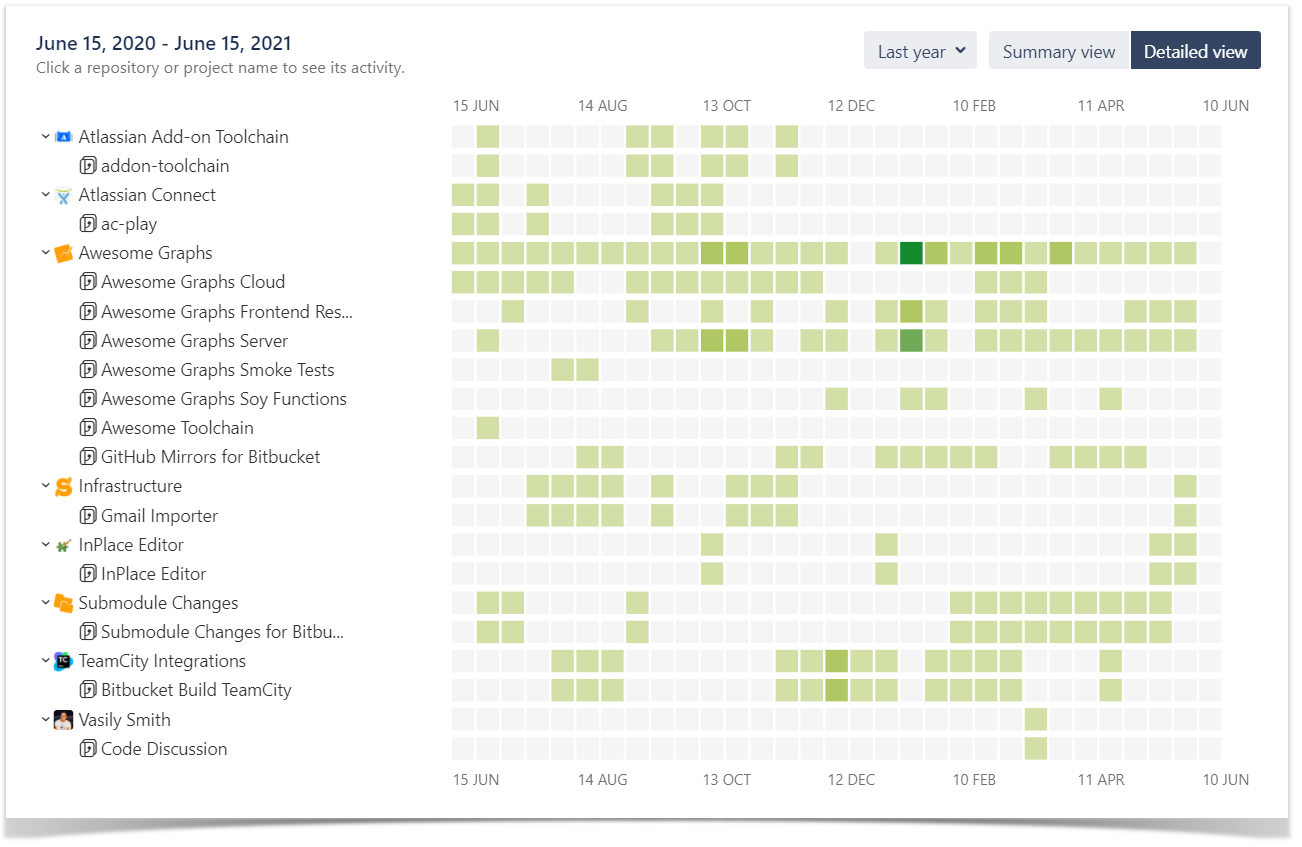
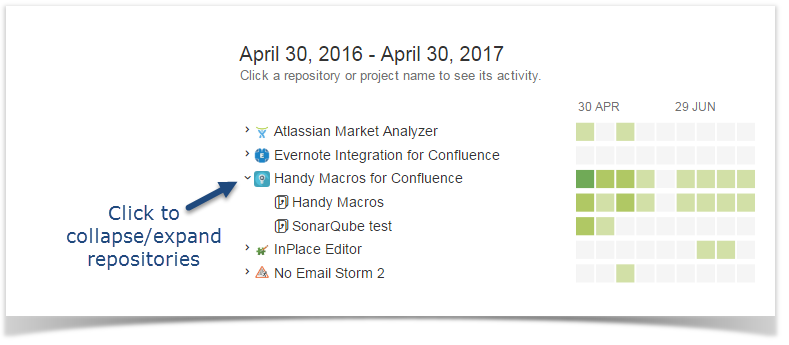
Each row of squares is one project or repository. By default, the calendar shows both projects and repositories. You can collapse and expand repositories.
Use the filter to change the time span for the calendar.
Hover over a square, project or repository, to see the hint with the number of contributions.
Below the Calendar, you can find the activity stream with details about commits and pull requests. The Activity stream is updated, when:
- the time span is changed
- you click a square
- you click a project or repository
Activity stream
In the Activity section below the Contributor Calendar, all user's contributions (commits and pull requests) are shown as an activity stream with links to the associated JIRA issues and Change Type lozenges. Contribution Activity Stream displays the contributions within the set time span. Its content changes together with the adjustment of Time Span.
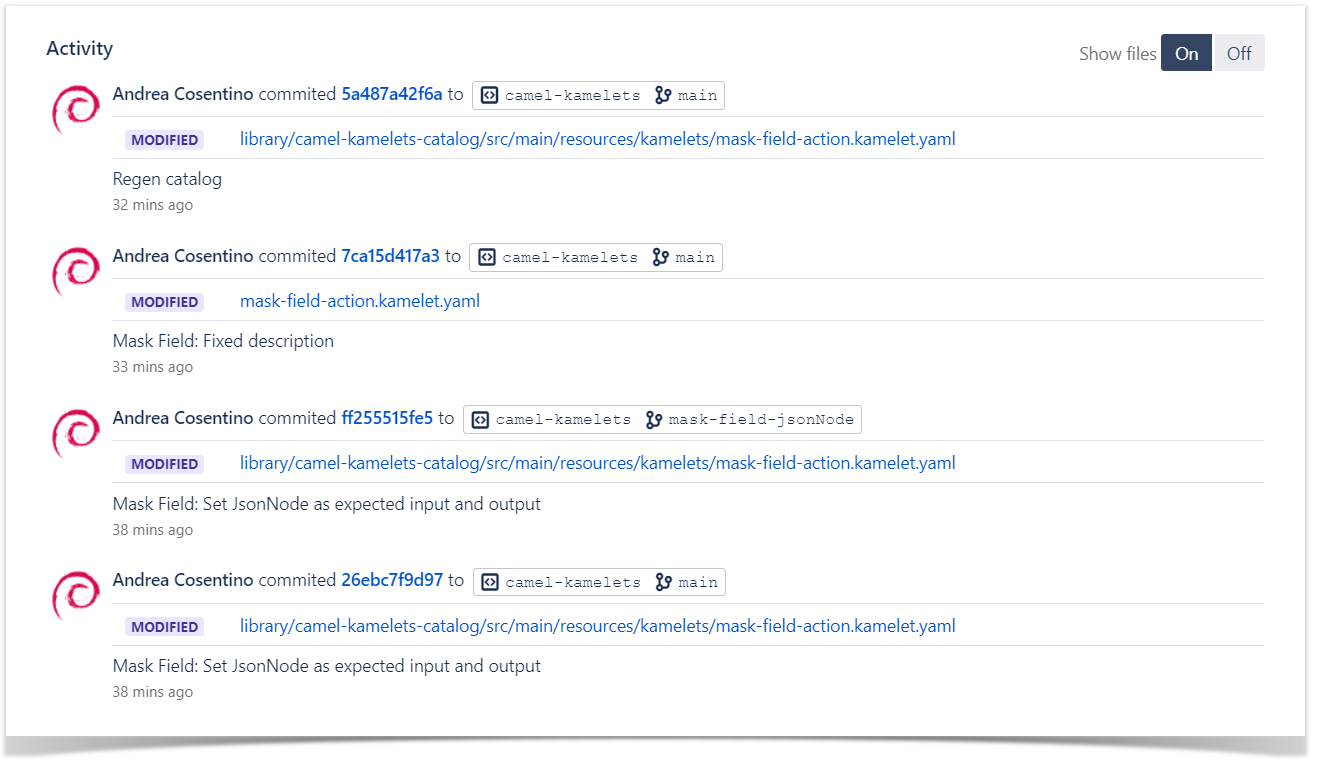
For more information about linking Bitbucket Server and JIRA, look here.
How to view the activity statistics
The app allows you to view the activity statistics for each Bitbucket Served / DC user, as well as your own.
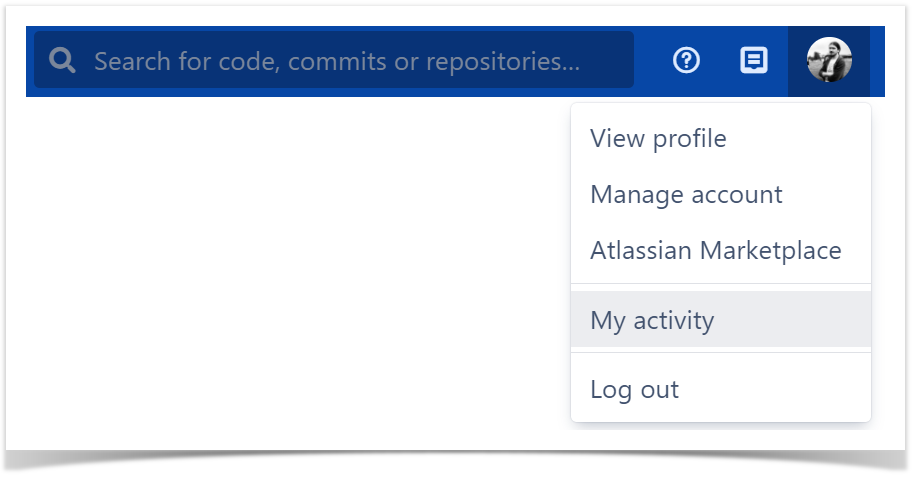
Viewing Your Personal Statistics
To see your personal statistics, select My Activity from the menu in the upper-right corner of the Bitbucket Server / DC page.
Viewing Others' Statistics
To see the statistics of another contributor, navigate to the Contributions tab of their Bitbucket Server / DC user profile. You can do that in several ways:
Via the People drop-down menu
Select one of the names on the recently viewed list or locate the needed contributor on the People page and click their name.
Via the Activity tab in the repository
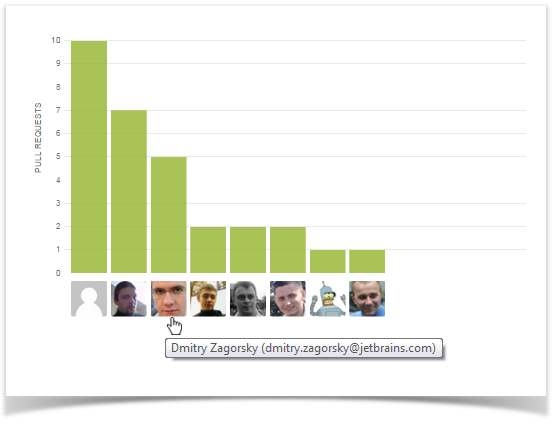
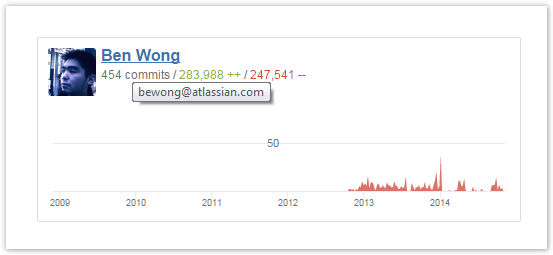
In the Activity tab, click a corresponding Bitbucket Server / DC user icon below the commits and pull requests charts or click the name of a contributor in the activity stream.
Via the Contributors tab in the repository
In the Contributors tab, go down to the Contributors list and click the name of a contributor.
Contributors who are not Bitbucket Server users don't have Bitbucket Server / DC profiles. So there are no Contributions statistics for them.
For a commit to be displayed by Awesome Graphs, the user's emails specified in Git and Bitbucket Server / DC account should match. If this is not the case, you can use aliases in the user profile settings.