| Panel | ||||||
|---|---|---|---|---|---|---|
| ||||||
Table Filter and Charts for Confluence add-on allows you to set the number of table rows to show, enable static or dynamic row numbering and apply the default sorting order to each table column. Additionally, you can regulate width of filter boxes, enable fitting the table to the allocated screen area or enable hiding the filtration pane. |
| Table of Contents |
|---|
| Widget Connector | ||||||
|---|---|---|---|---|---|---|
|
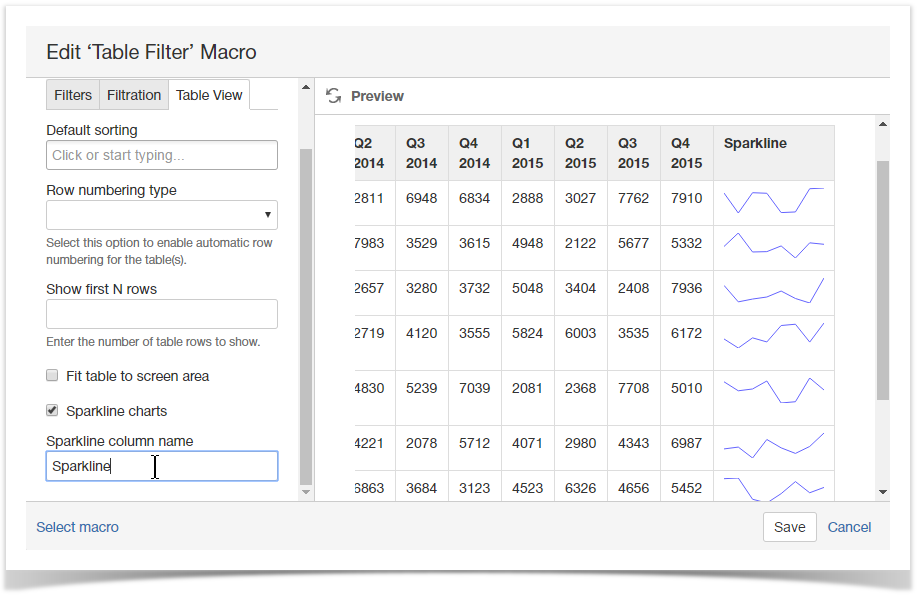
Showing Sparkline Charts within Tables
Starting from version 3.6.0 Table Filter and Charts add-on allows you to embed sparkline charts into the table column. Sparkline charts allows you to quickly visualize your data sets and see the data movements at once.
- Switch the page to the edit mode.
- Select the macro and click Edit.
- Switch to the Table View tab.
- Locate the Sparkline charts option and select it.
- Specify the appropriate name for the column outputting sparkline charts or leave it as is.
- Click Save.
- Once you save the page, you will see sparkline charts in a new table column.
| Info |
|---|
If your table contains decimal numbers, you may need to specify the correct decimal separator on the Filtration tab. |
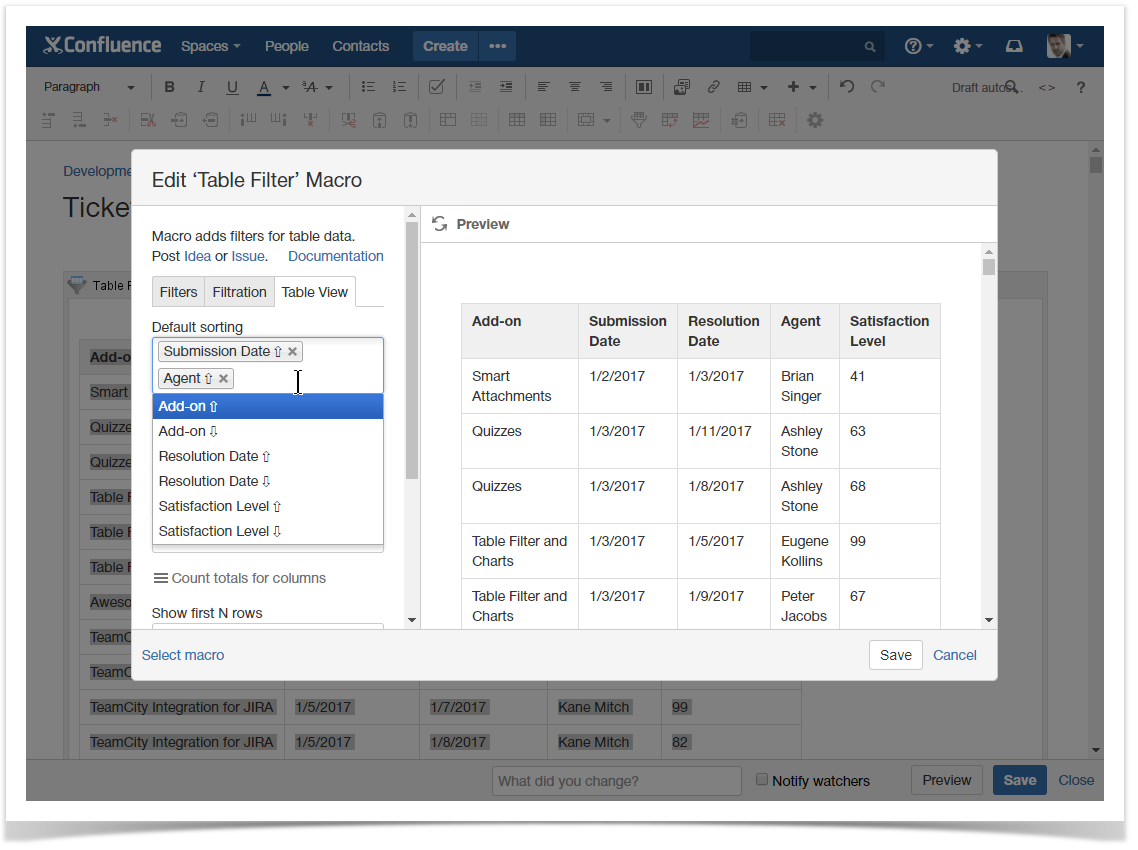
Applying the default sorting order to columns
Starting from version 3.1.0 Table Filter and Charts add-on allows you to apply default sorting order to values in multiple columns. You can sort one or multiple table columns in the ascending or descending order.
- Switch the page to edit mode.
- Select the macro and click Edit.
- Switch to the Table View tab.
- Locate the Default Sorting box.
- Click it and select the columns with the appropriate sorting order in them. Once you have saved the macro and the page, the defined sorting order is automatically applied to the selected columns.
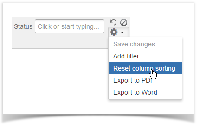
| Info |
|---|
You can also reset the applied sorting order for columns by selecting Reset column sorting on the filtration pane.
|
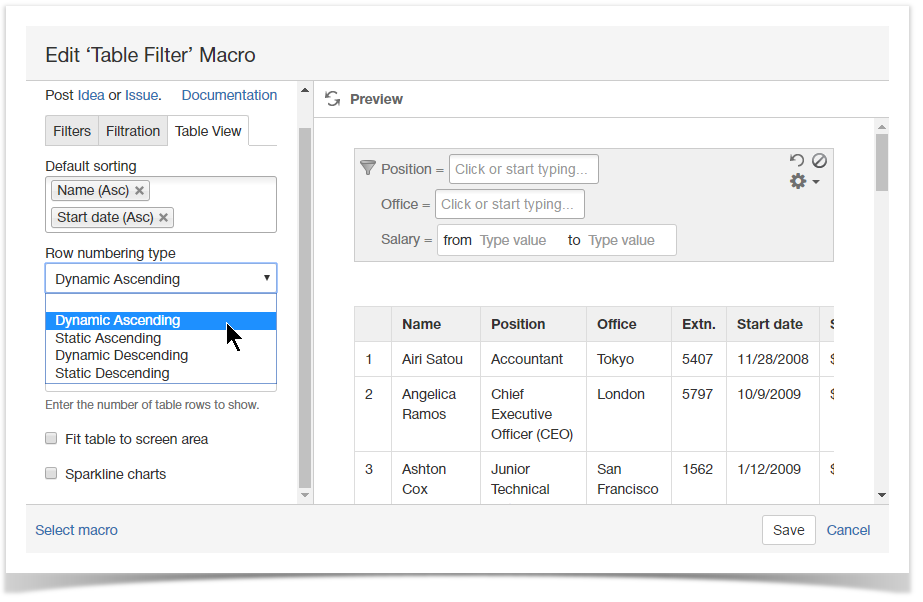
Adding automatic row numbering
Table Filter add-on allows you to enable either dynamic or static row numbering. The difference between these numbering types is in the following:
- If you use dynamic row numbering, row numbering is updated each time you filter the table. So all the time your row numbers will look like 1, 2, 3 and so on.
- If you use static row numbering, rows are numbered one time and row numbers are preserved all the time you filter the table. So after filtration your rows may be numbered like 2, 5, 6, 8 and so on.
You can enable automatic row numbering if you have a large data table.You can choose among the following options:
- Dynamic Ascending
- Dynamic Descending
- Static Ascending
- Static Descending
- Switch the page to edit mode.
- Select the macro and click Edit.
- Switch to the Table View tab.
- Locate the Row numbering type box and select the appropriate row numbering option.
Showing First N Rows
- Edit the page with the Table Filter macro and the table within it.
- Click the Table Filter macro.
- Click Edit.
- Select the Table View tab.
- Locate the
After saving the page, the table will show only the specified number of rows.
| Info |
|---|
From version 3.9.10, you can use the dynamic modificator N+. For example, you can set it as '2+'. In this case it will show 2 table rows by default when you use no filtration. If you apply some filtration criteria, the set of filtered results will be expanded to show all the matches. |
| Info |
|---|
From version 3.10.8, you can use the modificator ' * ' (asterisk) to preserve the first rows of the table even when they do not match the specified filtration criteria. For example, if you want to show the first 3 rows of your table all the time, just enter '3*'. The table header will be included automatically. |
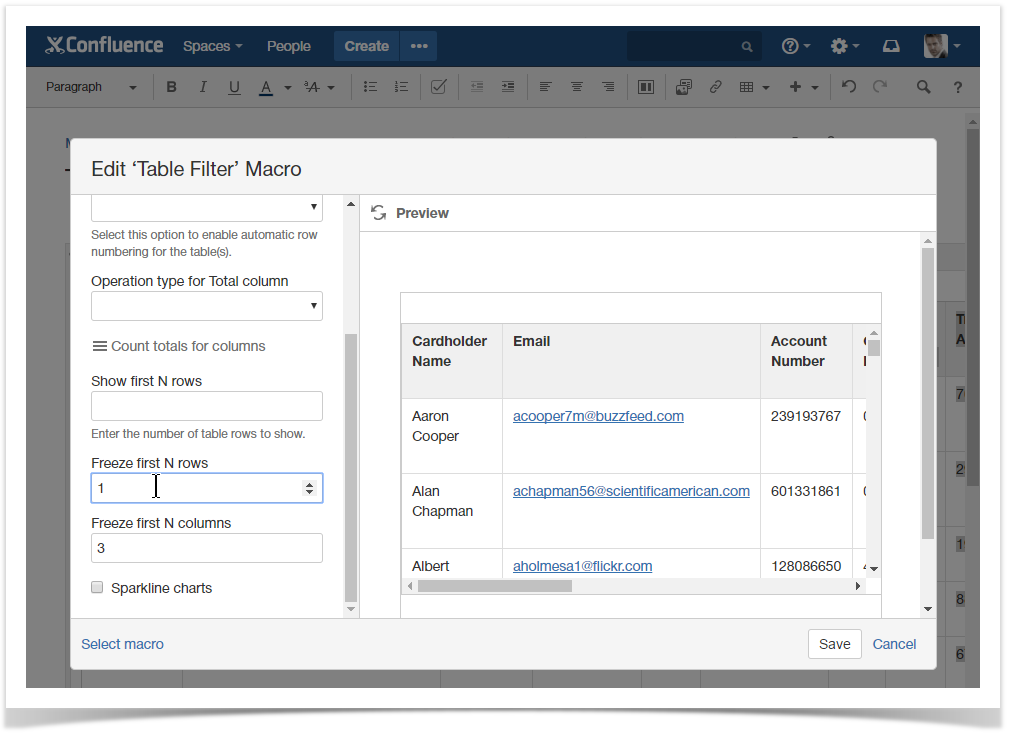
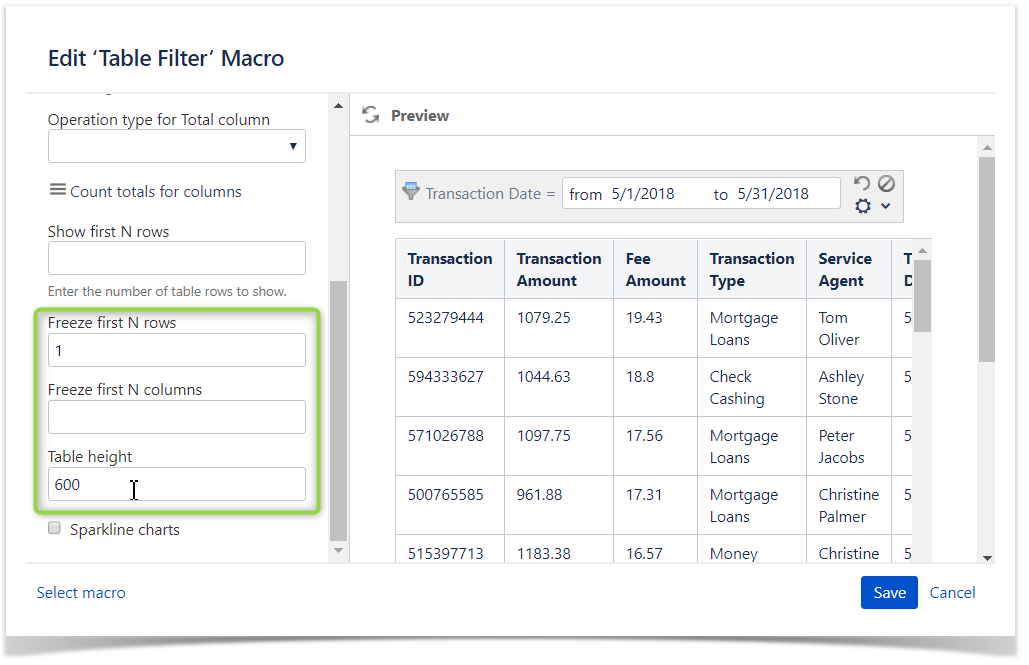
Freezing First N Rows/Columns
| Info |
|---|
This functionality replaces the existing Fit table to screen area option. It is available since the release of Table Filter and Charts 3.10.0. This option allows you to keep the relevant table rows and columns visible while you are scrolling your table horizontally or vertically. |
- Switch the page to edit mode.
- Select the macro and click Edit.
- Switch to the Table View tab.
- Locate the Freeze first N rows and Freeze first N columns options.
- Specify the correct number of rows and columns to freeze.
- Save the macro and page.
- Once you save the page, the table will automatically fit the available screen area or you can set the table height manually.
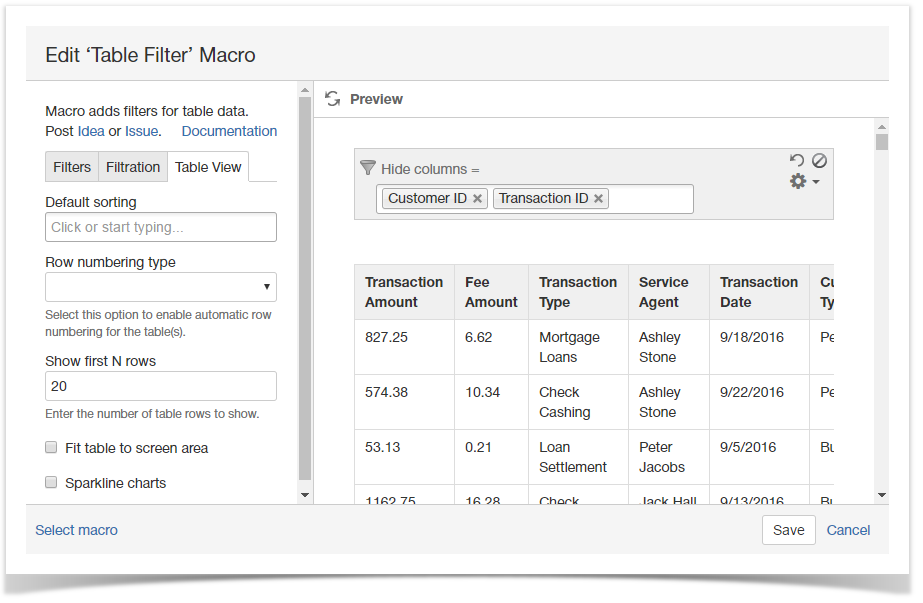
Hiding Table Columns
To enable the hiding of table columns:
- Switch the page to edit mode.
- Select the macro and click Edit.
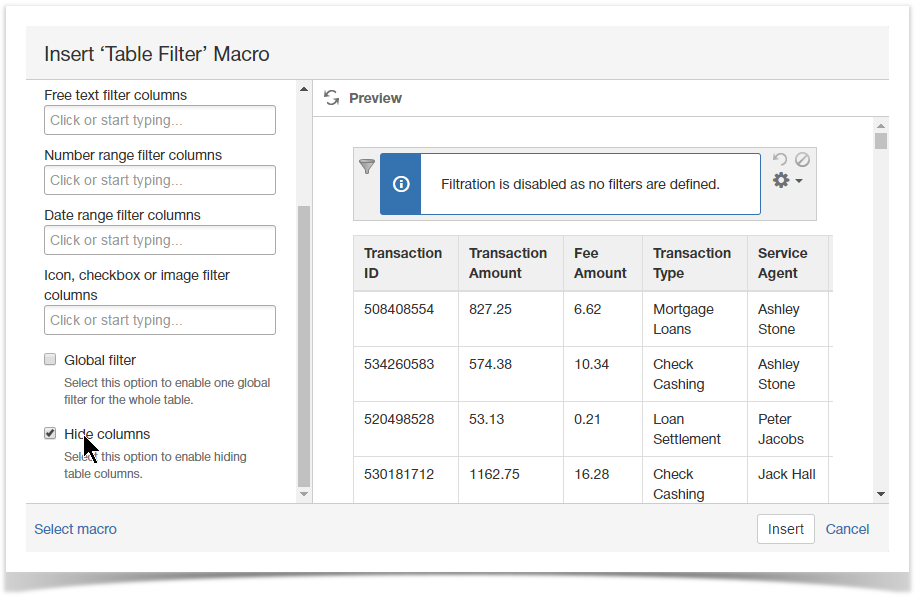
- In the Insert/Edit Table Filter Macro form, open the Filters tab.
- Select the Hide columns option.
- Locate the Hide columns box and select the columns you want to hide.
- Save the macro.
- Save the macro and page.
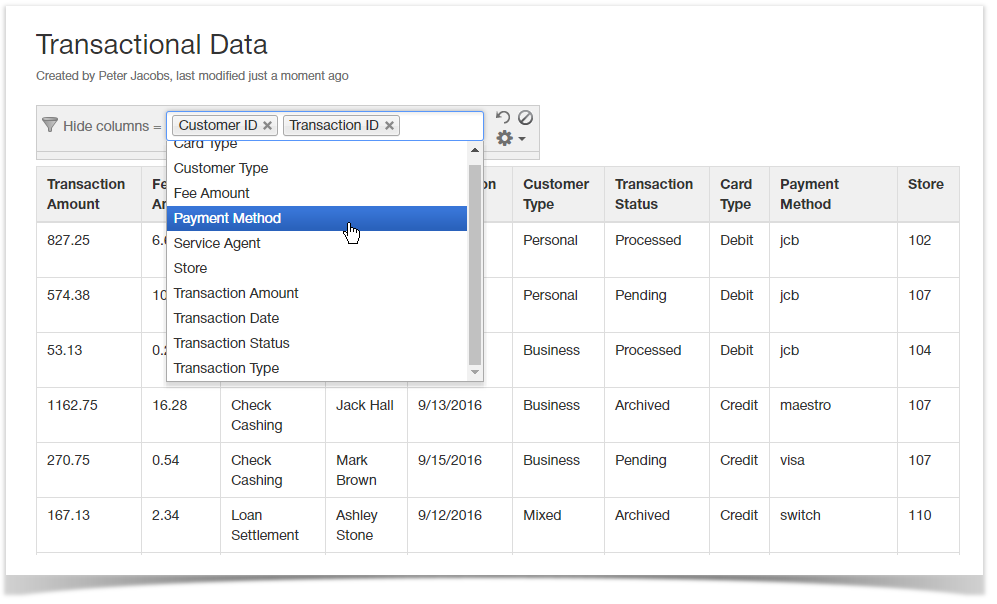
To hide specific columns:
- Open the page.
- Locate the Hide columns box.
- Select one or multiple table columns you want to hide.
Collapsing the filtration pane
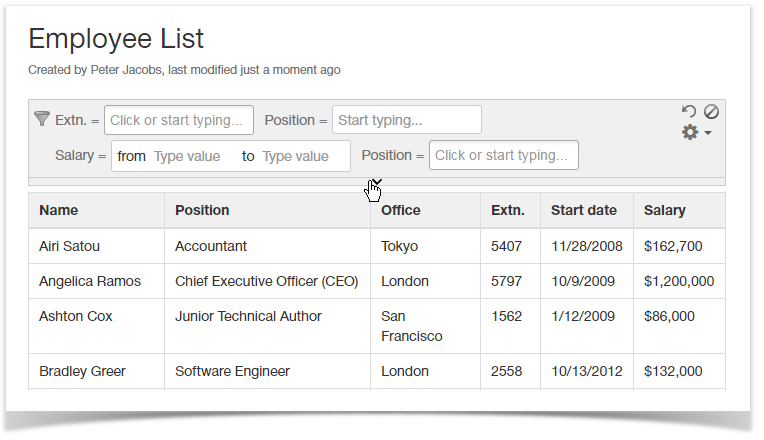
- Open the page with the Table Filter macro.
- Point to the bottom part of the filtration pane.
- Click the collapse bar.
The filtration pane will be hidden.
Expanding the Filtration Pane
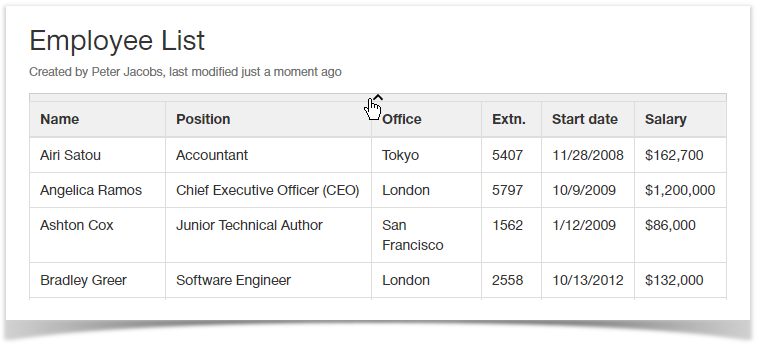
- Open the page with the Table Filter macro.
- Point to the header of the table.
- Click the expand bar.
The filtration pane will be expanded.
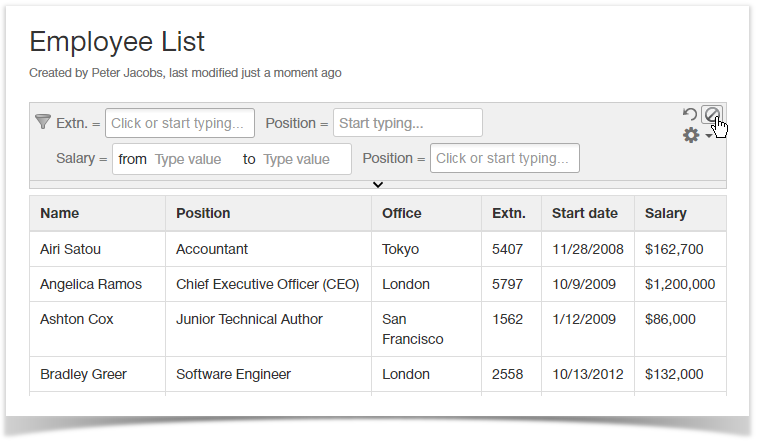
Disabling Filters on the Filtration Pane
- Open the page with the Table Filter macro.
- On the filtration pane, locate and click the Disable all filters
 icon.
icon.
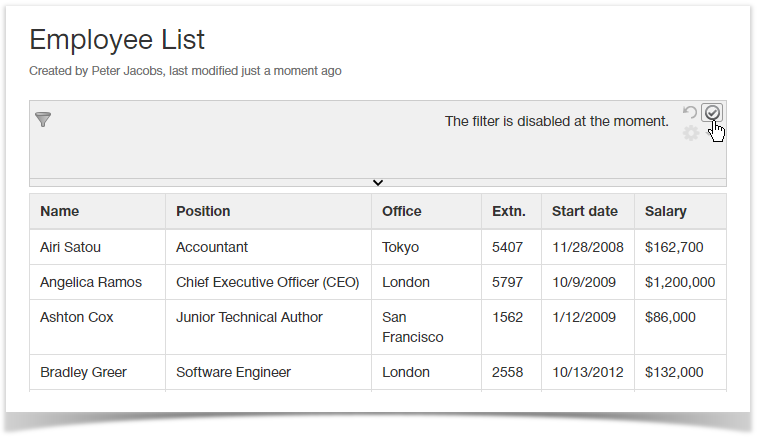
Filters are hidden on the filtration pane.
| Info |
|---|
In situations when you want to load the page with the disabled filters by default, you can use the Disable filtration at start option. |
Enabling Filters on the Filtration Pane
- Open the page with the Table Filter macro.
- On the filtration pane, locate and click the Enable all filters
 icon.
icon.
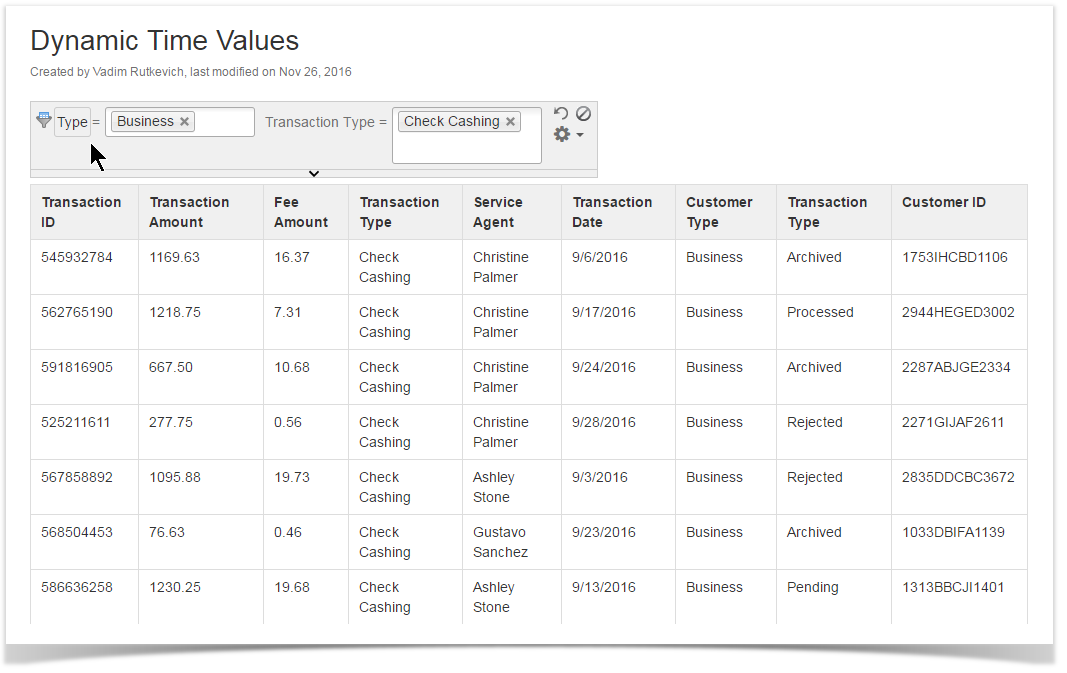
Renaming the Filter Labels (in page view mode)
- Open the page with the Table Filter macro.
- On the filtration pane, locate the filter label you want to edit.
- Double-click the label and enter a new title.
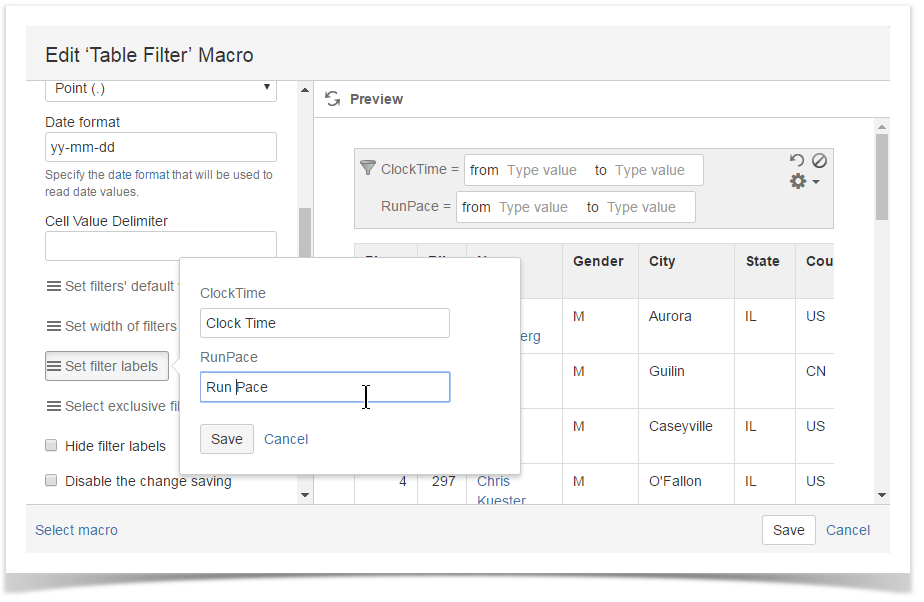
Renaming the Filter Labels (in page edit mode)
- Switch the page to edit mode.
- Select the macro and click Edit.
- Switch to the Filtration tab.
- Click Set filter labels.
- Enter a new title for the filter label.
- Click Save.
- Save the macro and page.
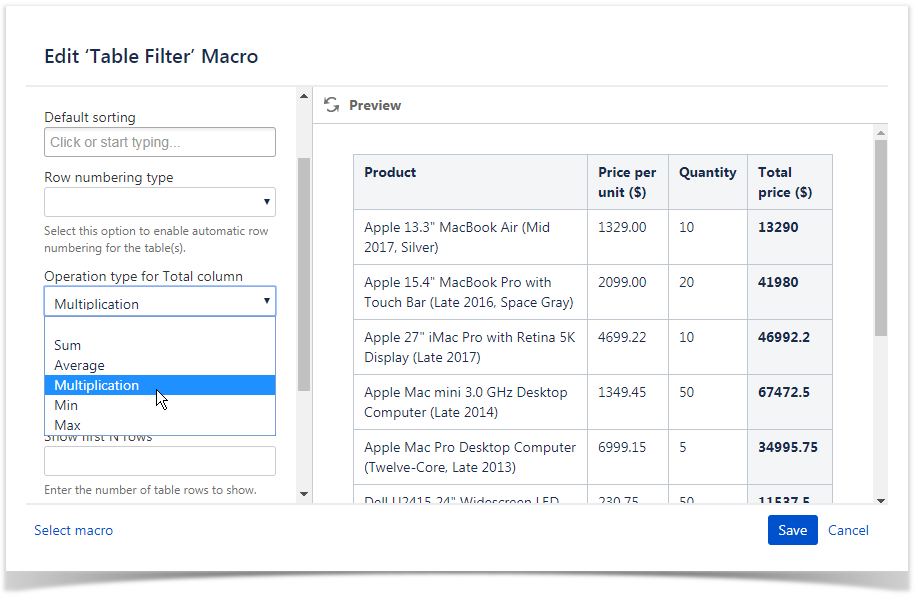
Outputting the Total column
Starting from 3.10.0 version, Table Filter and Charts add-on allows you to output the Total column with the Table Filter macro. The following operations are available:
- Average
- Min
- Max
- Sum
- Multiplication
To enable the Total column for the table:
- Switch the page to edit mode.
- Select the macro and click Edit.
- Switch to the Table View tab.
- Select the operation type for the Total column.
- Save the macro and page.
To rename the Total column:
- Locate the Total column title field.
- Enter the name you want for the Total column.
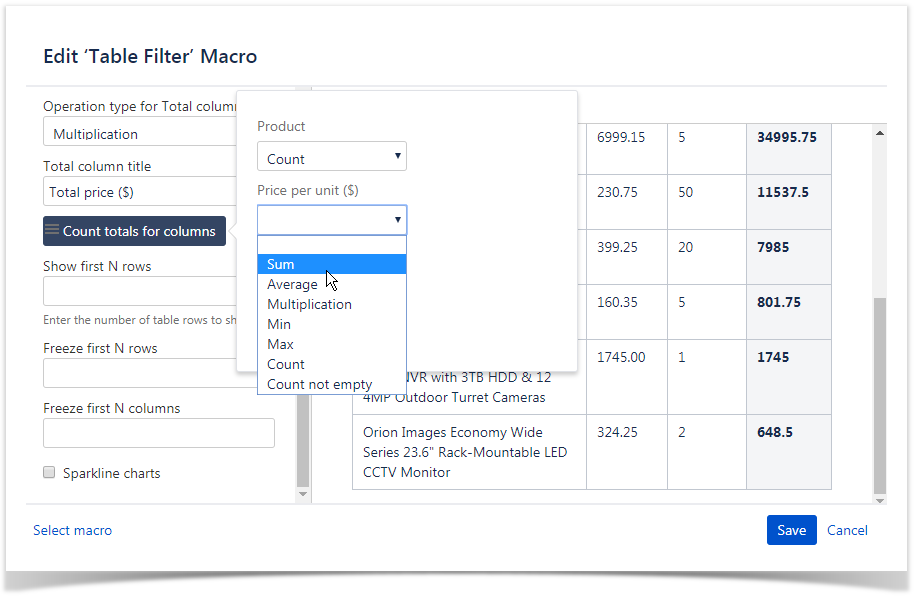
Outputting Totals for columns
The Table Filter and Charts app allows you to count totals for specific columns in your tables. The following operations are available:
- Sum
- Average
- Multiplication
- Min
- Max
- Count
- Count not empty
To enable the totals for a column:
- Switch the page to edit mode.
- Select the macro and click Edit.
- Switch to the Table View tab.
- Click Count totals for columns.
- Select the operation type for specific columns.
- Click Save.
- Save the macro and the page.