Download PDF
Download page Configuring the pivot table.
Configuring the pivot table
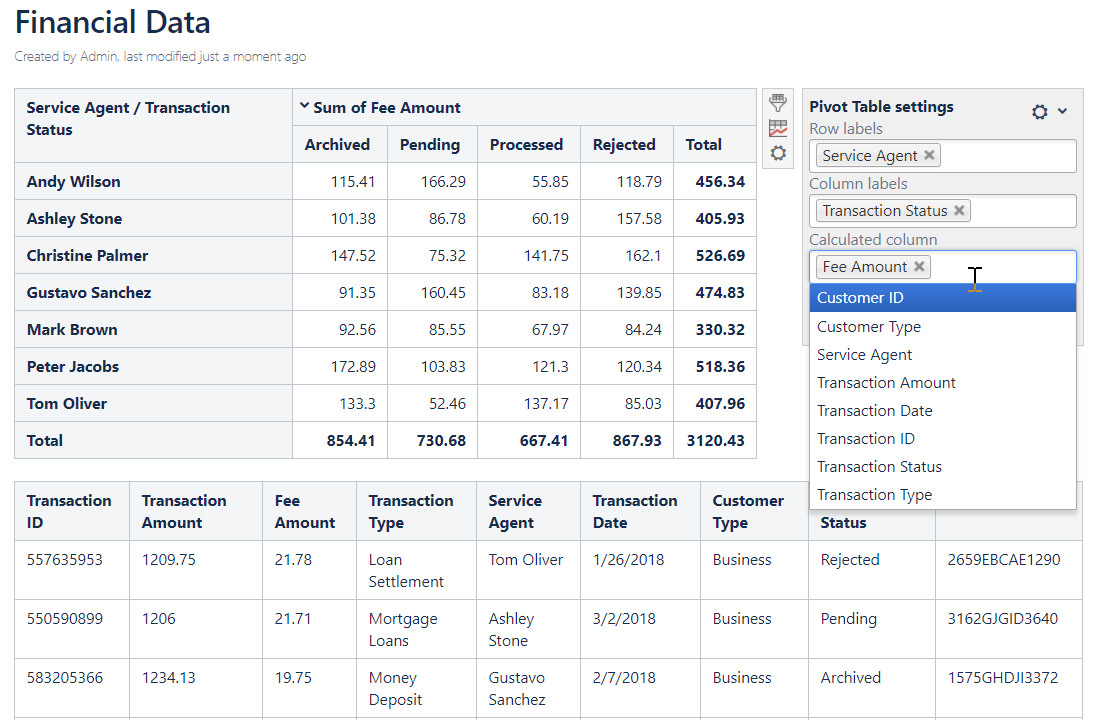
Select data series
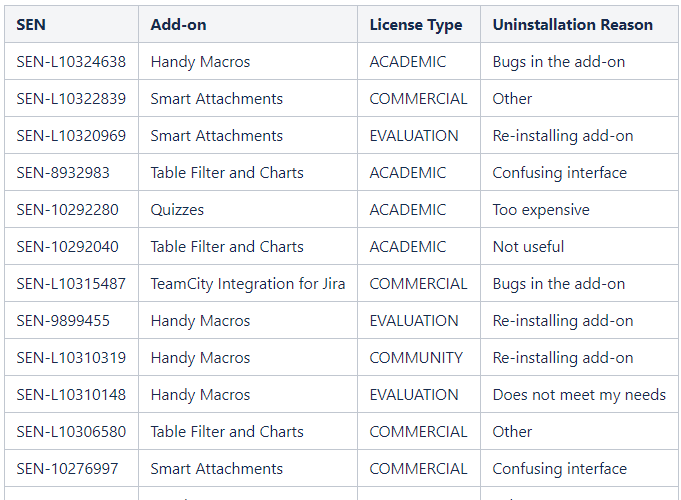
To build a pivot table you need to set the row labels and (or) column labels and select the calculated columns.
Row labels - table columns that will be positioned horizontally in the pivot table.
Column labels - table columns that will be positioned vertically in the pivot table.
Calculated column - table columns that will be calculated or aggregated according to the selected operation type.
To select data series in the page view mode:
- Insert the Pivot Table macro.
- Hover over the control panel on the right of the pivot table.
- Select one or multiple rows and column labels and calculated column.
- To save the modifications in the macro body, click the cogwheel icon and select Save changes .
To select data series in the page edit mode:
- Switch the page to the edit mode.
- Insert the Pivot Table macro and paste the table within the macro body.
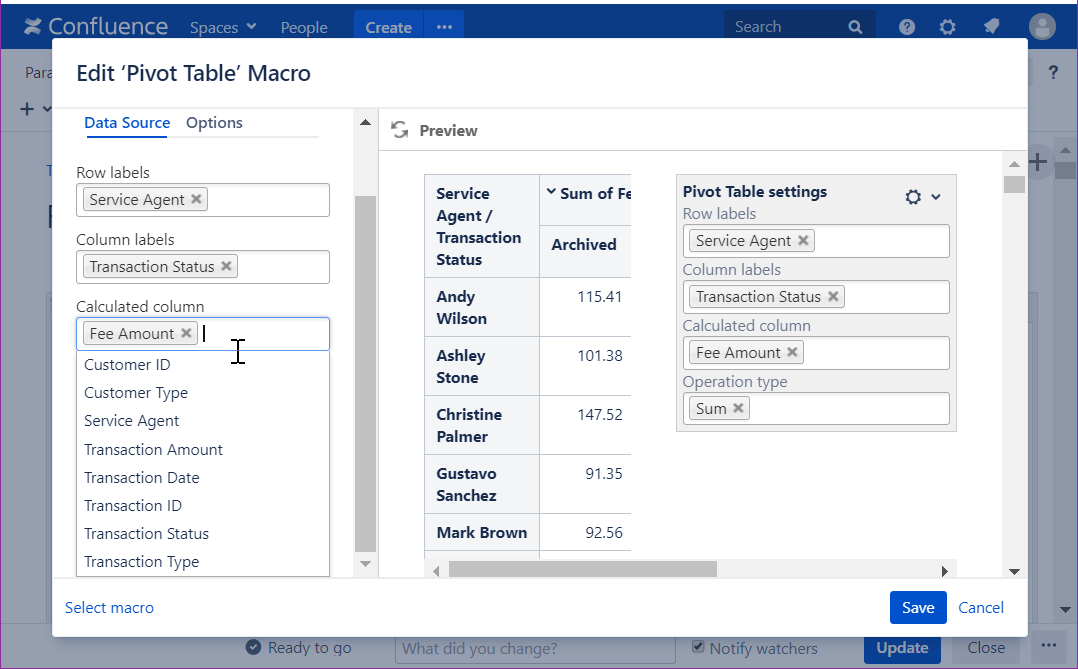
- Select the macro and click Edit.
- Locate the options in the Data source tab and select the table columns containing data for pivot table generation.
- Save the macro and the page.
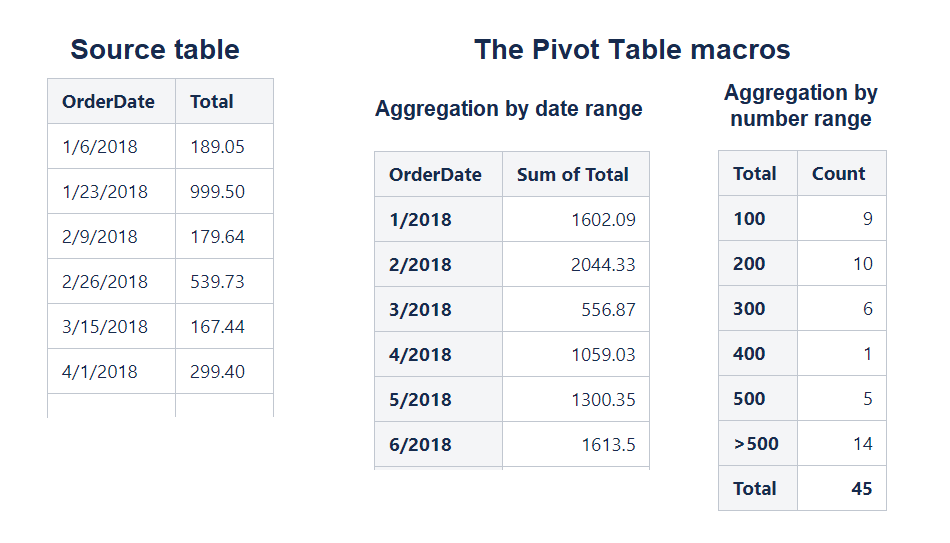
When you select columns containing date or numeric values as the row/column labels you may need to aggregate data by date or number range :
You can generate a pivot table on Worklogs or Time Intervals. Set the correct worklog settings for the correct pivot table generation.
Select operation type
Count
Counts the number of entries in the selected column.
Useful parameters:

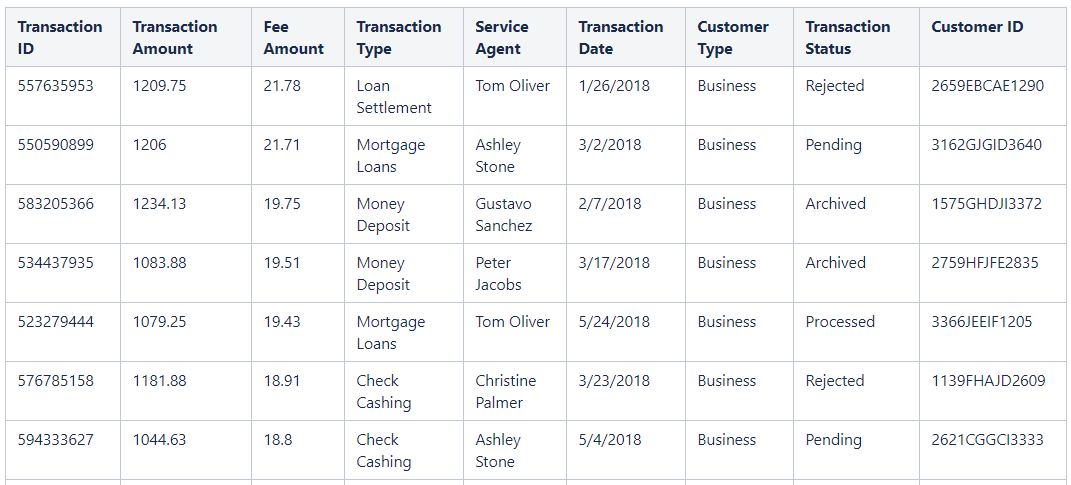
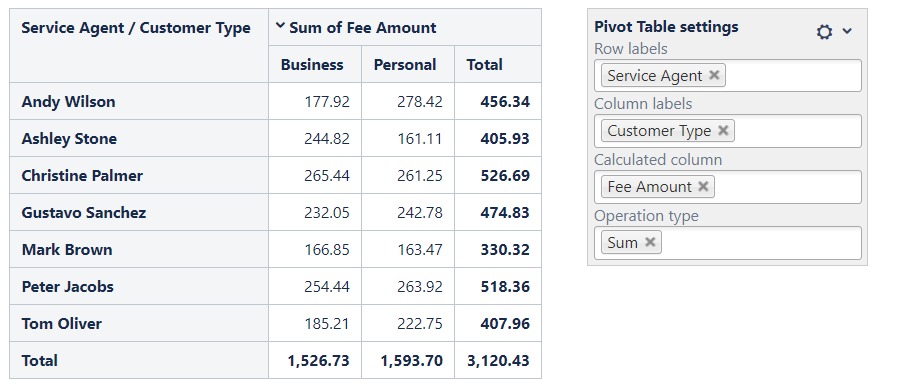
Sum
Sums the numeric values in the selected column.
Useful parameters:

Average
Counts the average values over the values in the selected column.
Useful parameters:


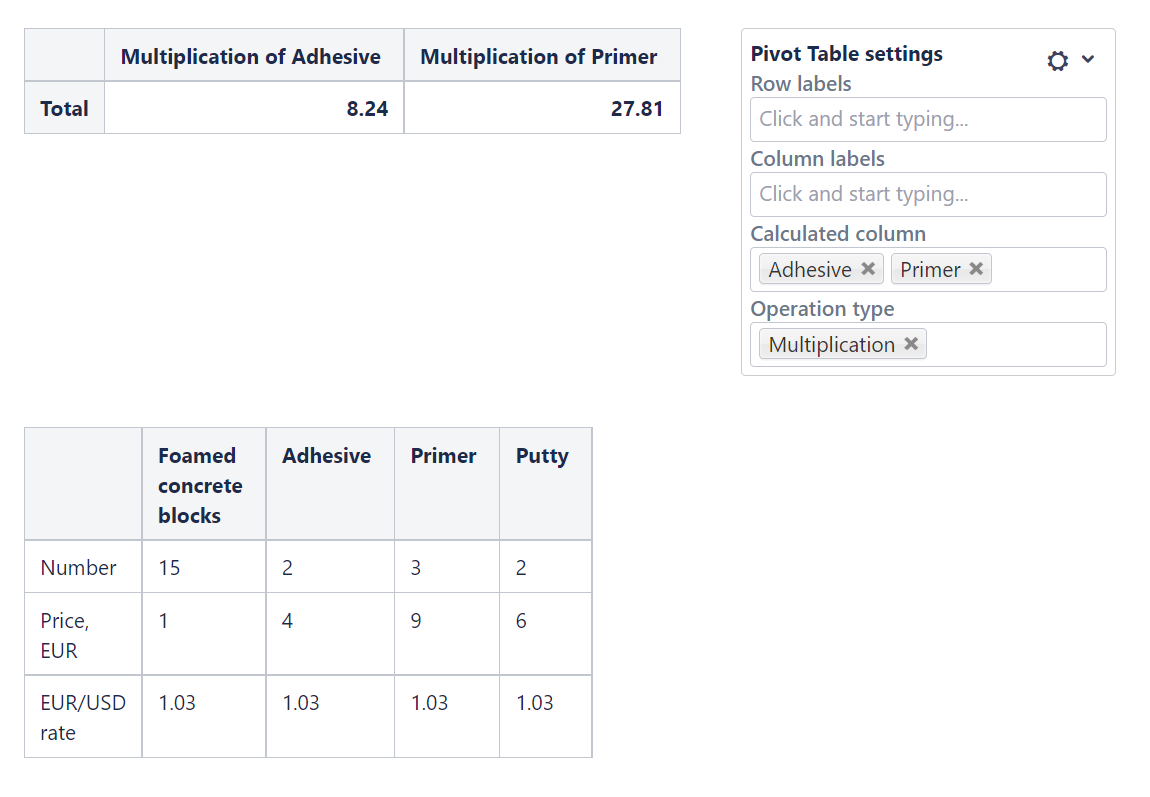
Multiplication
Multiplies the numeric values in the selected column.
Useful parameters:
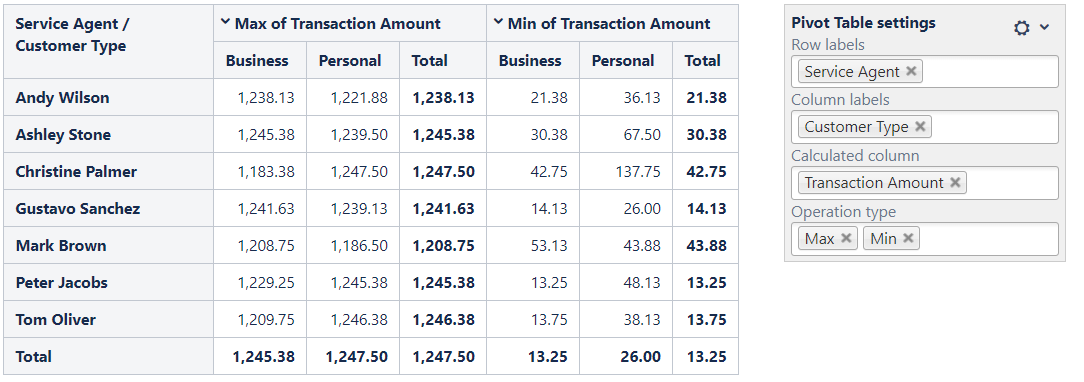
Min / Max
Finds the minimal / maximal value in the selected column.
Useful parameters:

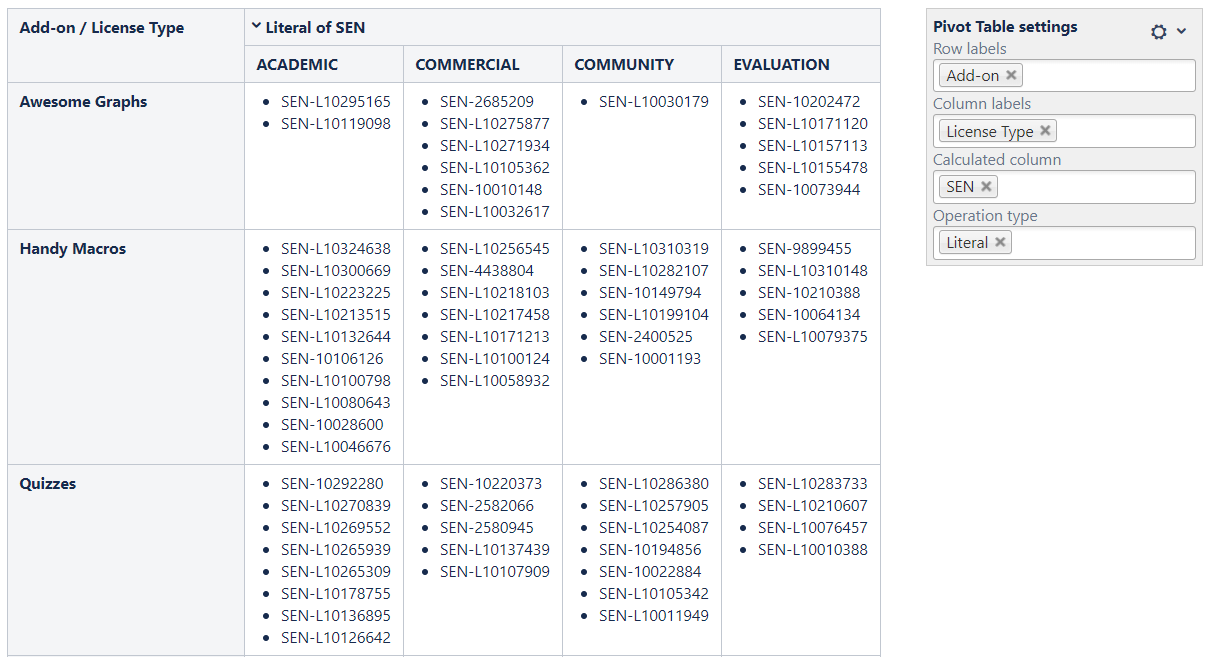
Literal
Outputs the list of unique values matching the selected criteria.
Useful parameters:
