Added Top Committers Report. Improvements in Punchcard and Activity.
New in this release:
A new way to see the summary and dynamics of contributors' commit activity
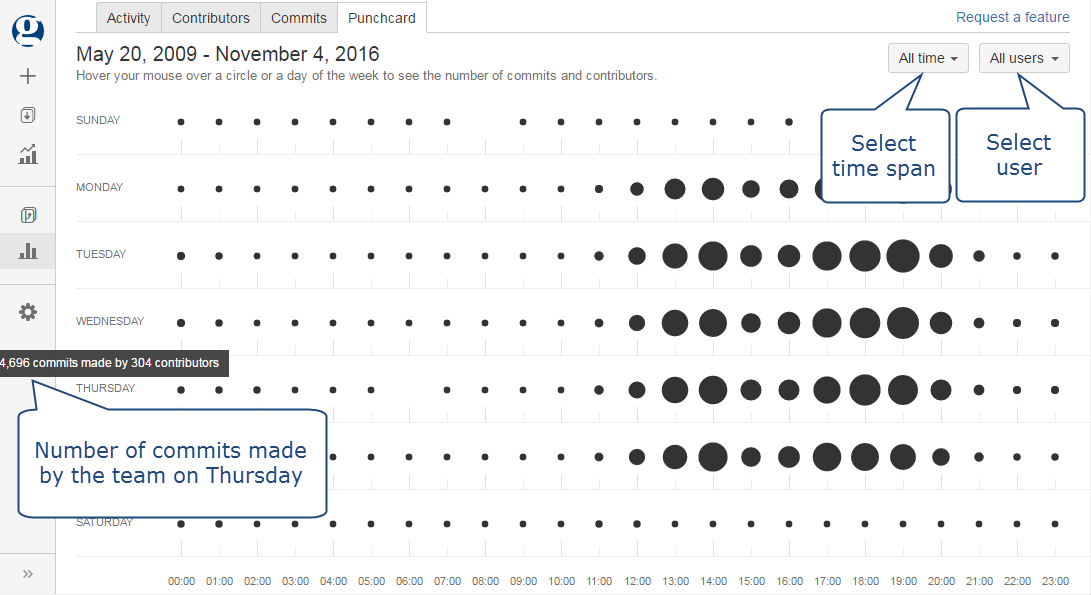
Improvements in Punchcard
Setting a custom time span in Activity
A new way to see the summary and dynamics of contributors' commit activity
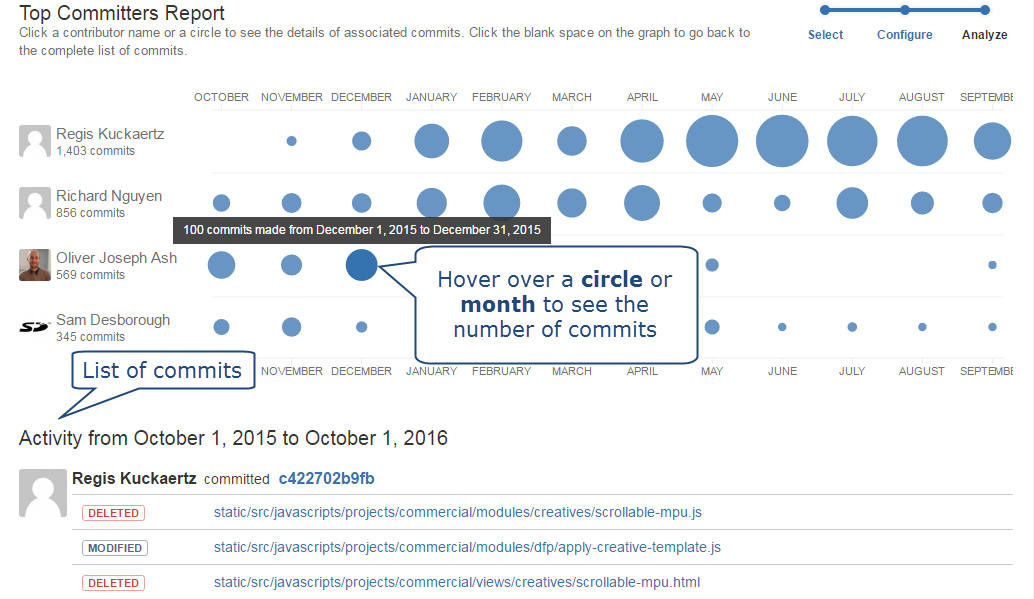
We implemented a new report, Top Committers Report. It provides a punchcard showing how commit activity of selected contributors has been changing over a specified time period. The graph displays commit statistics in a summarized way. A circle can be a day, a week, a month, etc. depending on the length of a chosen time span.
The bigger a circle is the more commits were made. By taking a look at circles associated with a particular developer you can easily see the dynamics of his/her commit activity. And if you compare circles of several people you can analyze what contribution each of them made.
Below the graph there's an activity stream with commit details.
When you hover over a circle or a contributor name, you can see the number of commits associated with that circle or person. And when you click it, the activity stream will get updated and display the details of those commits.
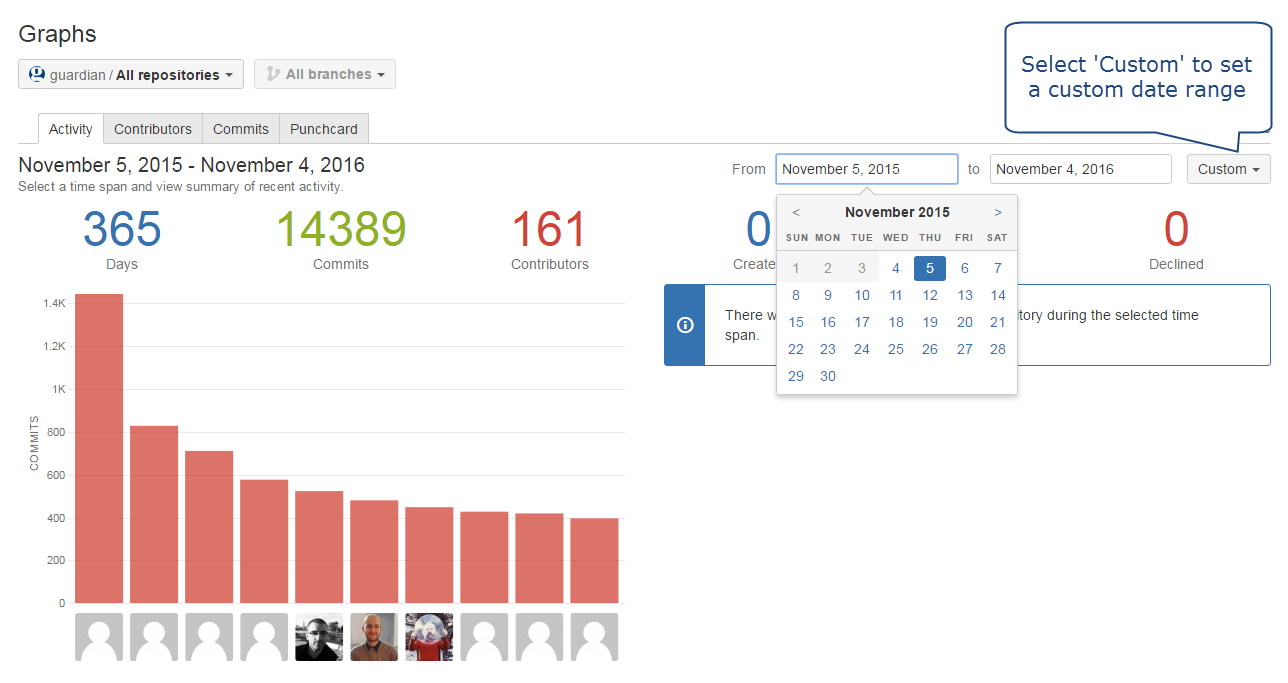
We added a new option in the 'Time Span' filter in Activity - Custom. So now you can view the charts and activity stream for a specific time range within the past year.