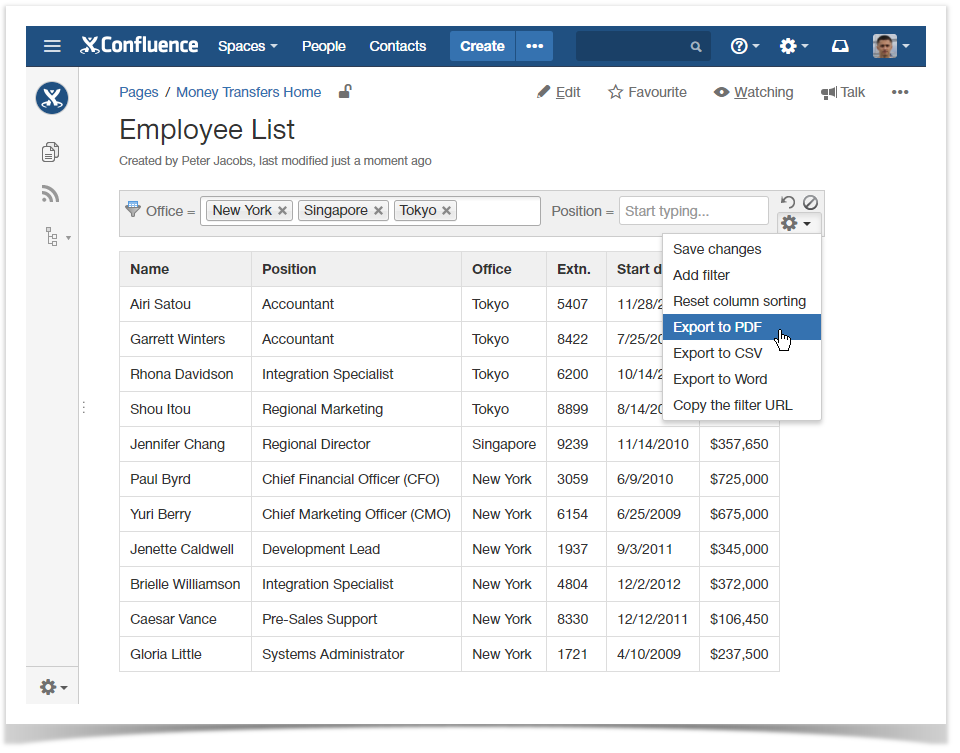
Table Filter and Charts for Confluence add-on allows you to export your filtered and pivot tables to PDF and Word documents in their current view. You can also export your data visualizations as charts or graphs too. In addition, the add-on allows you to export filtered data to CSV (comma delimited values). |
Exporting the Whole Page with Filtered Data/Pivot Tables/Charts
- Apply the required filters to your data table or configure the pivot table or charts.
- From the Tools menu, select either Export to PDF or Export to Word.
- All the information from the page will be exported to a PDF or Word file.
Exporting Filtered Data/Pivot Tables/Charts to Word and PDF
The way of exporting filtered table data, pivot tables or charts is similar in all the macros bundled within Table Filter and Charts add-on.
- Open the page with filtered table data, a pivot table or a chart.
- On the filtration or management pane, locate the cogwheel icon and click it.
- Click Export to PDF or Export to Word.
- Save the file to your local computer for opening.

Exporting Filtered Data to CSV
Starting from Table Filter and Charts 3.8.0, you can export filtered data to CSV files.
To export filtered data to CSV:
- Open the page with the table.
- Apply the necessary filters.
- On the filtration pane, click the cogwheel icon.
- Select Export to CSV.
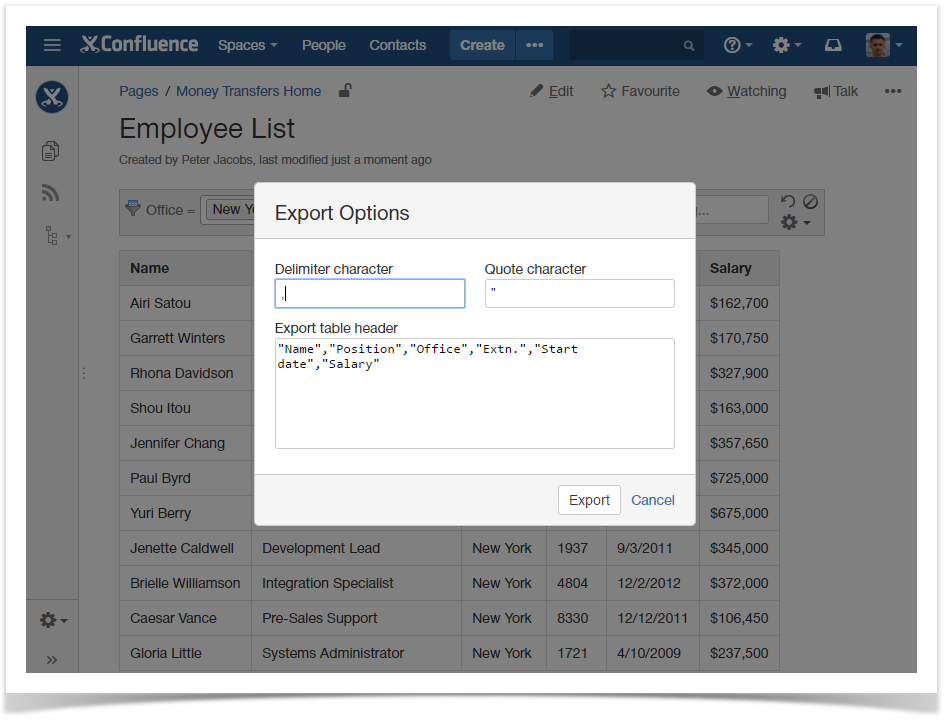
- In the Export Options form, specify the correct value delimiter and quote character.
- In the Export table header box, you can update or delete the table header in the CSV file before export.
- Click Export.
- Save the file to your local computer for opening.
