Table Filter macro
![]()
Pivot Table macro
![]()
Chart from Table macro
![]()
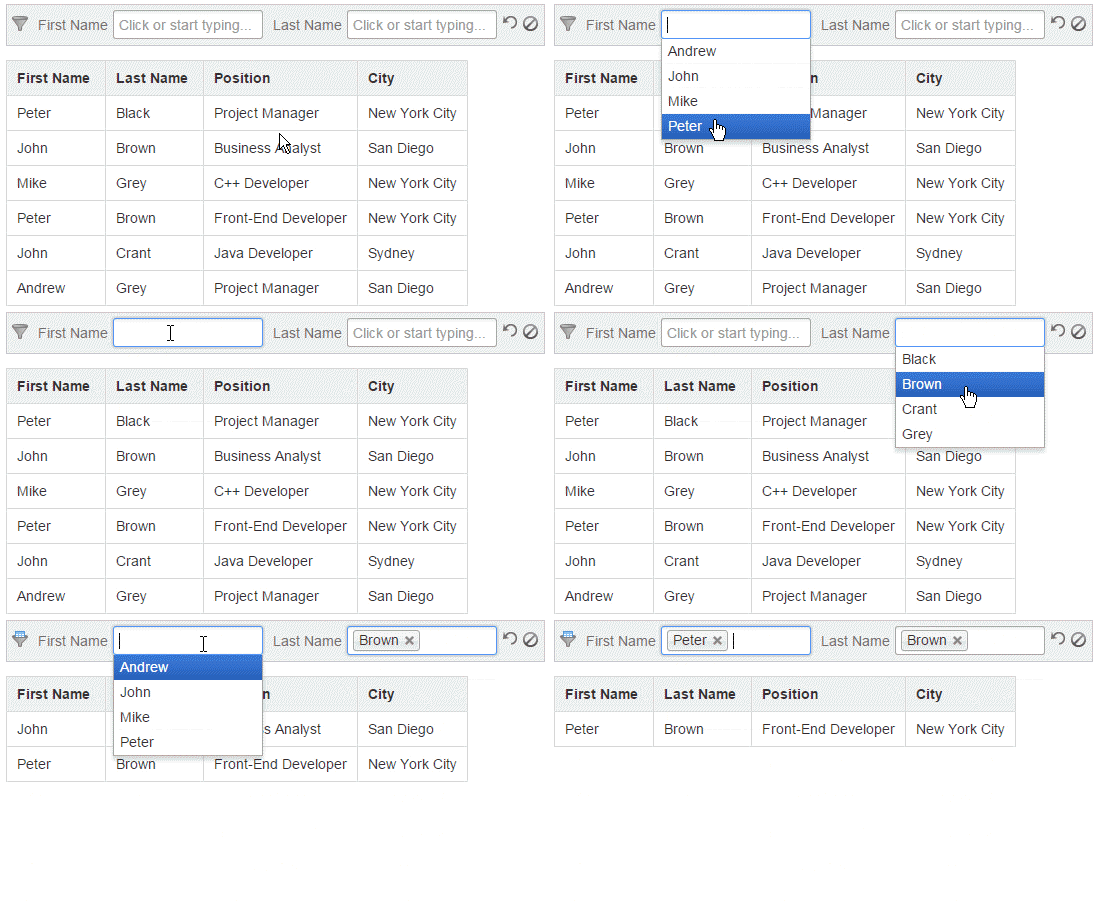
Filtering one or multiple columns by value selection
Use the drop-down filters for manual selection of values for table filtration. Filter several table columns at once with no limitations. Learn more.
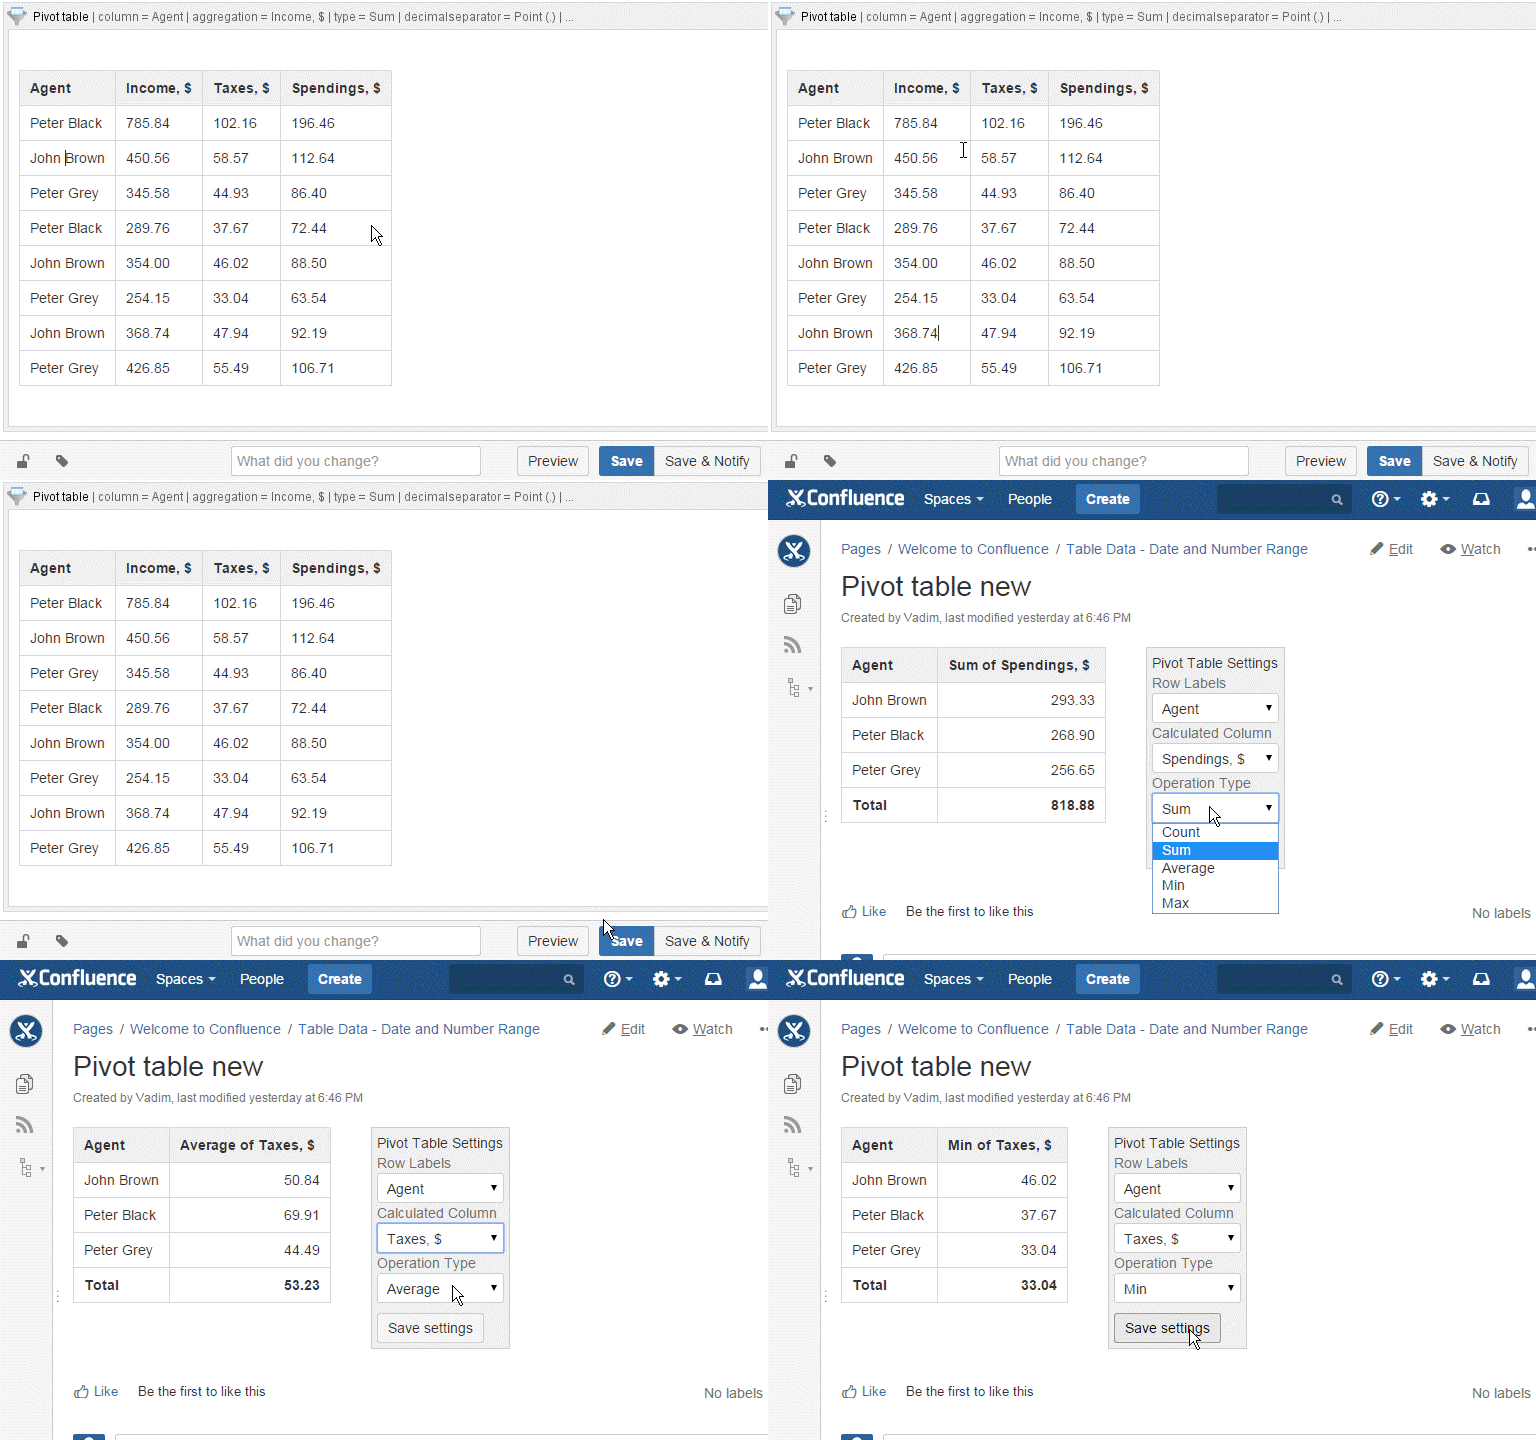
Creating a pivot table
Create pivot tables with automatic summarization and aggregation of data values from the source data table. Use the available operation types for instant data calculation. Learn more.
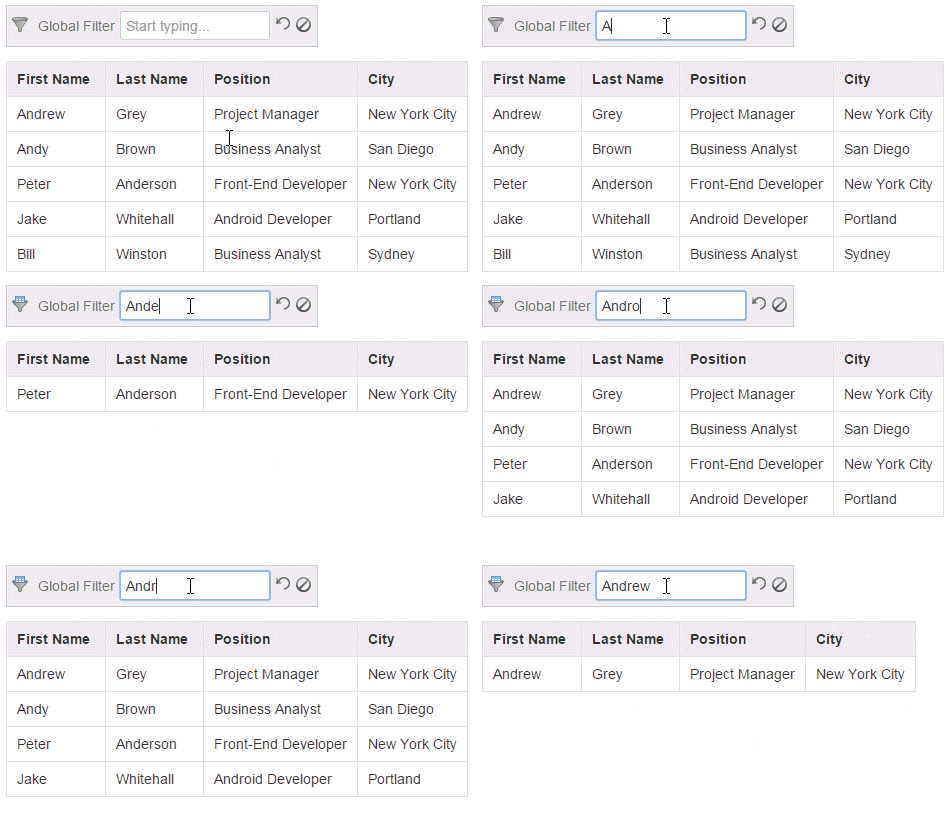
Filtering data throughout the table
Use the global filter to instantly filter all the table data and get only table results matching your query. Learn more.
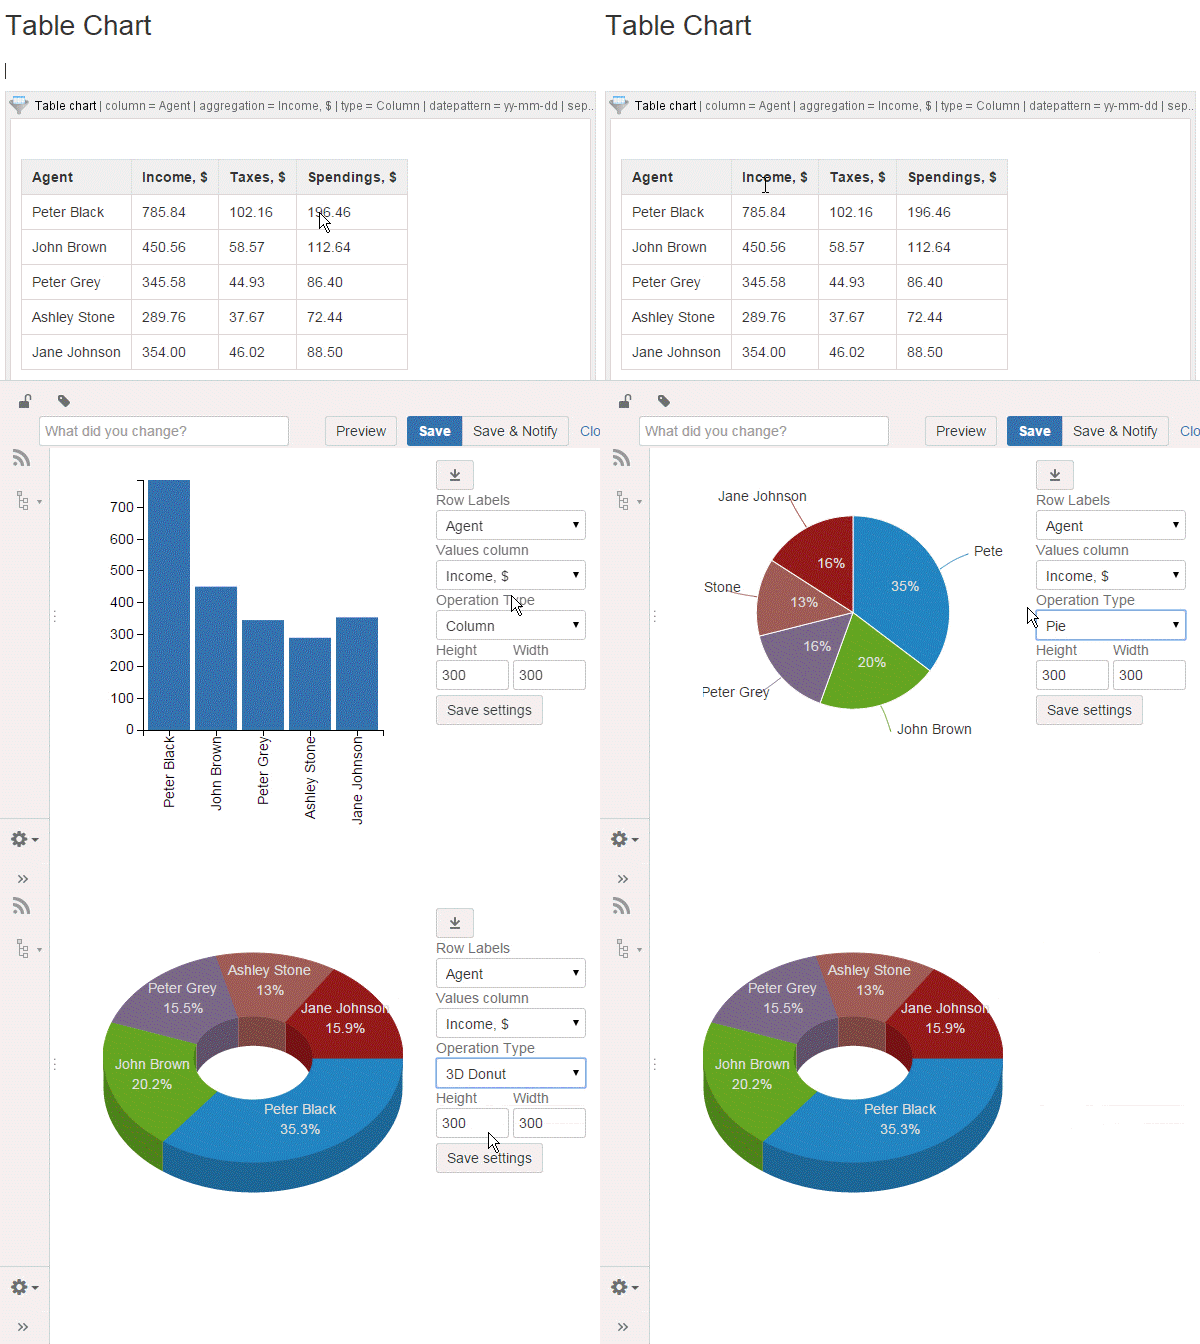
Creating dynamic charts
Generate visual-appealing charts and graphs from your table data with their automatic update upon each filtration or data change. Learn more.
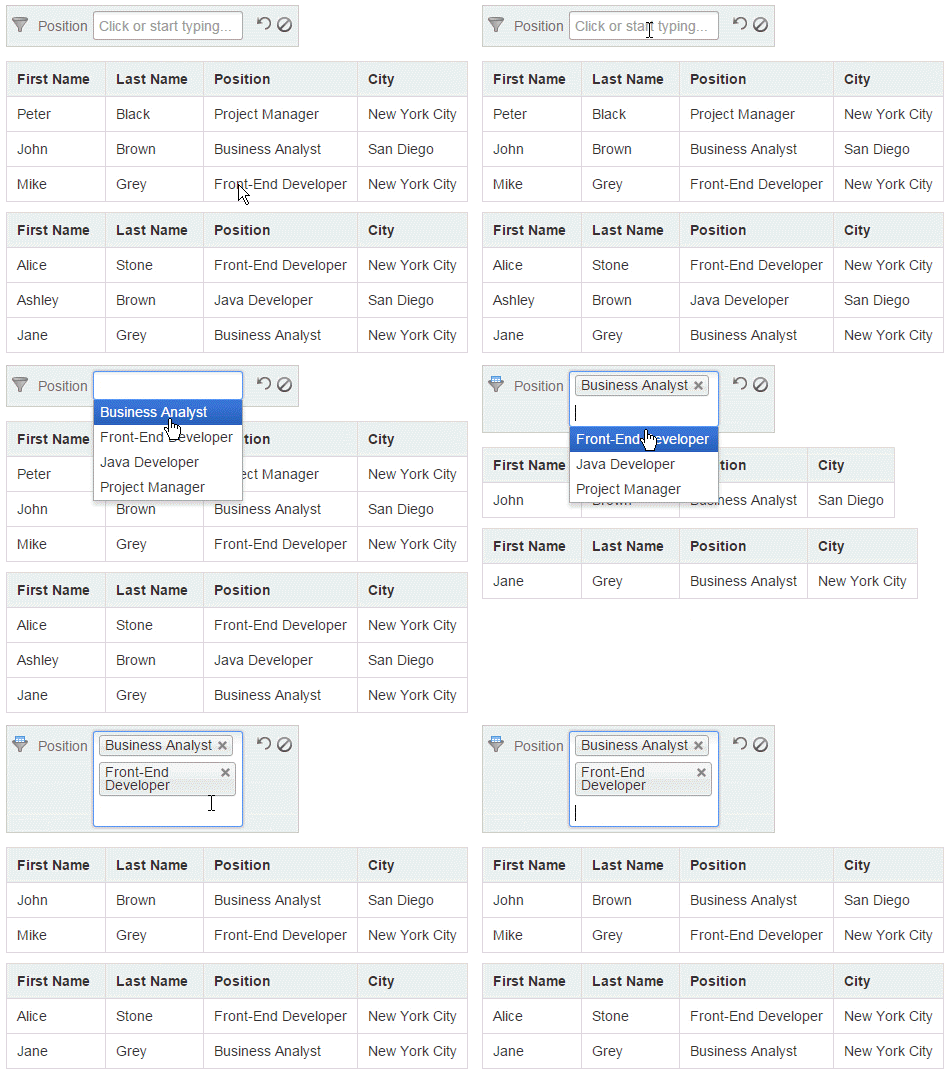
Filtering multiple tables at once
Filter multiple tables at once. Just place several tables into the Table filter macro and get filtered results in all tables. Learn more.
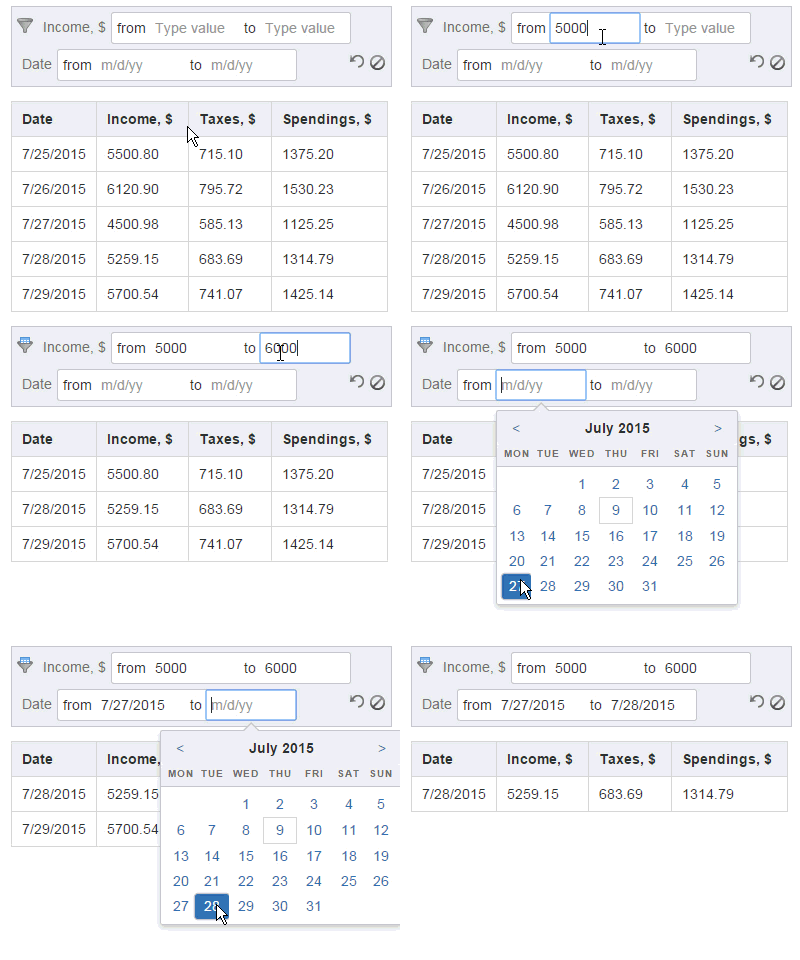
Filtering by date and number range
Filter your table data by data and number ranges. Select the appropriate data formats and enter the necessary ranges for filtration. Learn more.
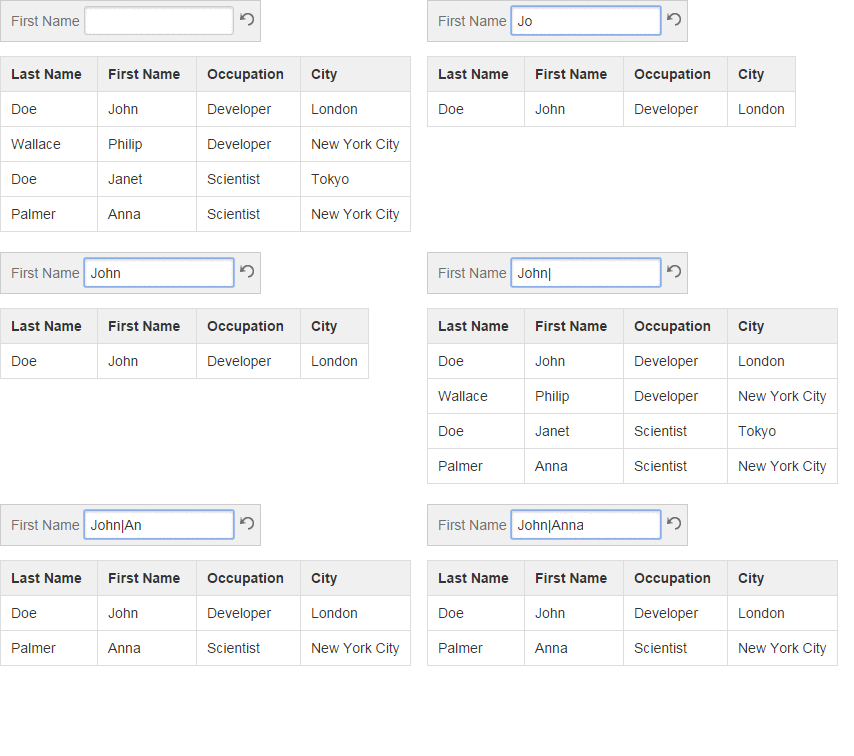
Filtering by a keyword
Use the free-text filters for entering some filter queries with support for regular expressions. Learn more.
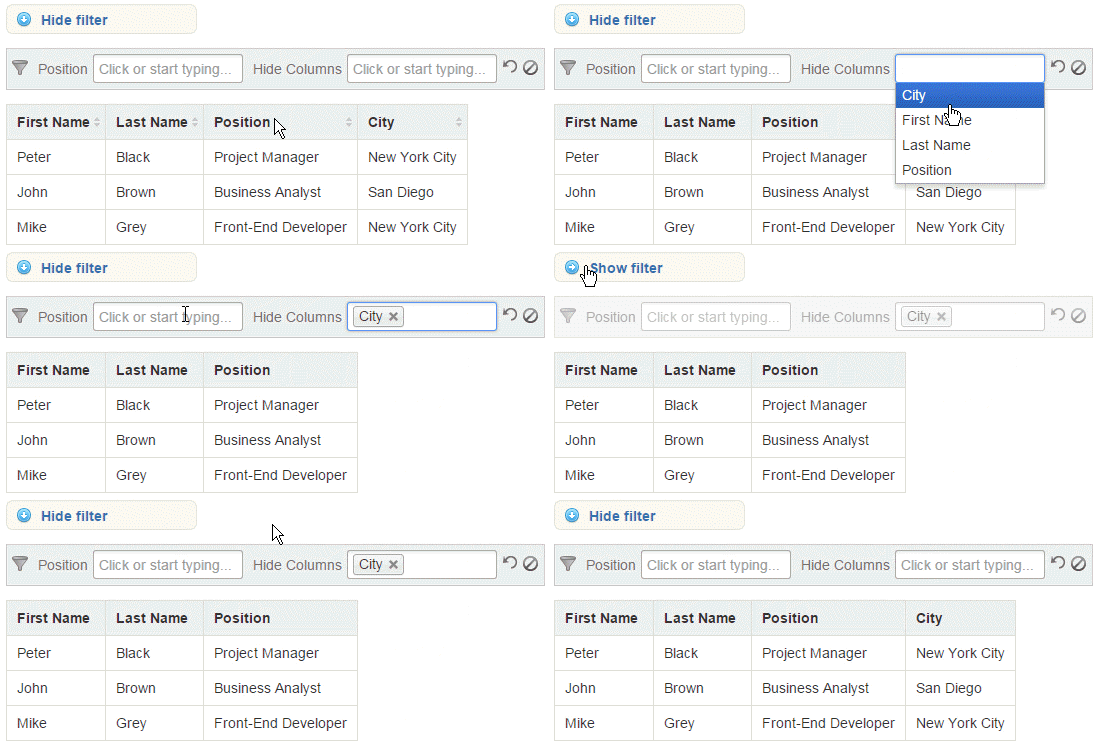
Hiding the pane with filters and table columns
Hide or show the filtration pane or the appropriate columns in the table when needed. Learn more.
