This version of the app's documentation is outdated. Please find the information you're looking for here:


Visualizing of Completed Story Points by Teams


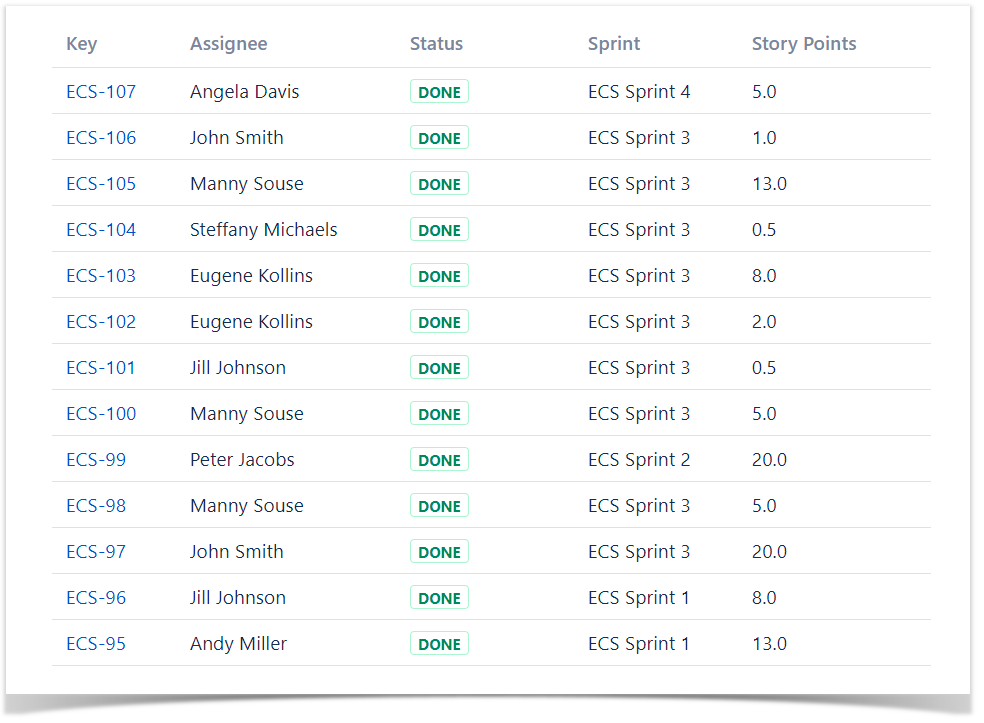
The Source Table:

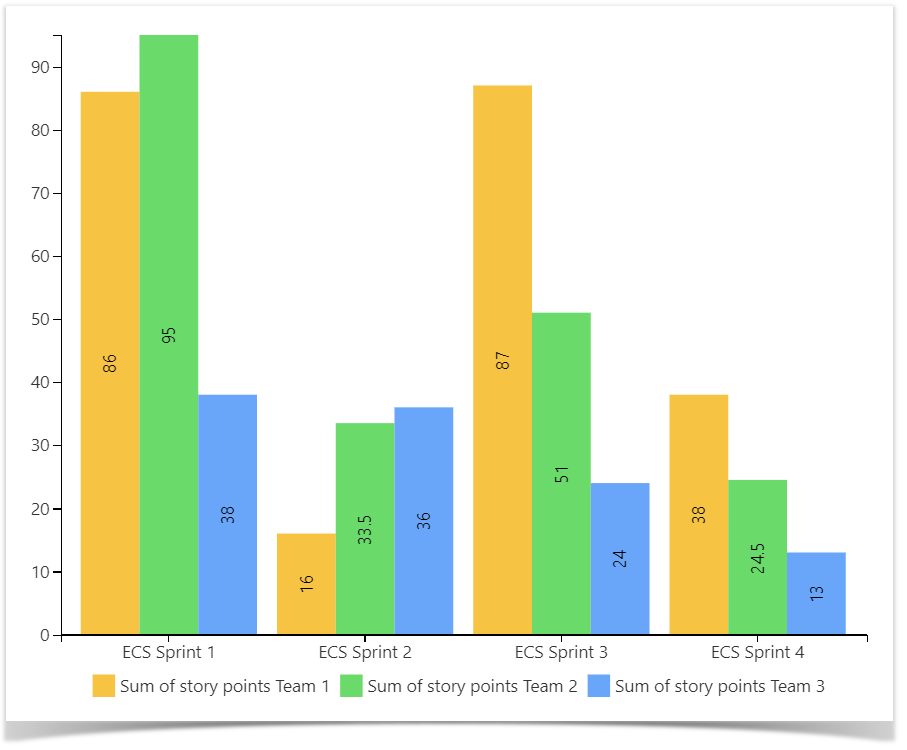
The Result:


Macro combination:

  1. Insert the Jira Issues macro.
  2. Add a table containing additional information for merging. (info)
  3. Wrap the Table Filter macro and the table containing additional information in the Table Transformer macro.
  4. Wrap the Table Transformer macro in the Table Filter macro.
  5. Wrap the Table Transformer macro in the Pivot Table macro.
  6. Wrap the Pivot Table macro in the Chart from Table macro.

You can include any table from your Confluence instance using the Table Excerpt and Table Excerpt Include macros.


Macro configuration:

Table Filter:

Filter ColumnStatusSprint
Filter TypeDropdownDropdown
Filter ValuesDoneReversed filter: '-empty-'

Table Transformer:

Select the default Lookup tables preset and a column for matching the records. (info)

If the columns for matching have different labels in multiple tables, use the query from the example.

Pivot Table:

Row LabelsSprint
Column LabelsTeam
Calculated ColumnStory points
Operation TypeSum

Chart from Table:

TypeColumn
Labels ColumnSprint
Values ColumnSum of story points Team 1, Sum of story points Team 2, Sum of story points Team 3