|
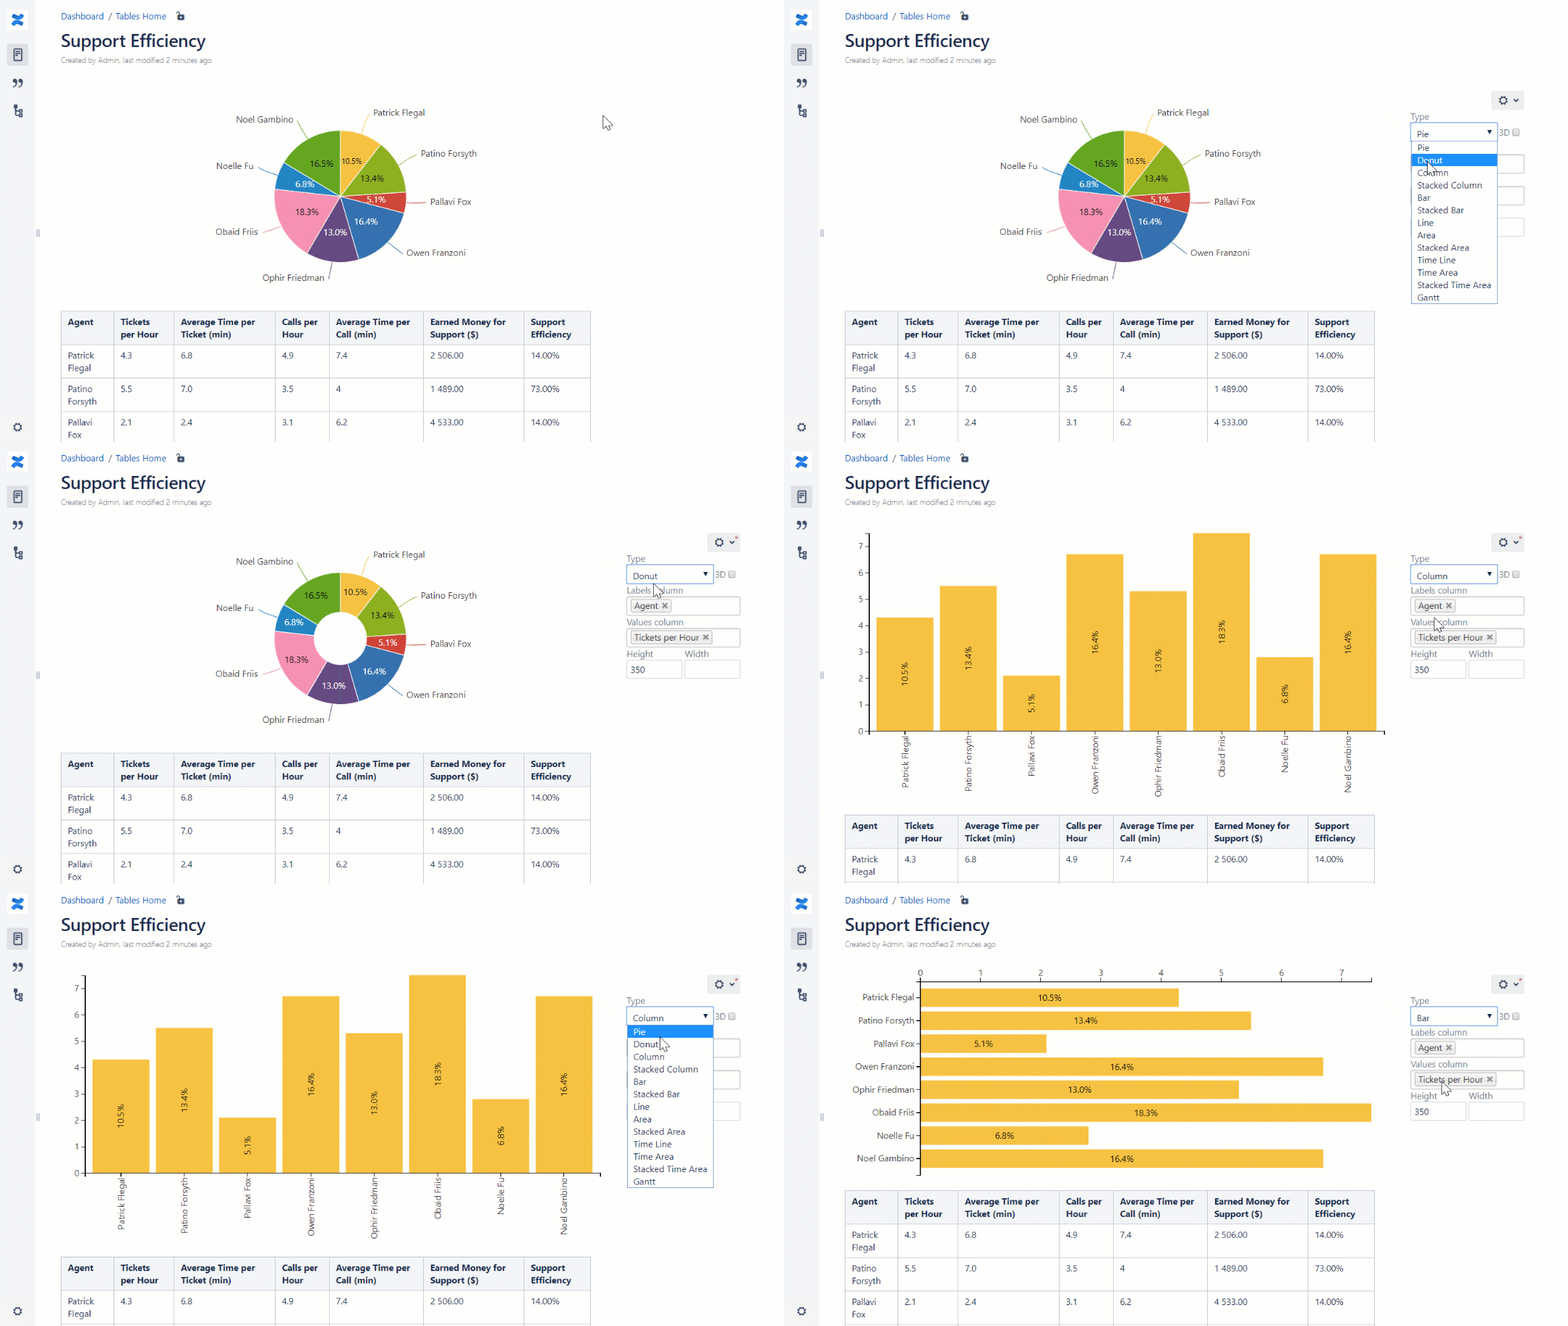
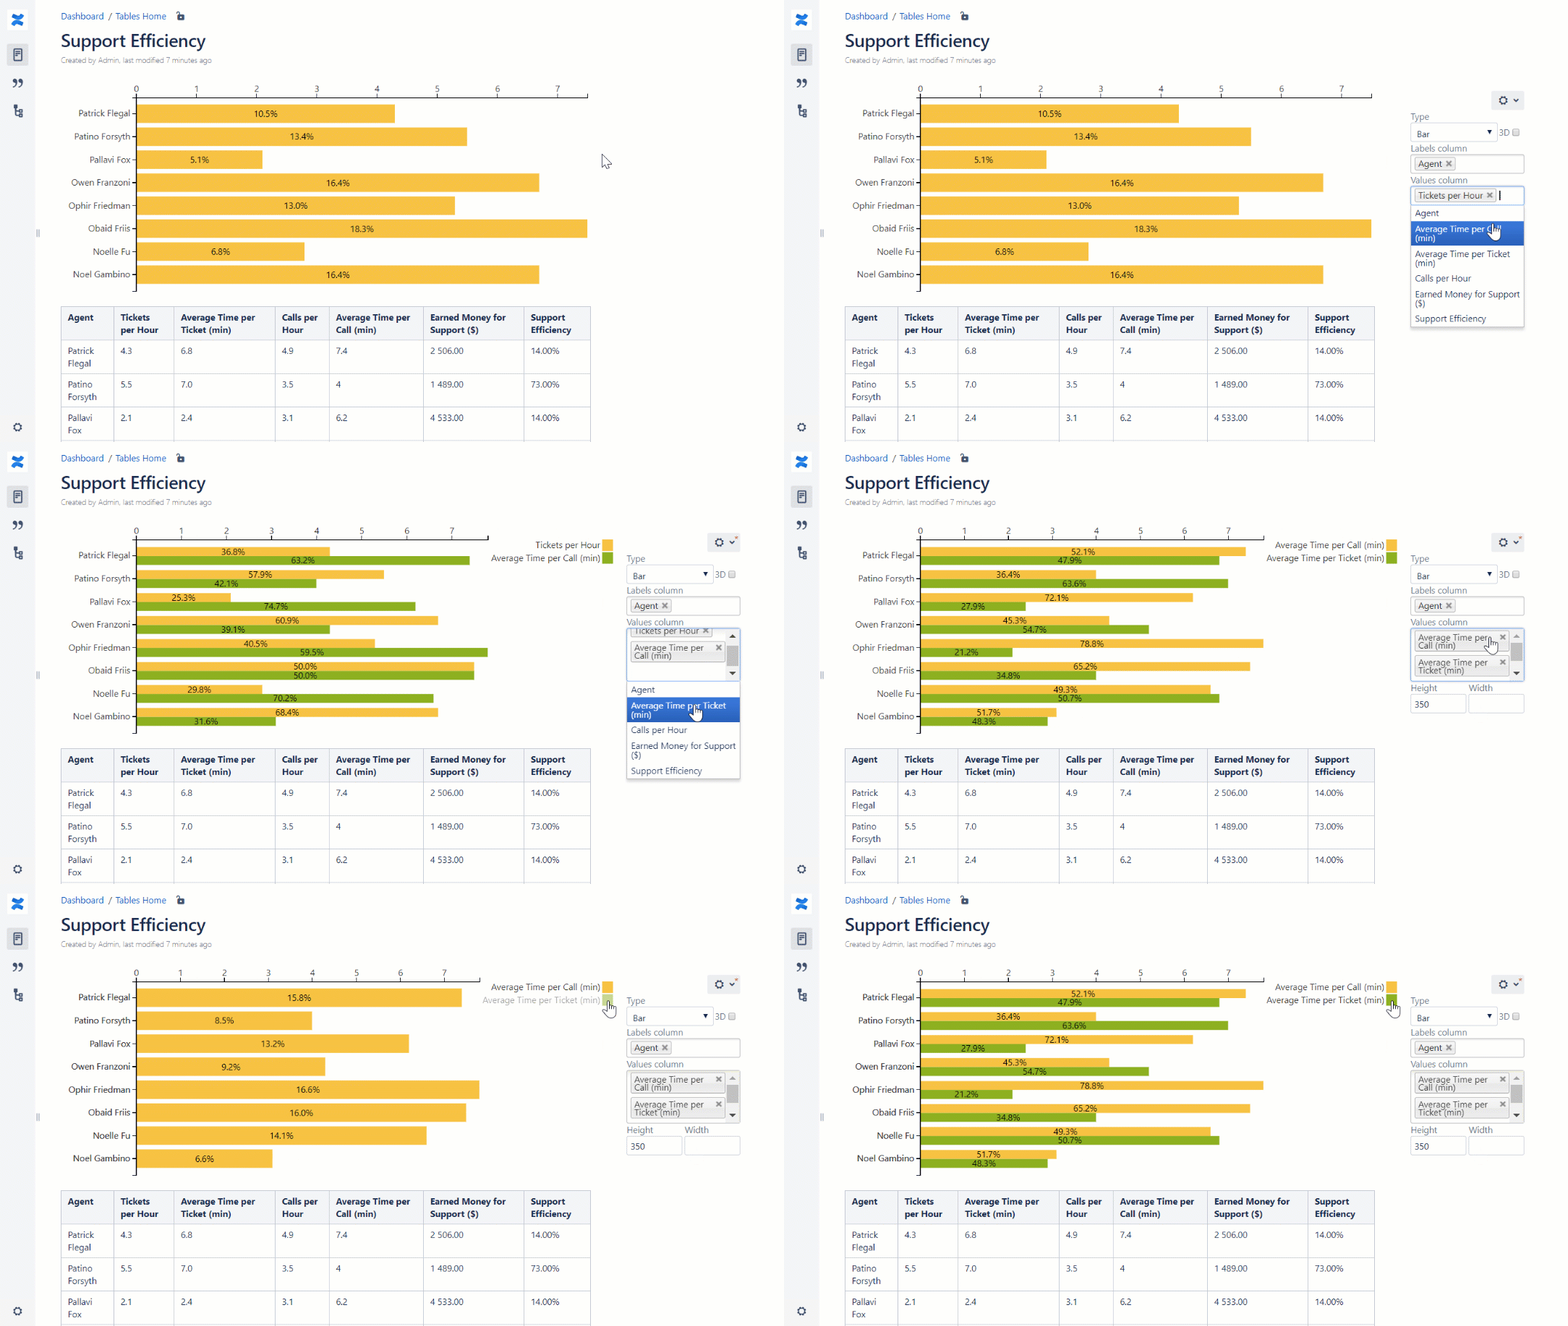
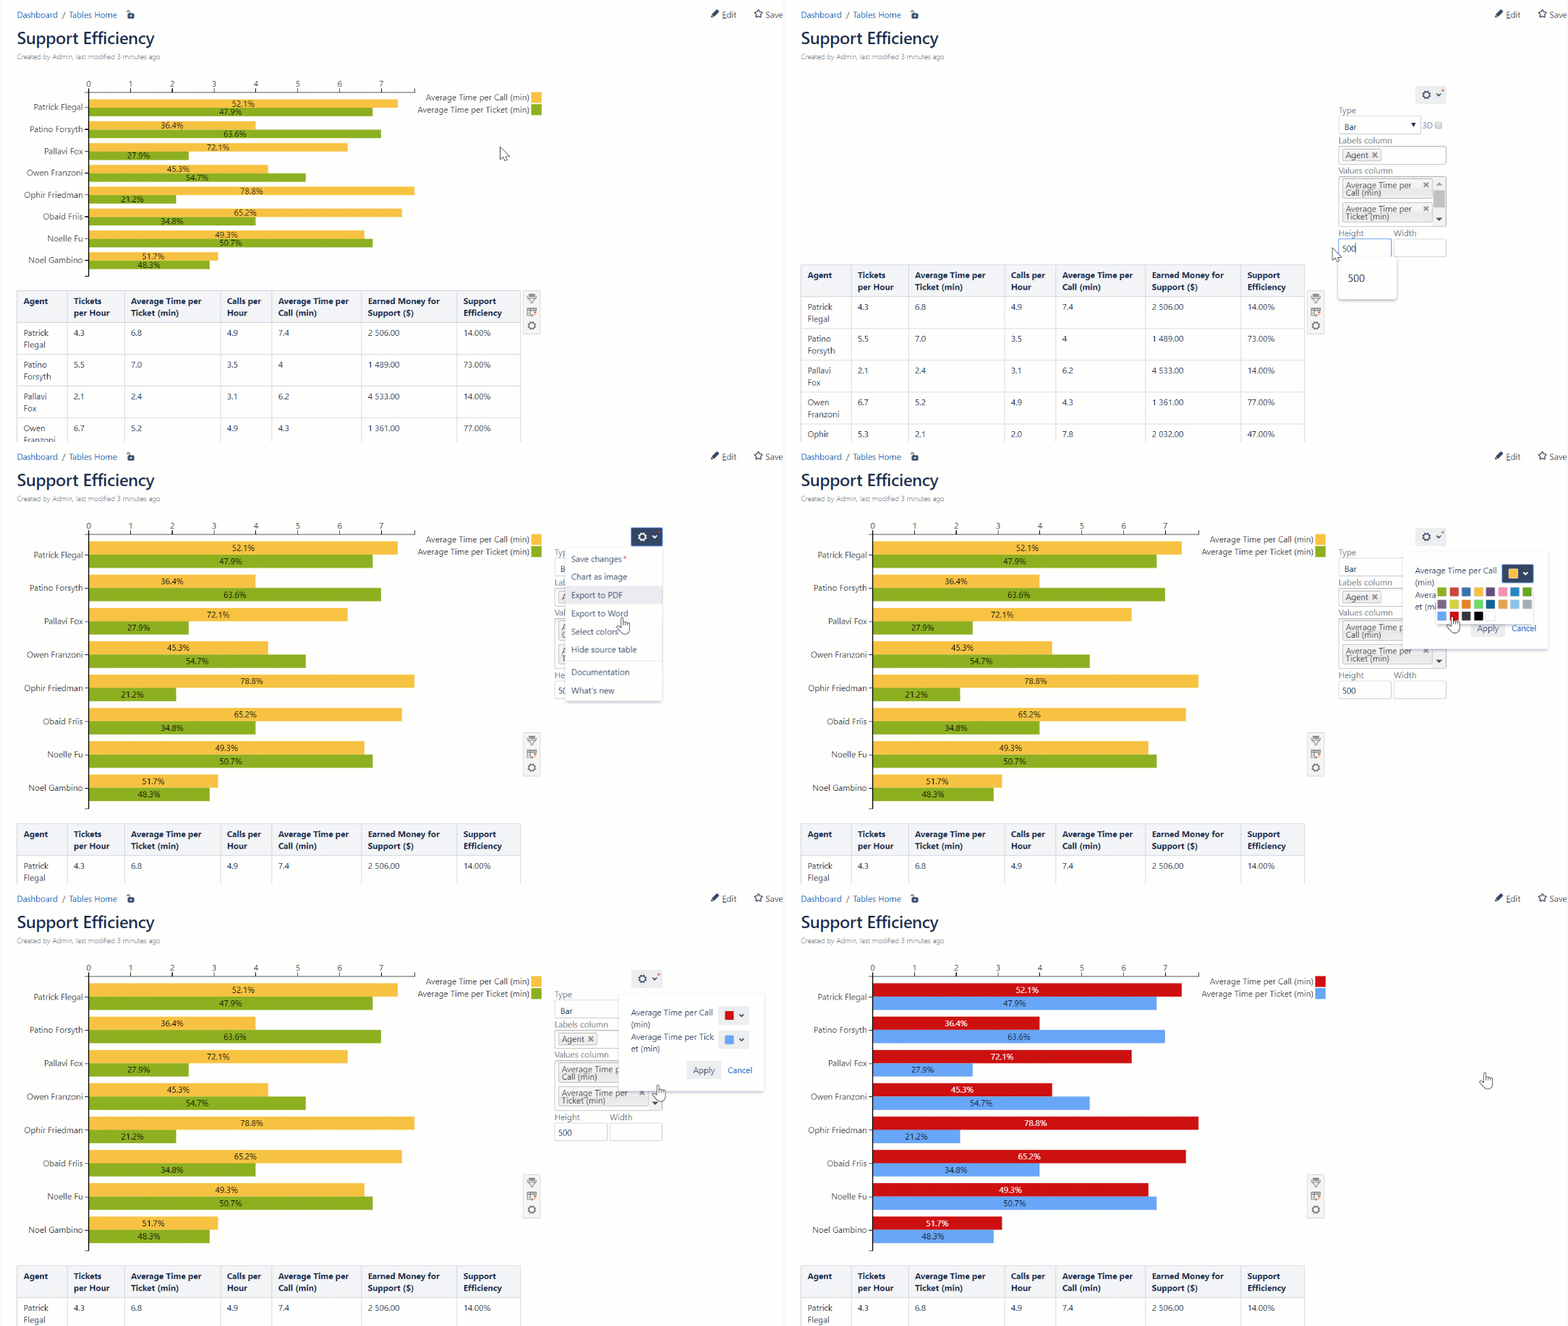
Chart from Table is one of the macros bundled in the Table Filter, Charts & Spreadsheets app. The macro allows you to visualize your table data and create dynamic charts that you can configure and update on the fly while viewing Confluence pages:
Add Chart from Table on the page
|
|
|
|
Find the answer to your question among the related FAQ
|

