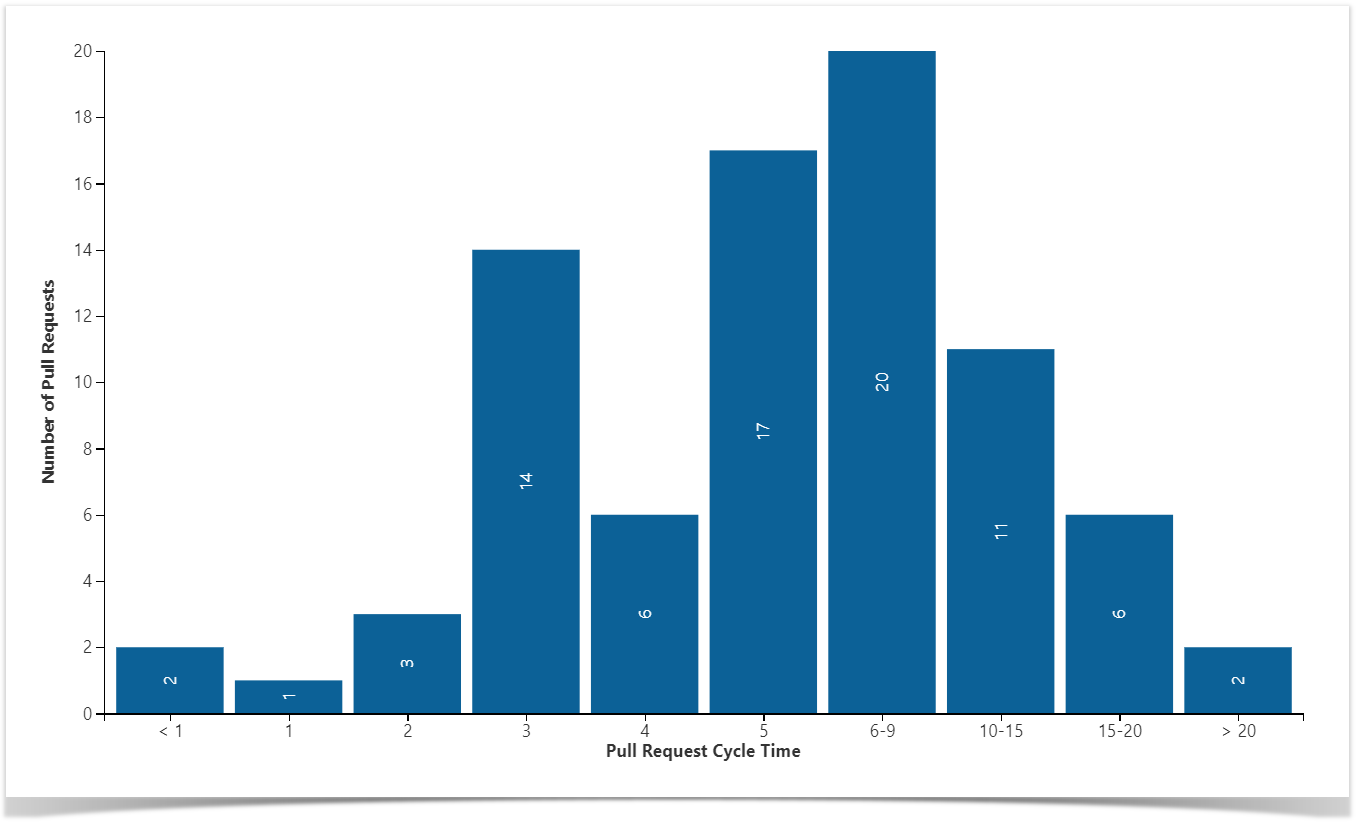
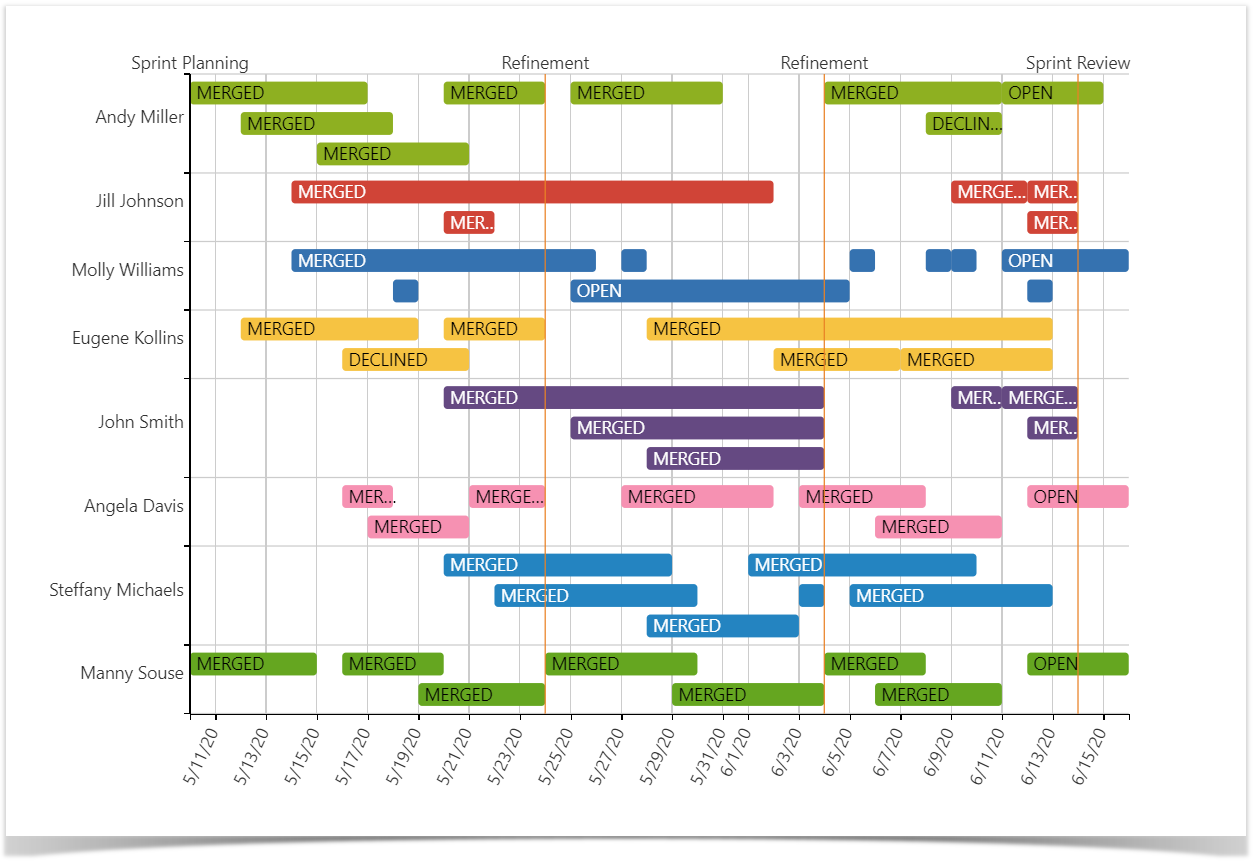
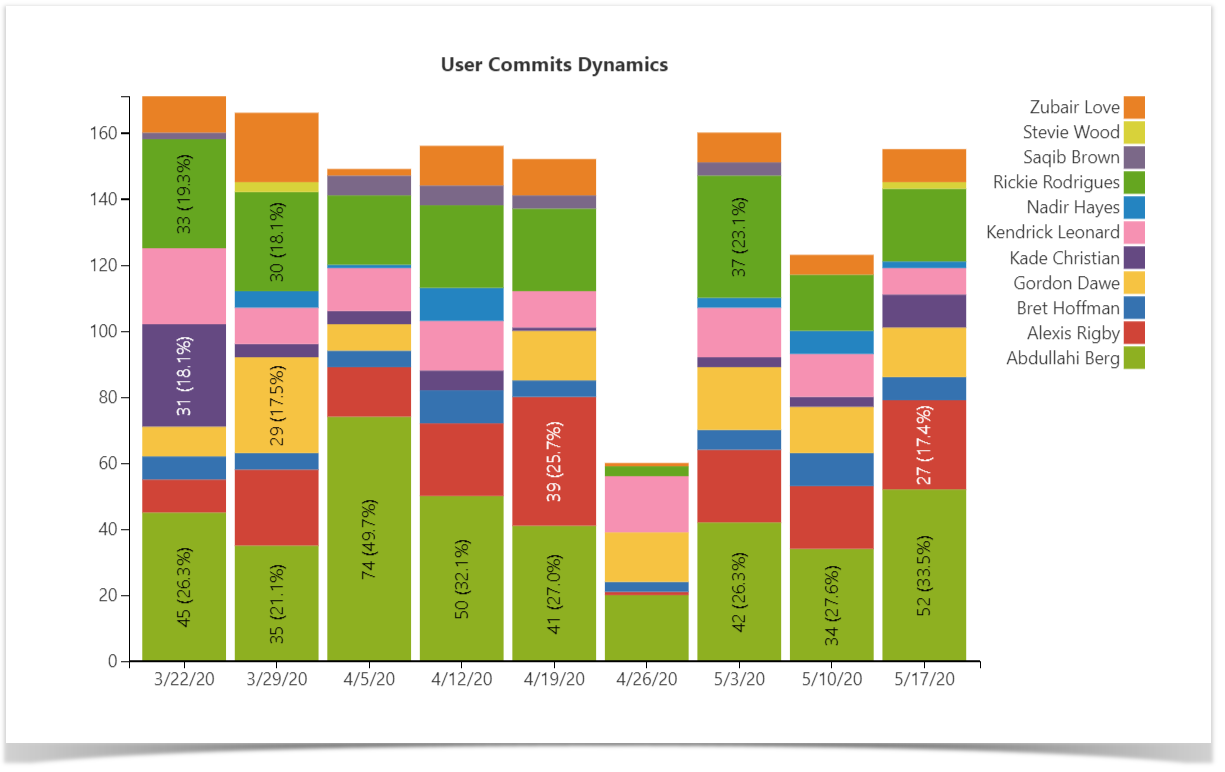
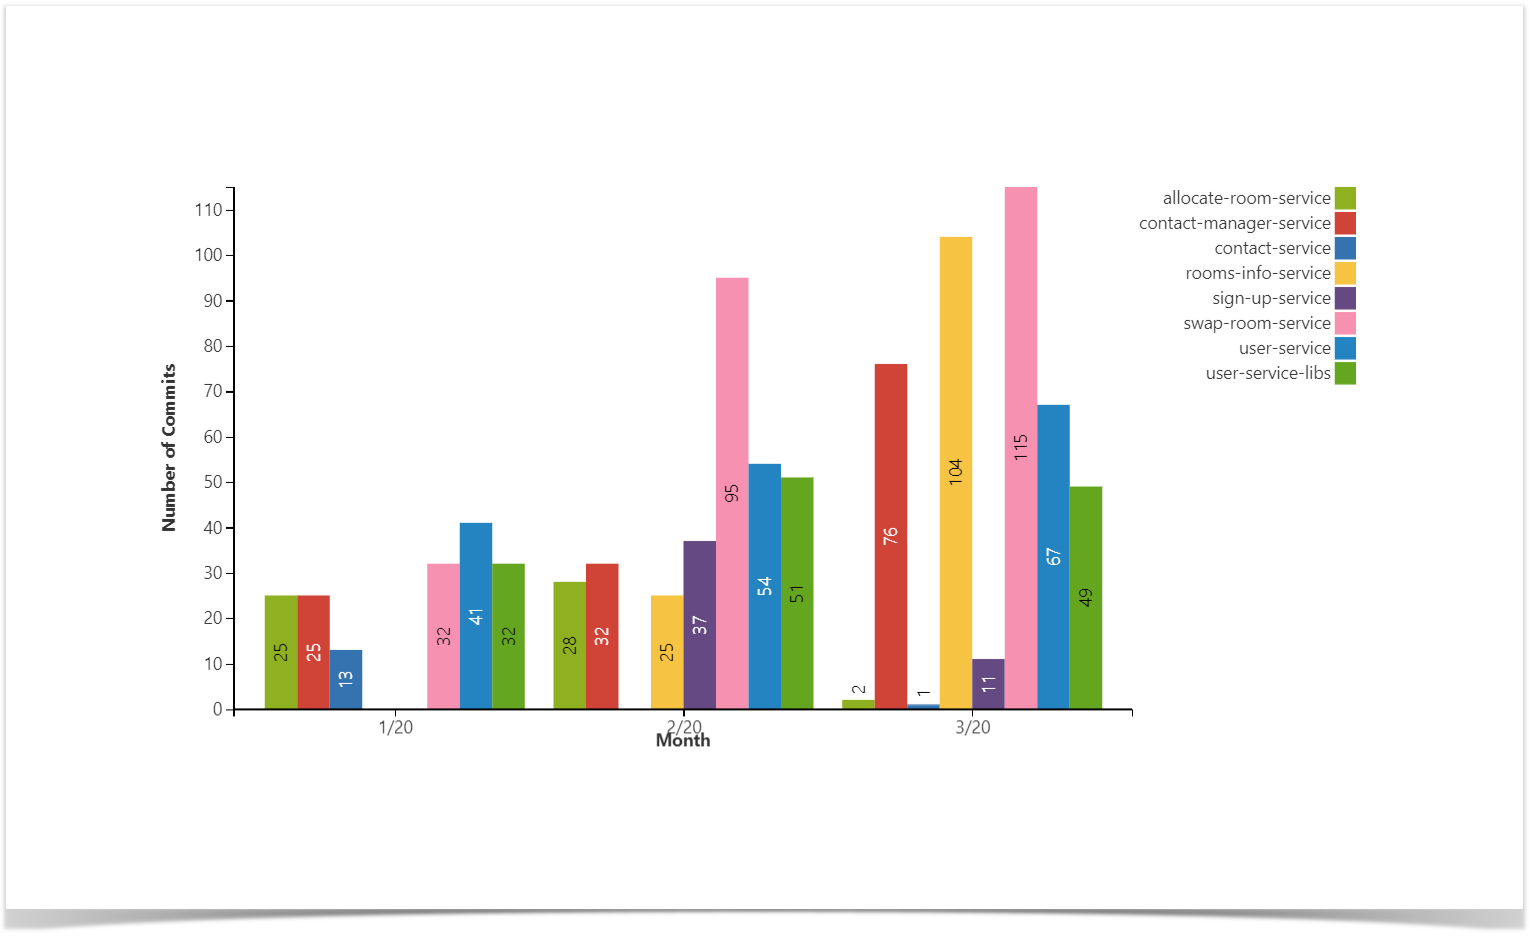
Awesome Graphs for Bitbucket gives you the capability to export raw data with the statistics across all projects and repositories to a CSV file by using the Export to CSV feature. As a result, you will get the list of the commits or pull requests made during the selected time span with their details. The resulting CSV file can be further exported into Confluence and transformed into a table using Table Filter, Charts & Spreadsheets' Table from CSV macro . |
|
