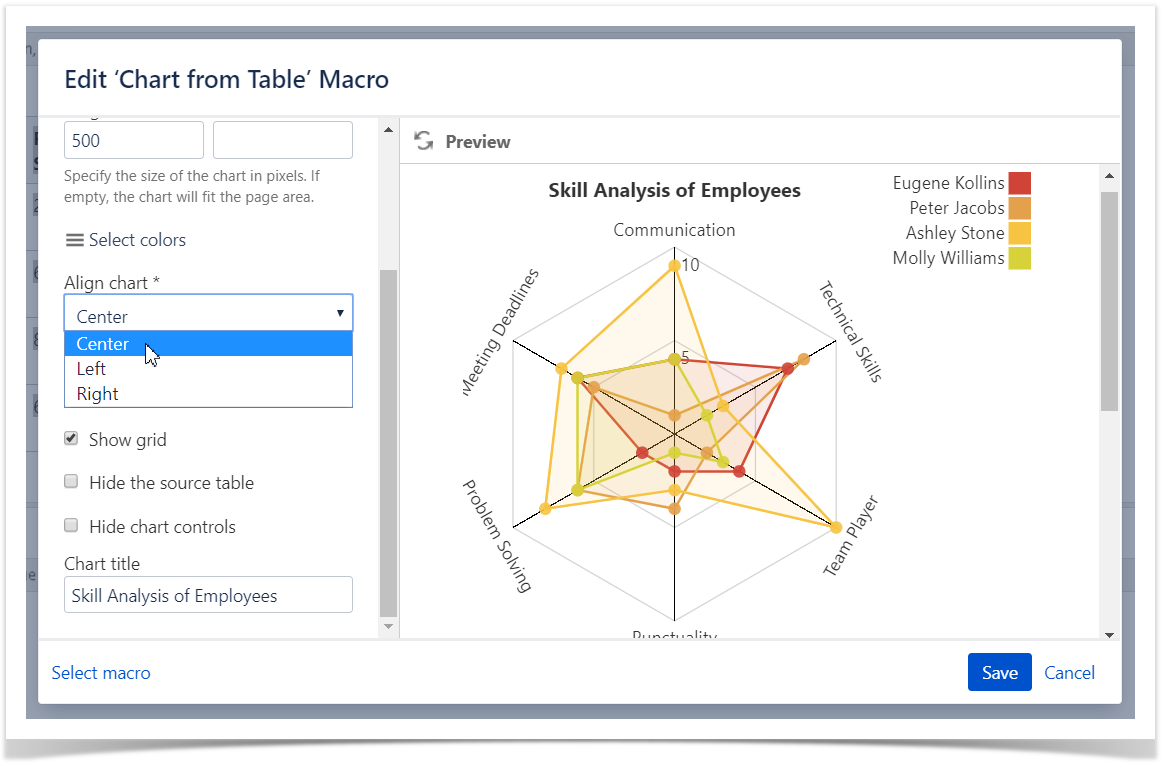
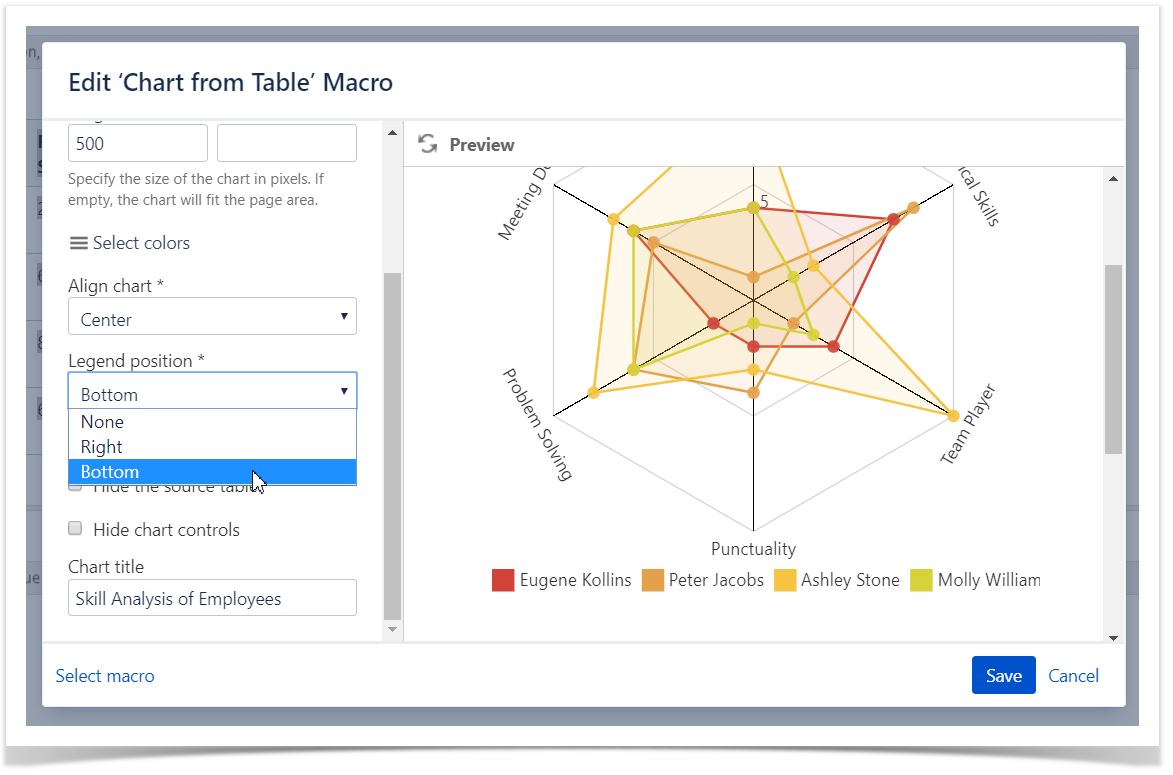
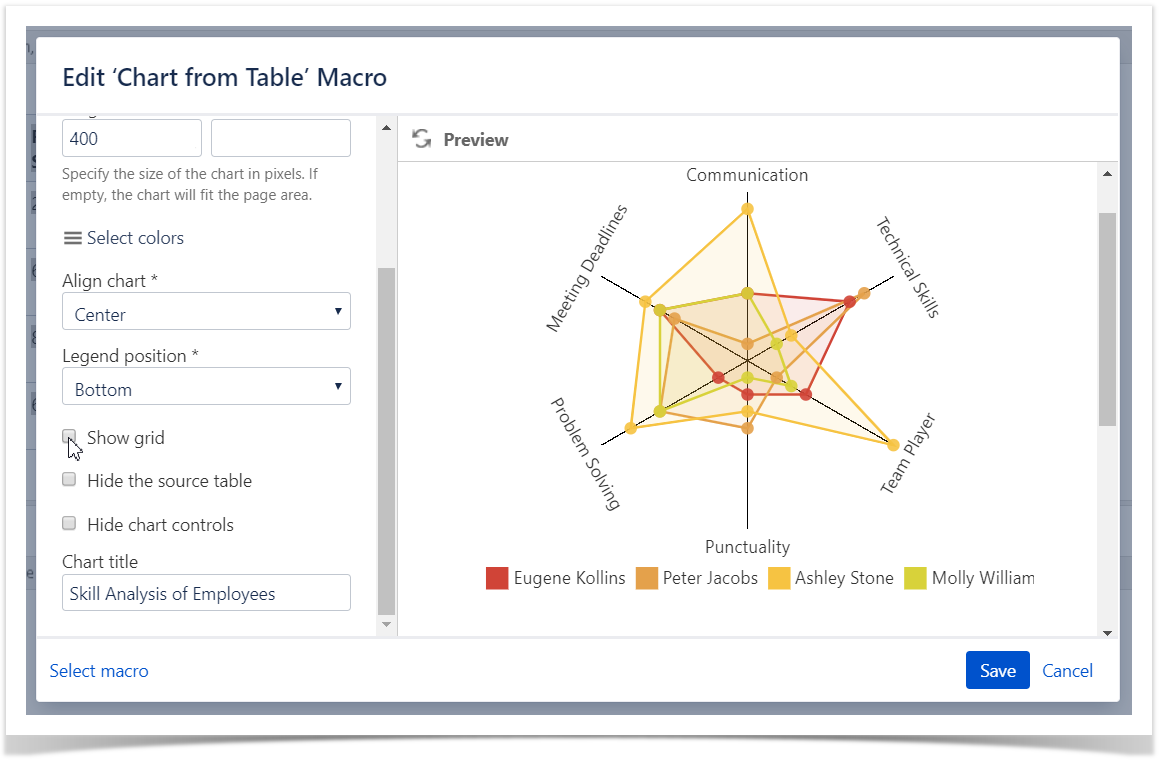
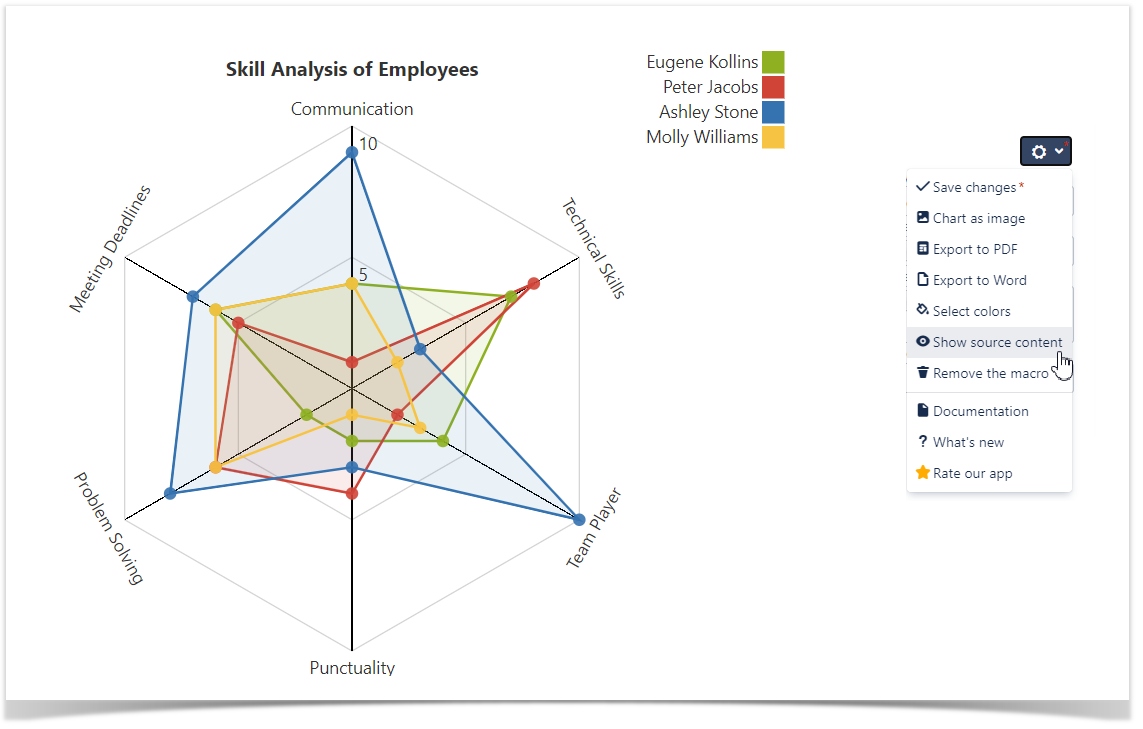
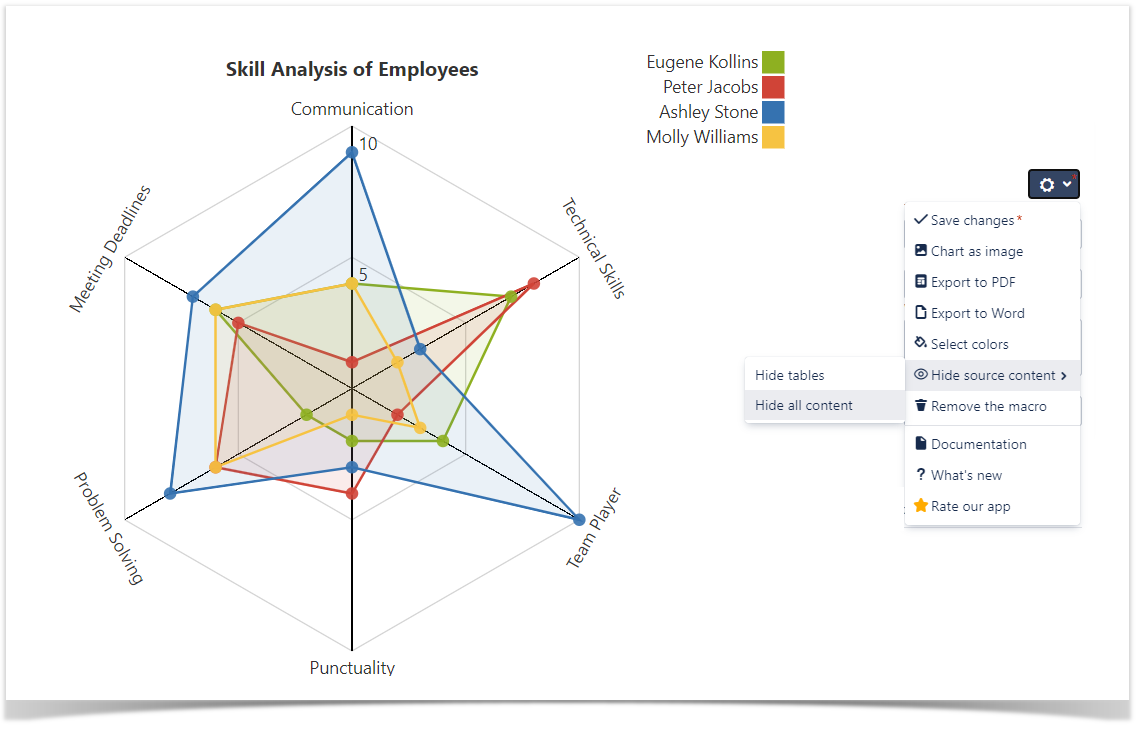
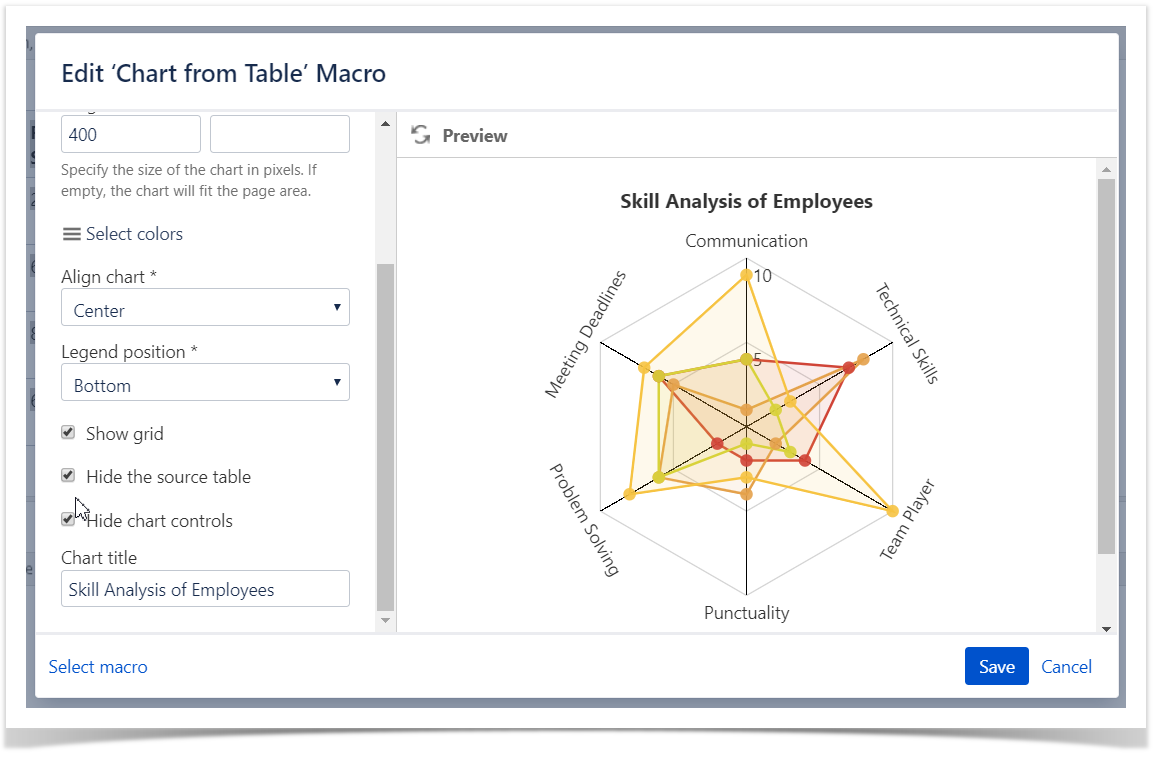
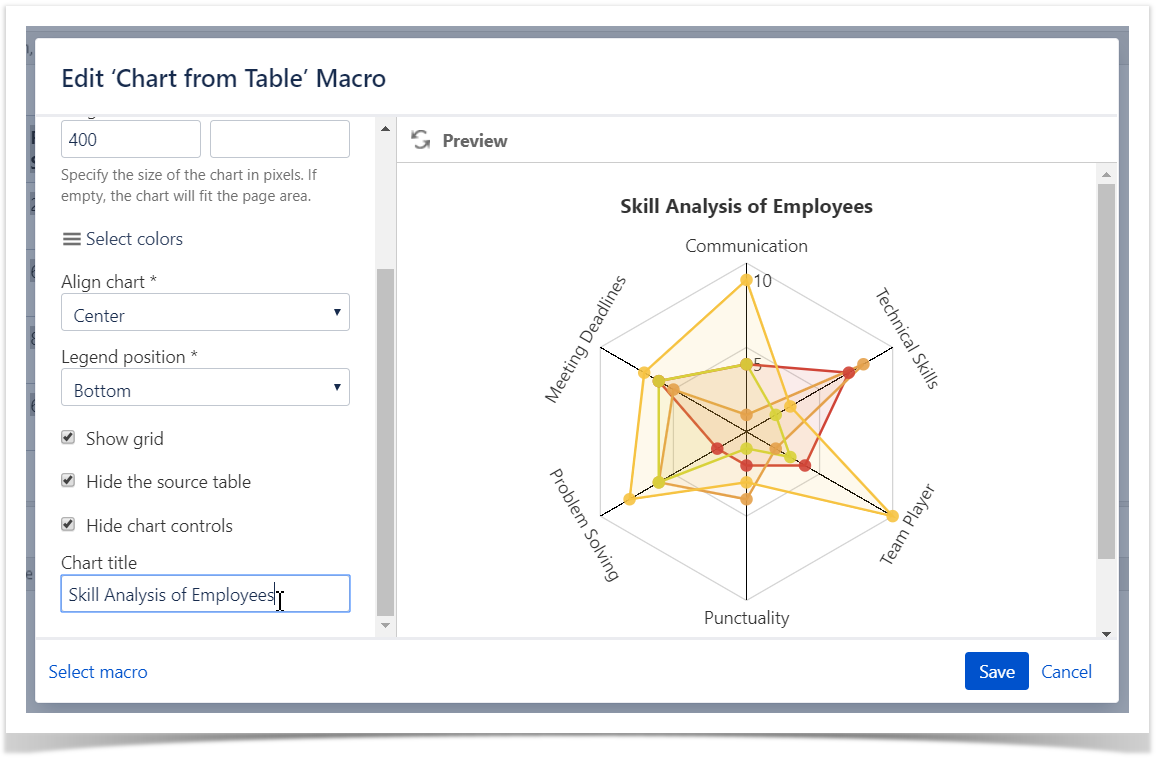
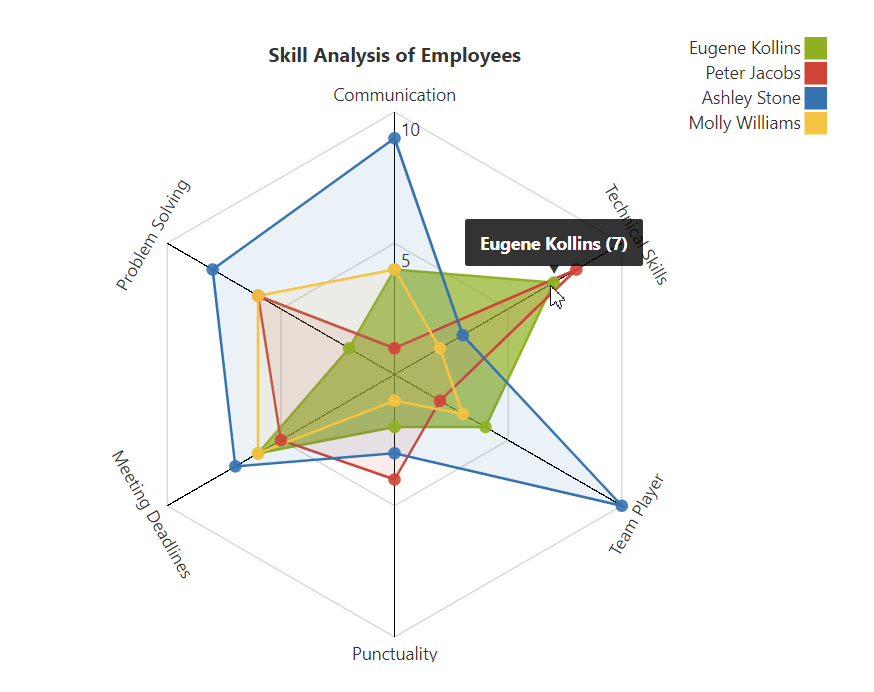
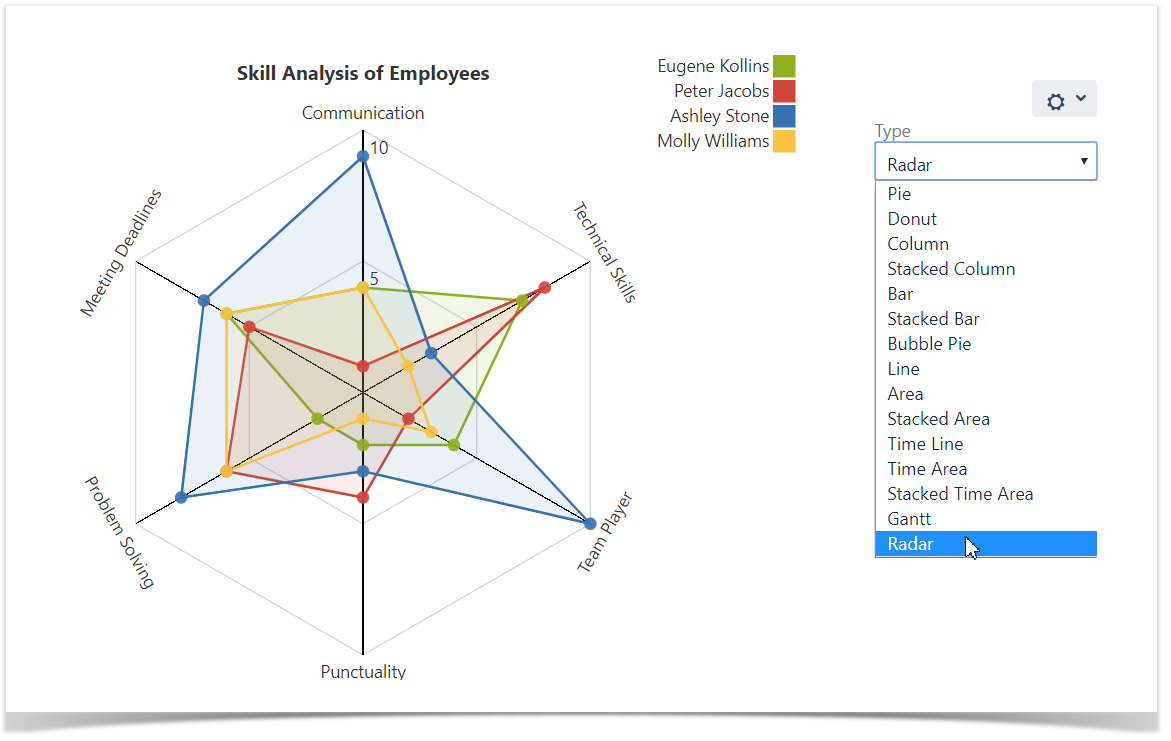
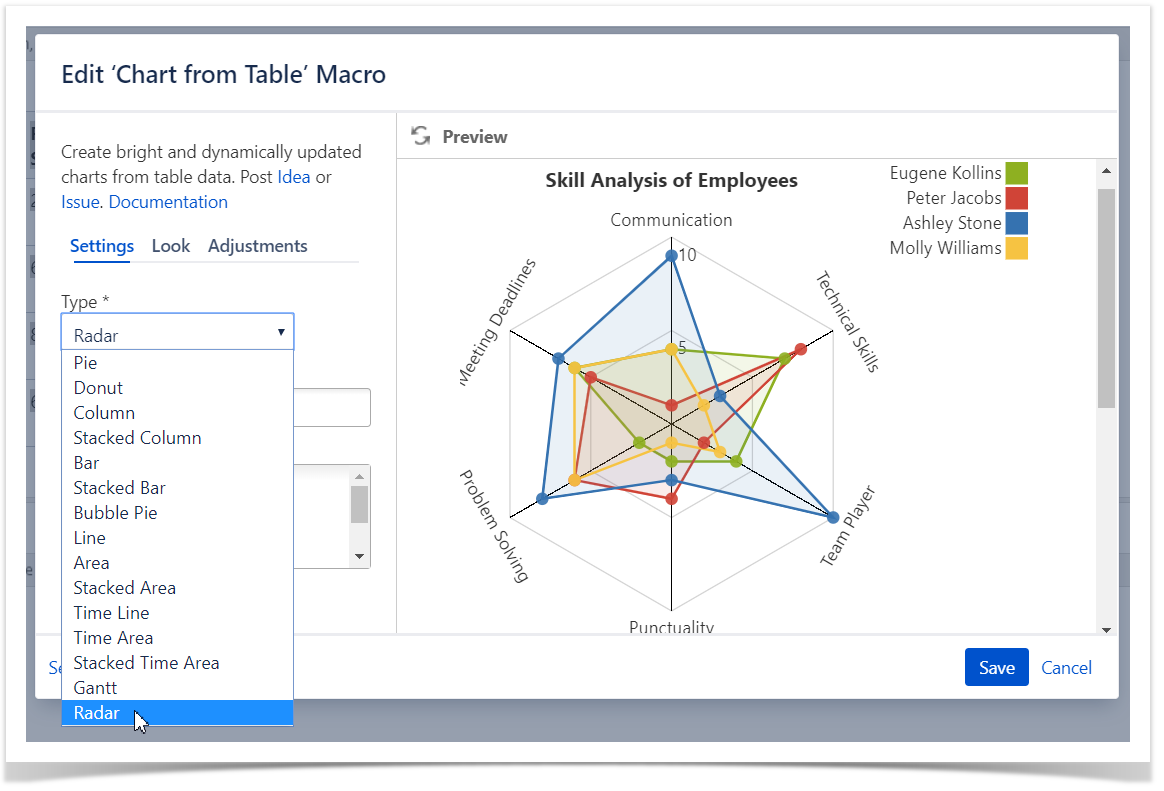
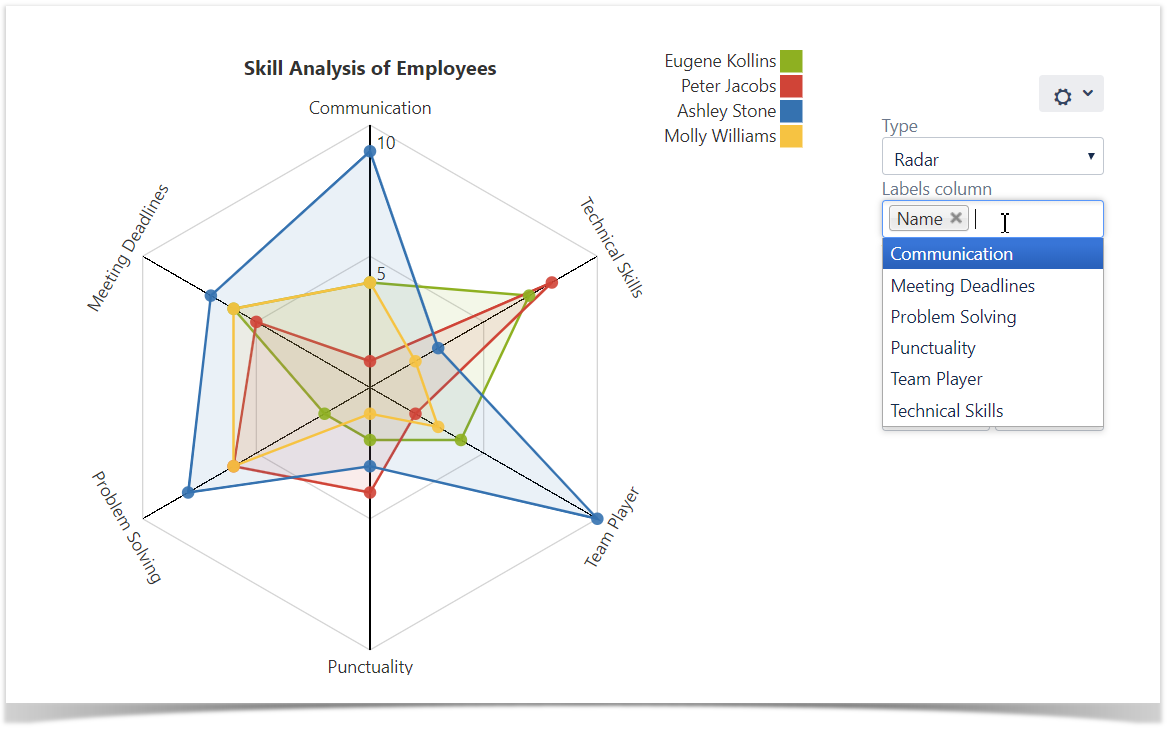
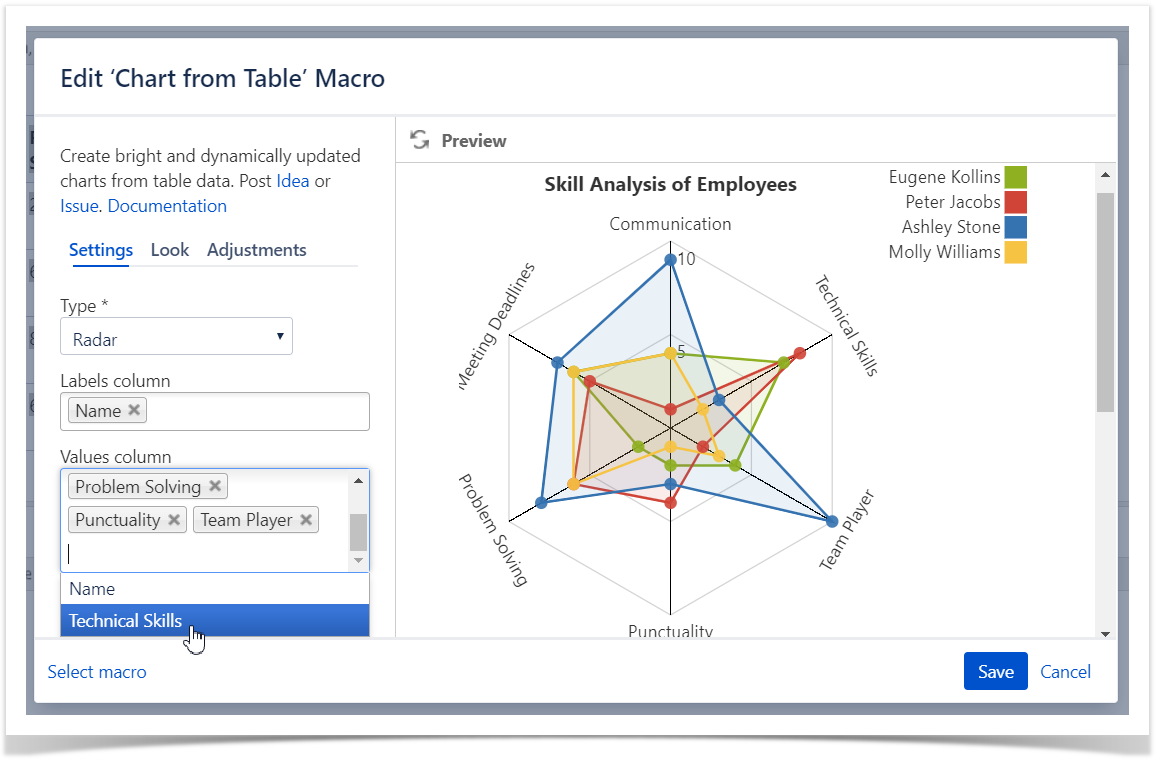
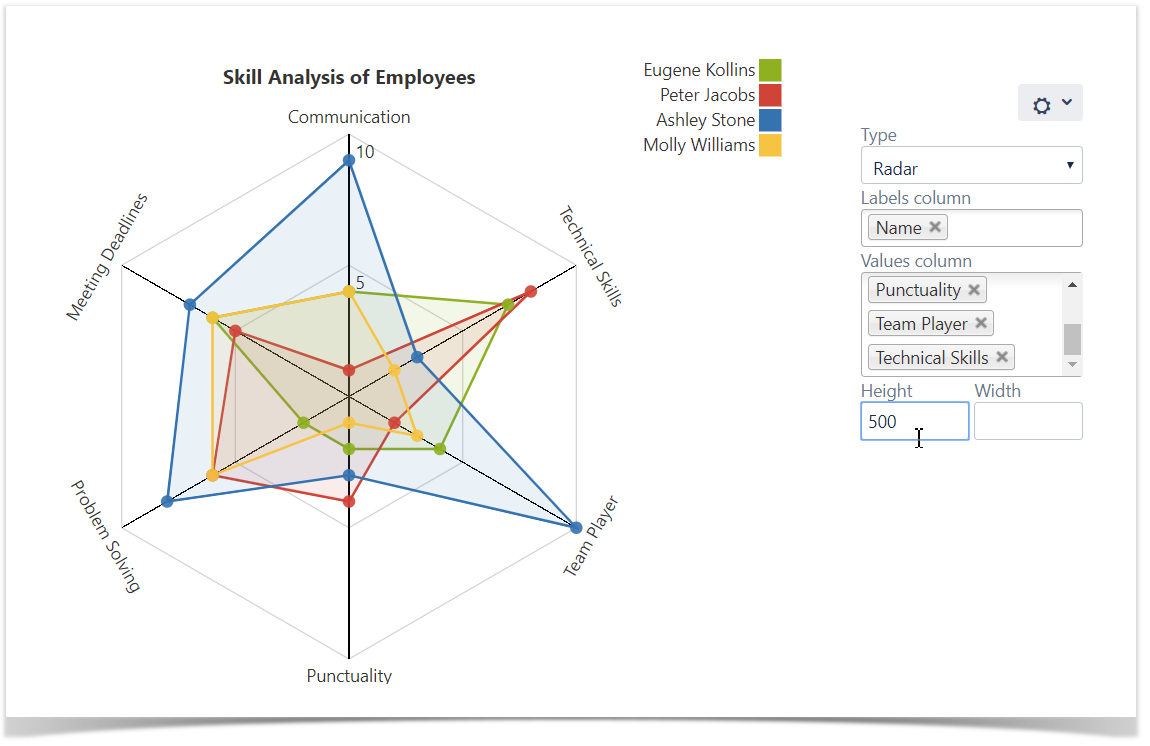
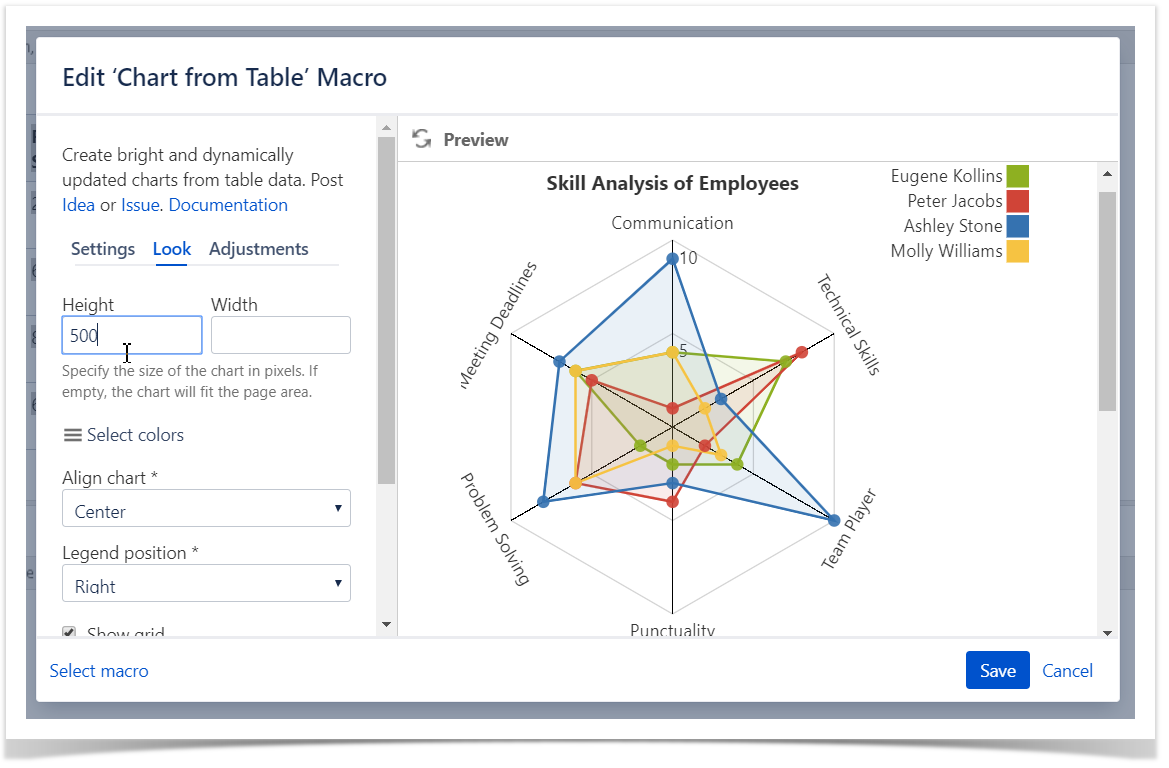
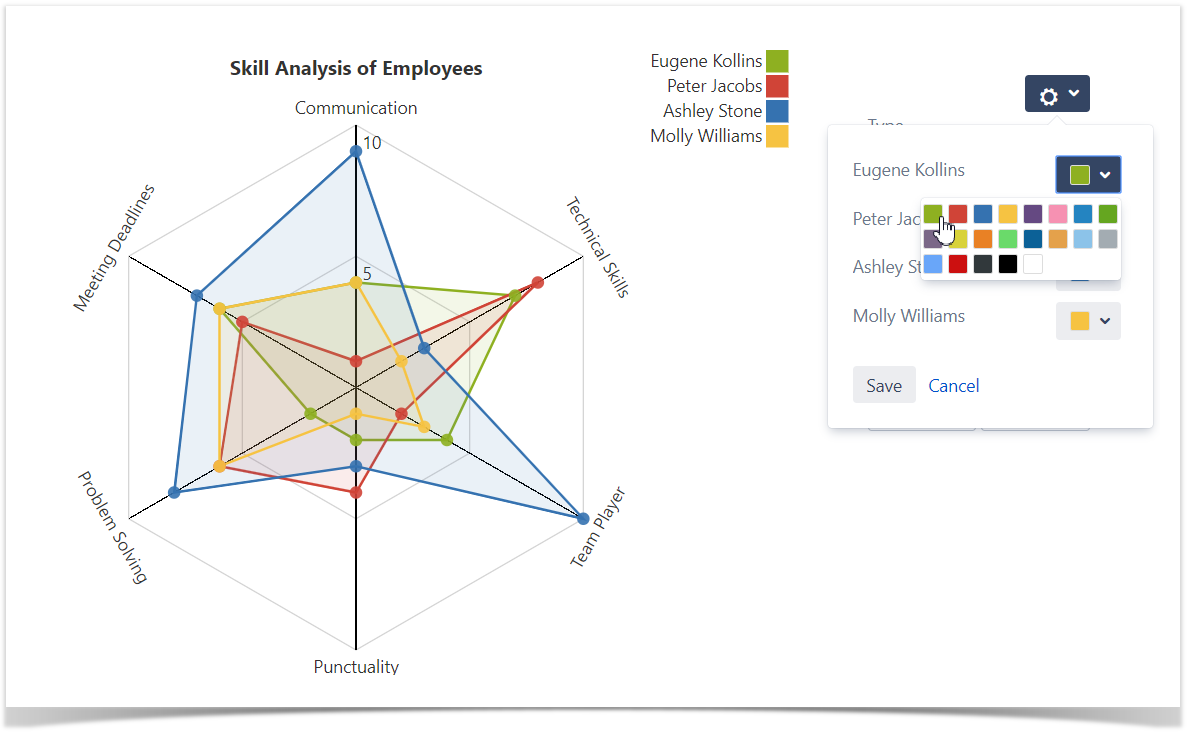
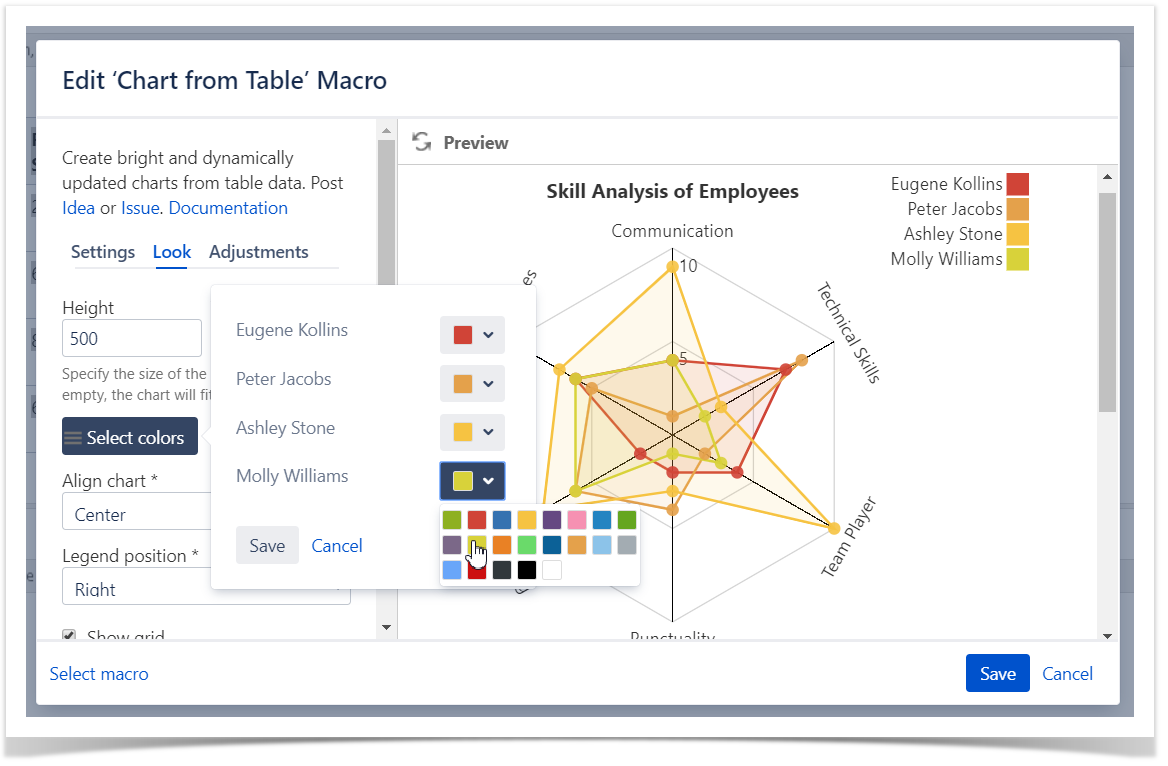
On this page you will learn how to configure the Radar (Spider) chart:
Example
|
Parameters
Settings Tab
|
|
Adjustments Tab
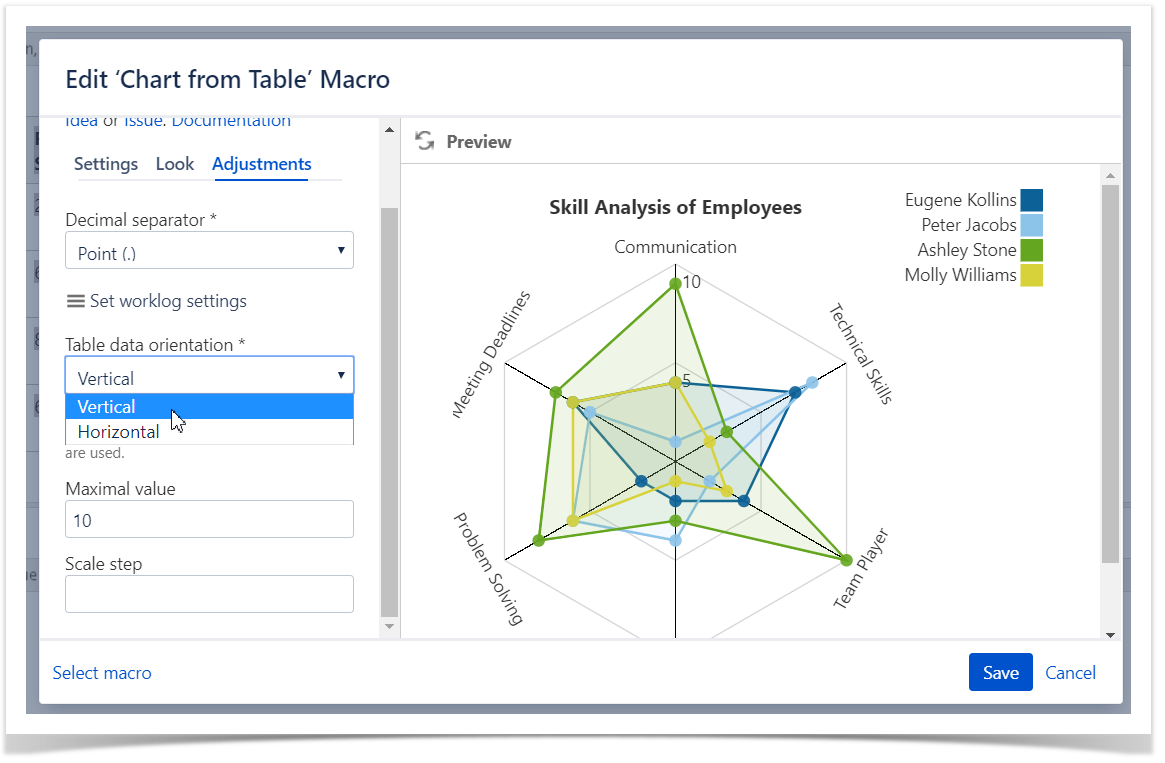
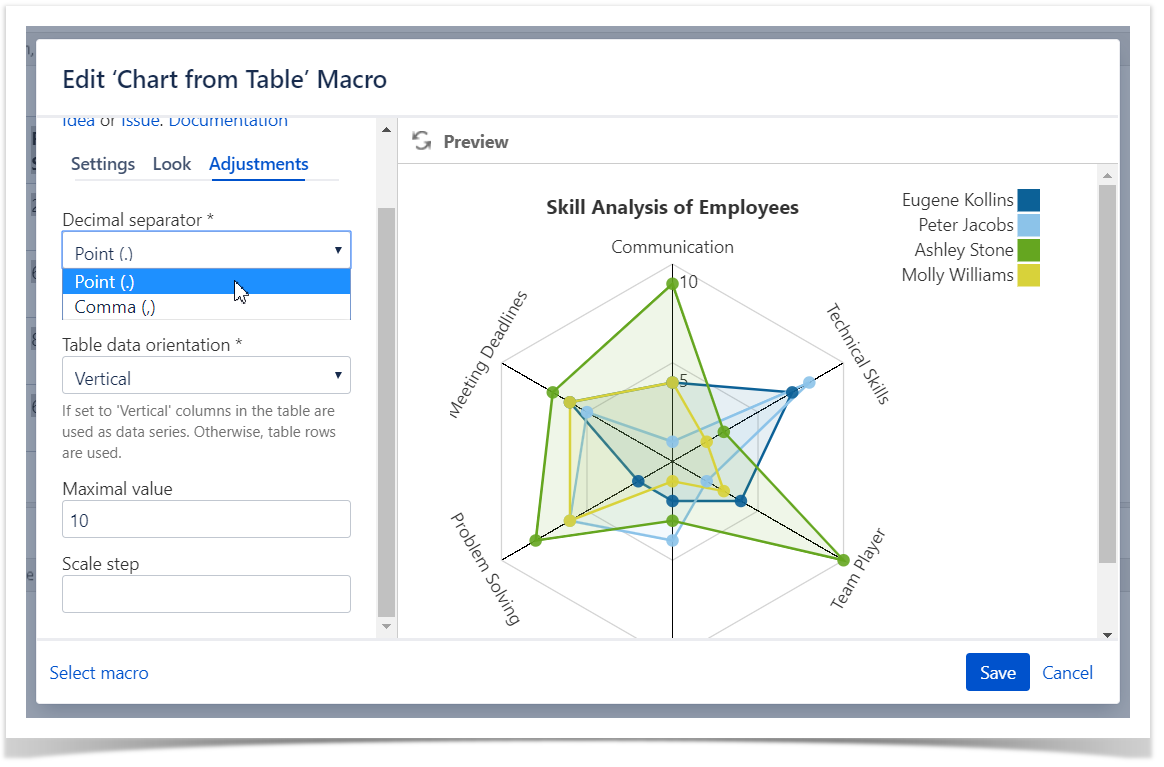
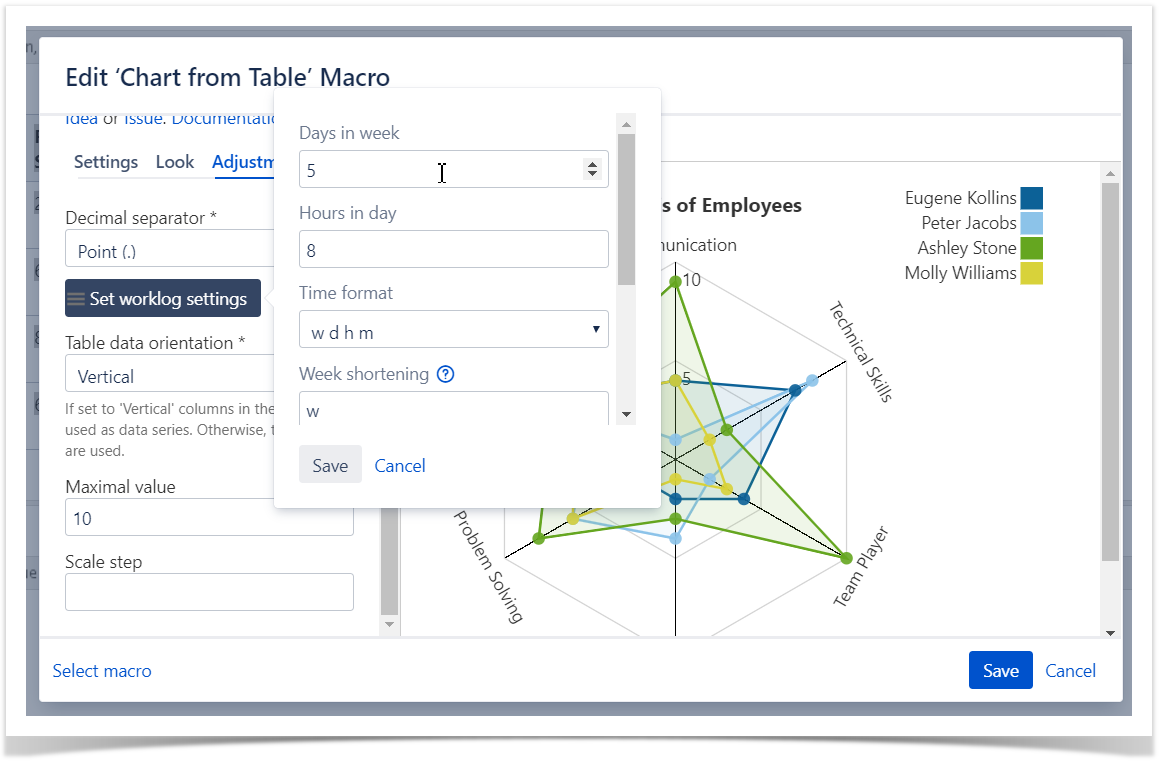
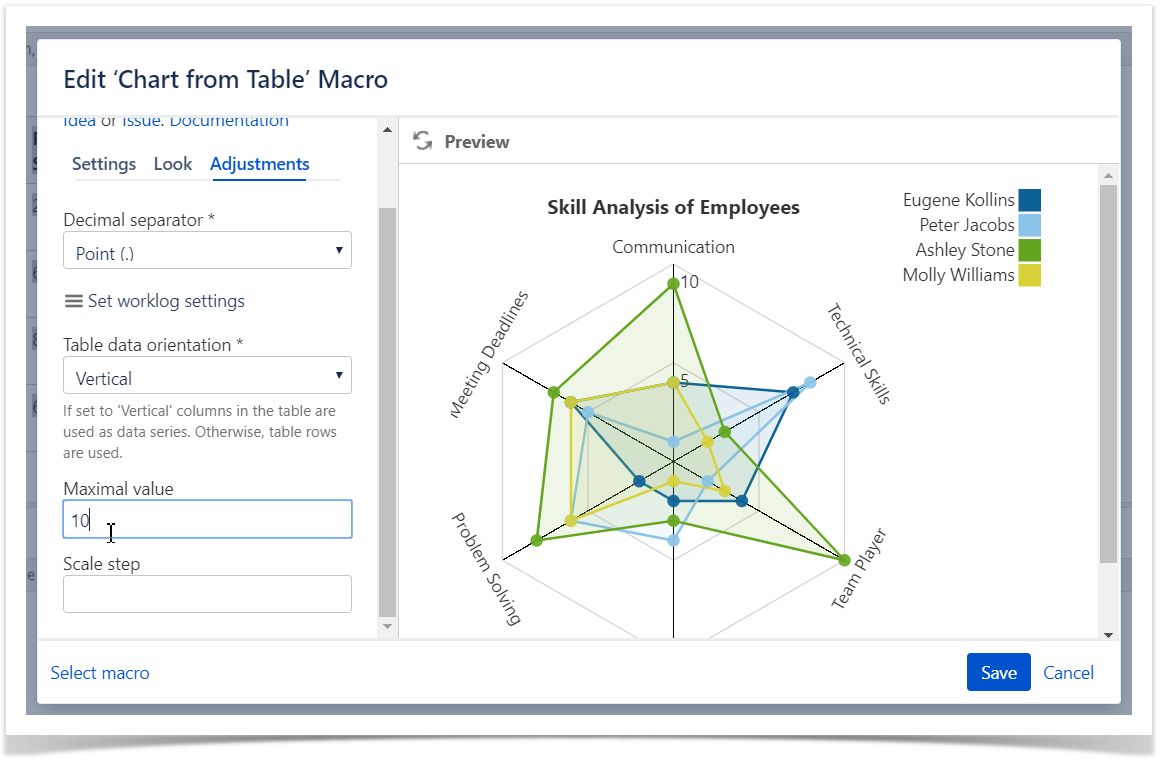
Set the maximal value
Maximal value - You can specify the maximal value for showing only data values not greater than the specified maximal value.
- Switch the page to the edit mode.
- Select the macro and click Edit.
- Switch to the Adjustments tab.
- Locate the Maximal value options and set the values.
- Save the macro and the page.
Set the scale step
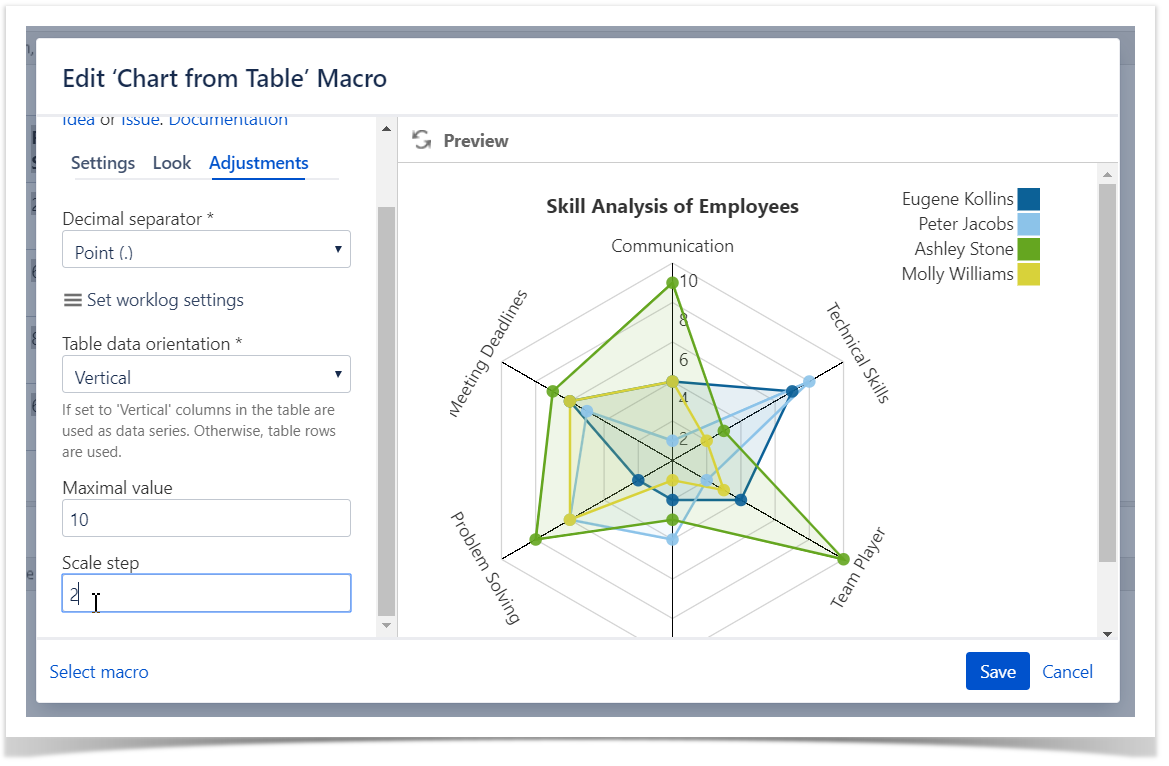
Scale Step - the required scale step of Y axis for showing the chart.
- Switch the page to the edit mode.
- Select the macro and click Edit.
- Switch to the Adjustments tab.
- Locate the Scale Step options and set the scale step.
- Save the macro and the page.
Look Tab
|
|
