This release adds Activity Graph and improves Commits Graph. |
New in this release
- Visualize the recent activity in your repositories with new Activity Graph.
- In Commit Graph, click a point to highlight the ancestors of a certain changeset.
- Collapse and expand Commit Graph.
Visualize the recent activity in your repositories with new Activity Graph
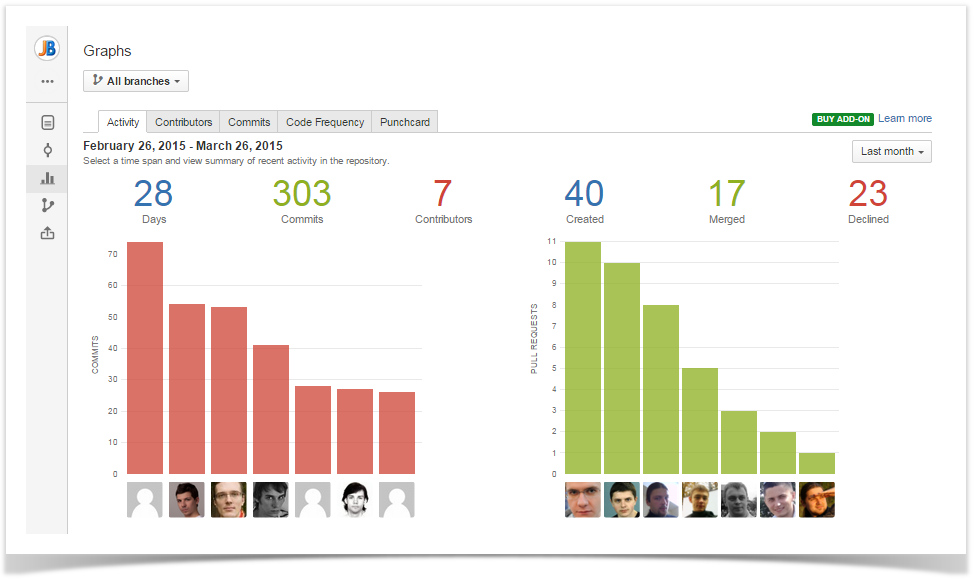
The new tab provides you with Commits Chart and Pull Requests Chart showing the number of commits/pull requests made by top contributors during the selected time span. Each bar represents one contributor.
Above Commits Chart you can see:
- number of days included into the selected time span
- total number of commits made during the selected time span
- total number of contributors who contributed to the repository during the selected time span
Above Pull Requests Chart you can see the total number of pull requests created, merged and declined during the selected time span. Stash users with Administrator permissions can hide Pull Requests Chart.
In the Activity section below the charts, all commits and pull requests of the selected time span are shown as the activity stream with links to the associated JIRA issues, hashes and Change Type lozenges.

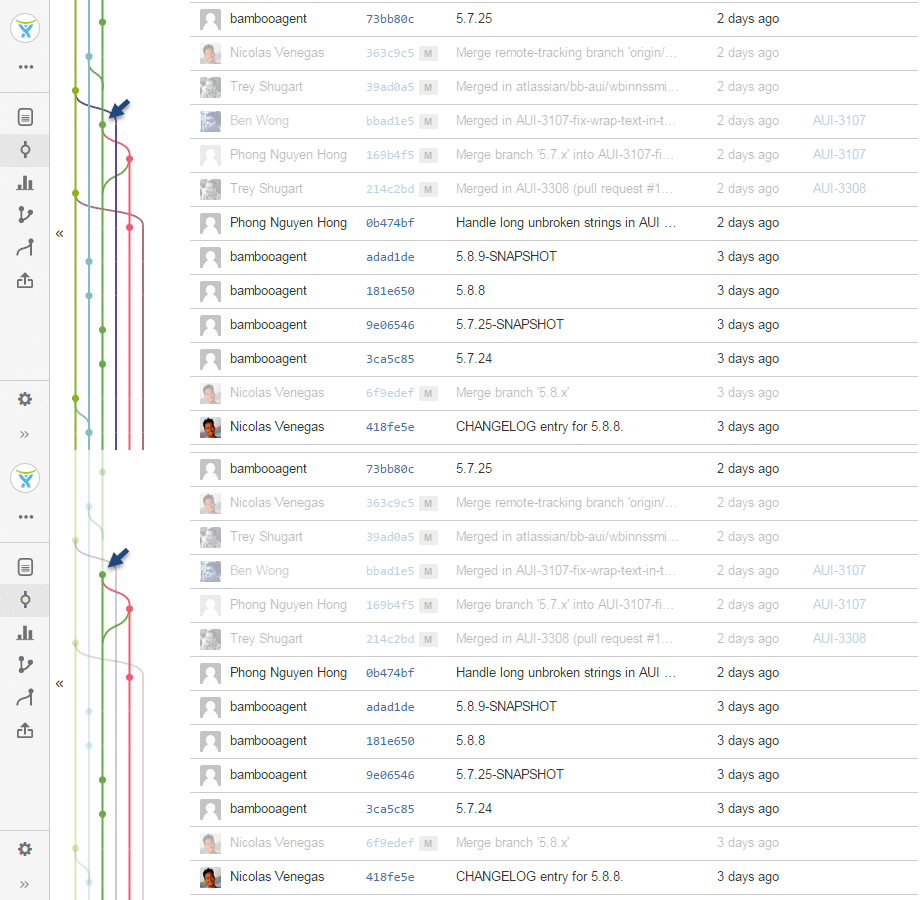
In Commit Graph, click a point to highlight the ancestors of a certain changeset
Now you can interact with Commit Graph. All changesets are highlighted by default. Click a corresponding point to highlight only the ancestors of a certain changeset and see where it comes from. To have all changesets highlighted again, click anywhere outside the points on the graph.

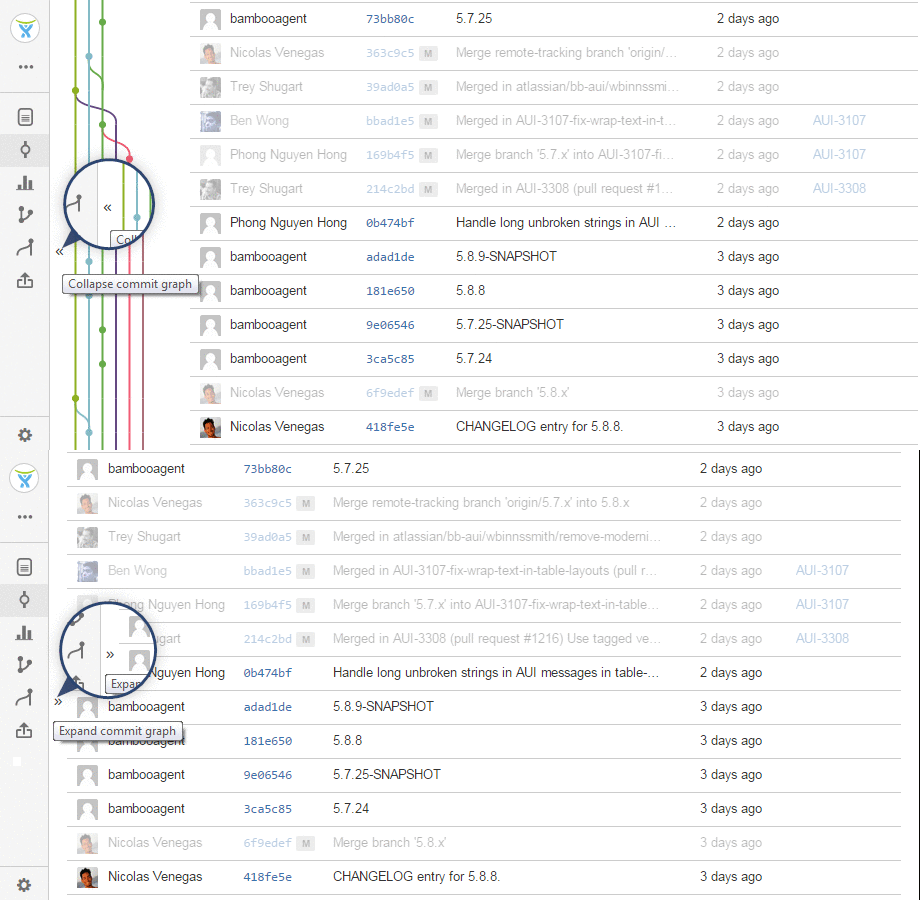
Collapse and expand Commit Graph
We added collapsing and expanding of Commit Graph. When you want to hide Commit Graph, click the  button to the left of Commit Graph. Click
  to expand and view it again.
