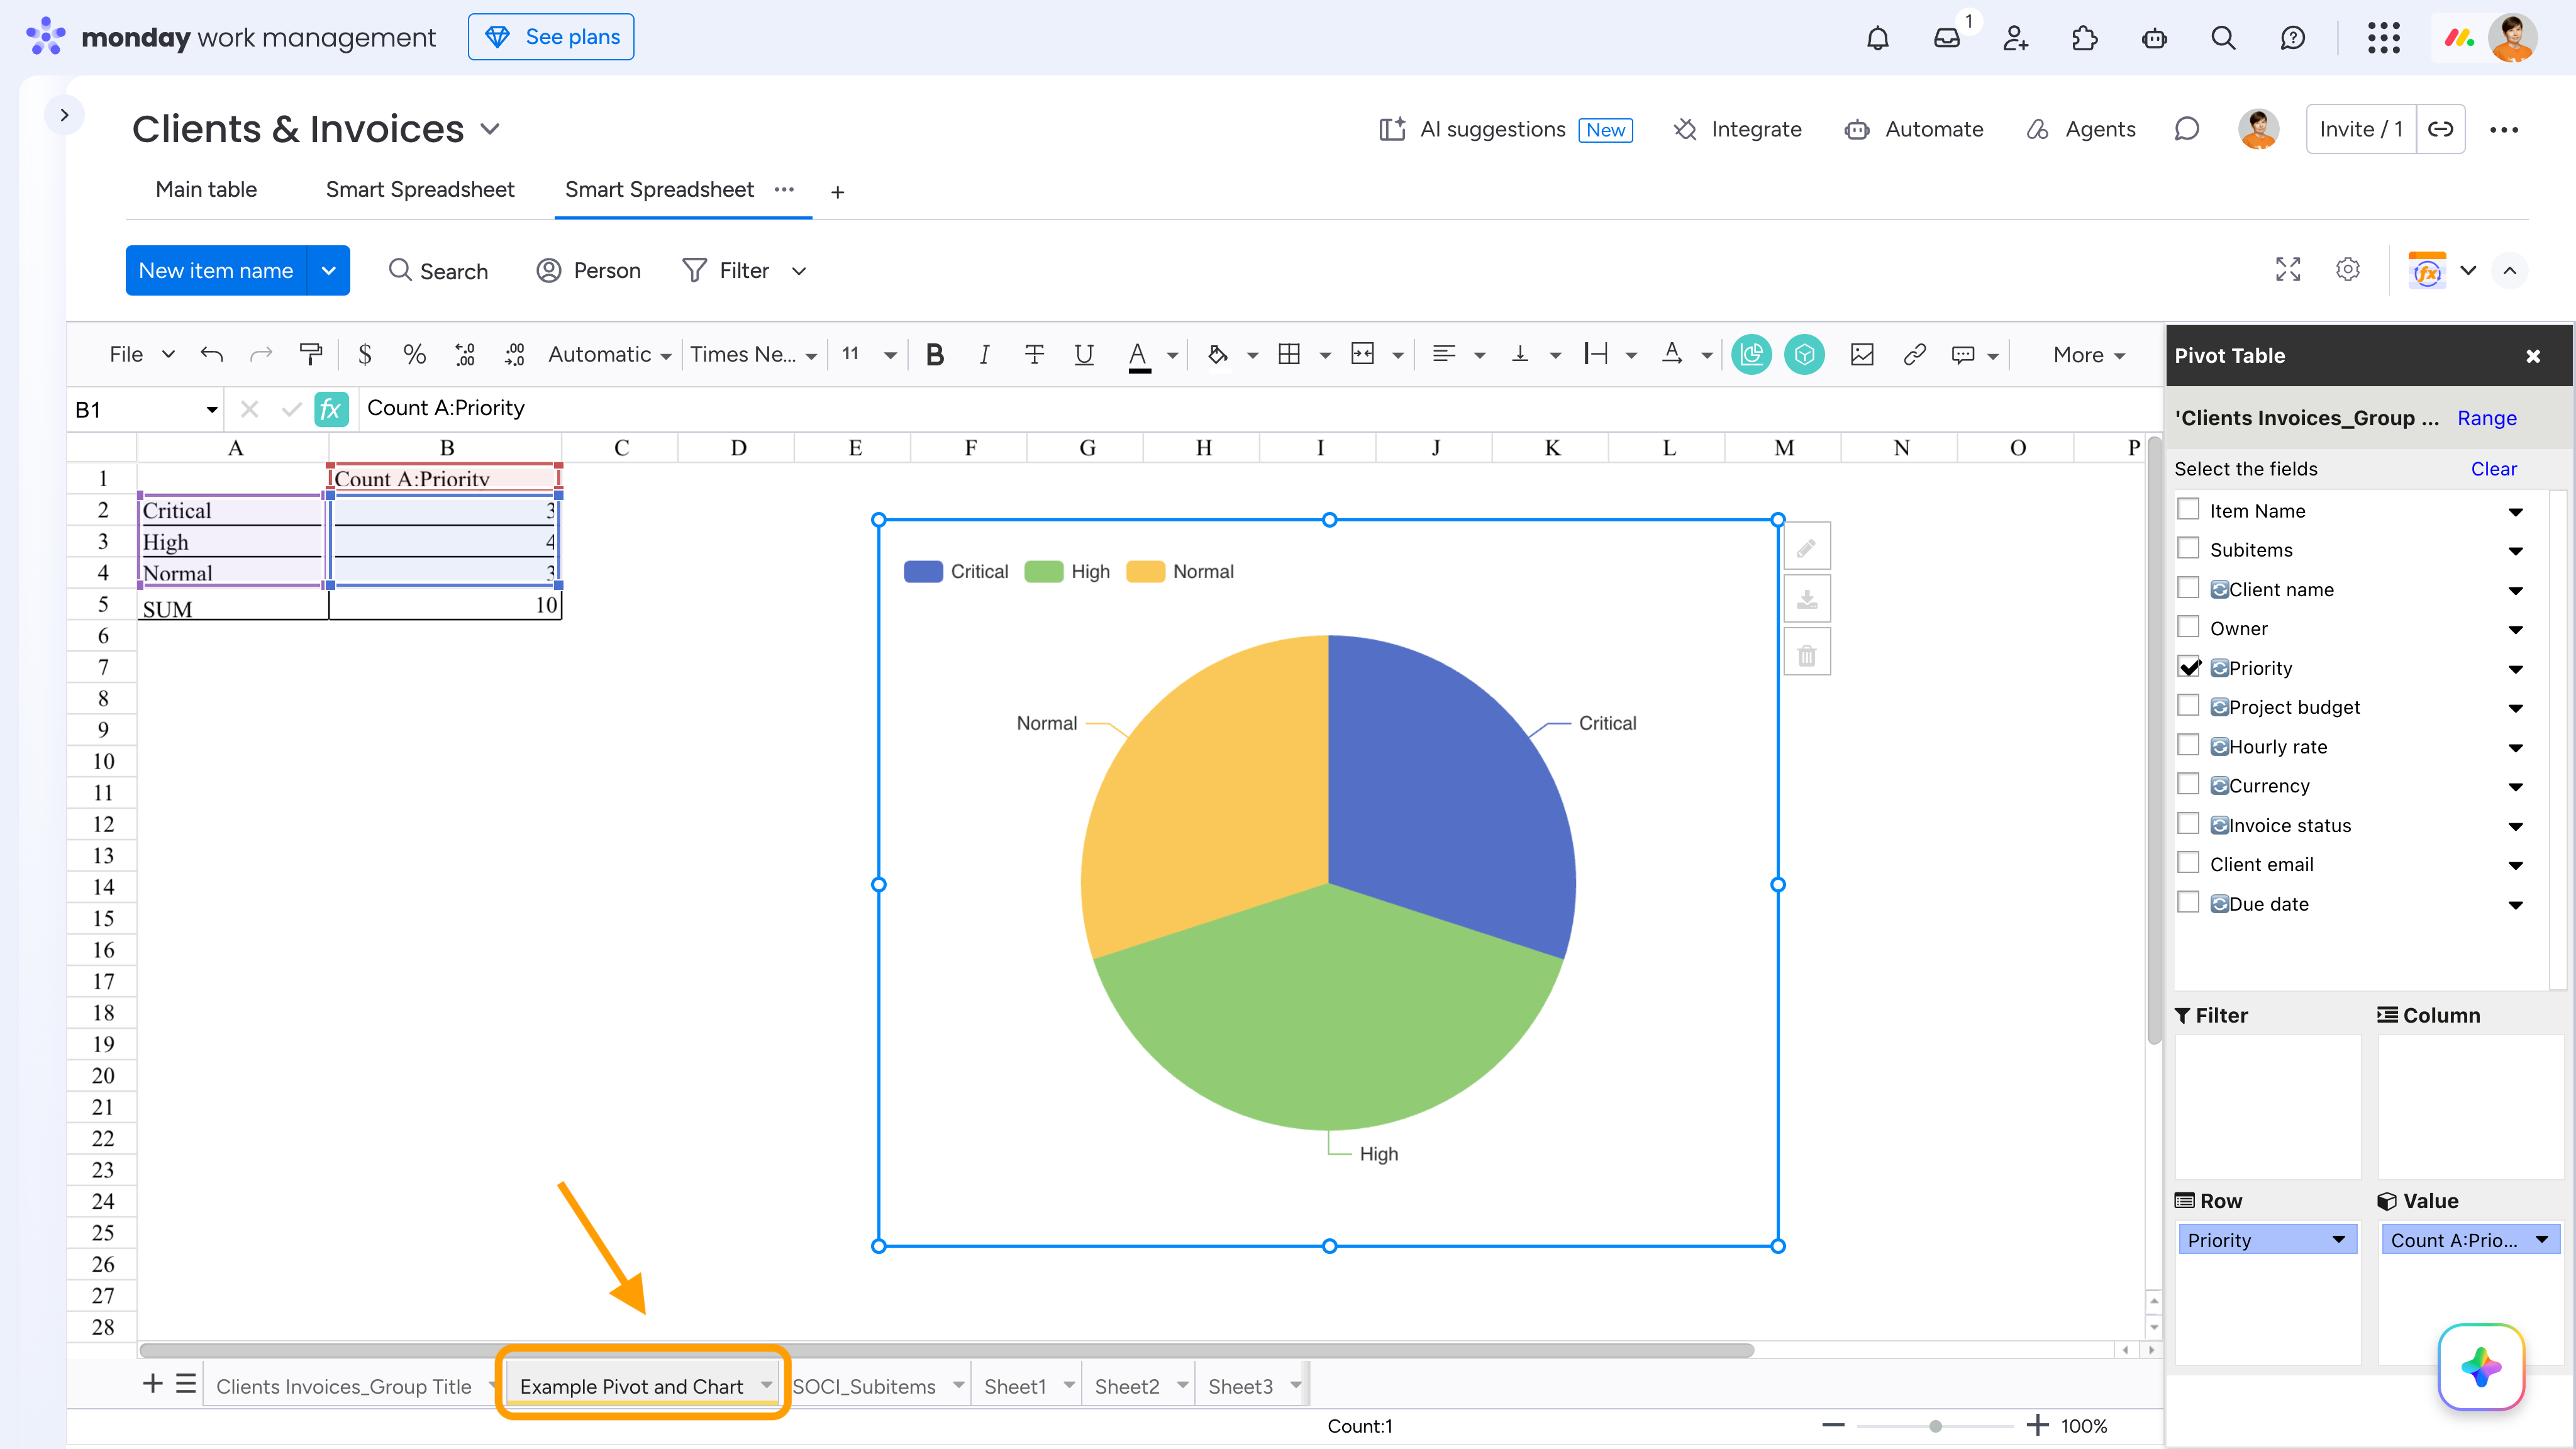
We introduced automatically generated Pivot Tables and Charts when you import a monday.com board into Smart Spreadsheet.
A sample sheet is created with a Pivot Table summarizing your board data and a Chart based on the Pivot Table. The Pivot Table automatically uses a Status column for aggregation when available, a People column if there are no Status columns, or simply counts unique items when neither is present.
You can customize or delete the sample sheet, adjust the Pivot Table and Chart, or create additional Pivot Tables and Charts based on synced board data or any other data in your Smart Spreadsheet.
Cookie Notice
This website uses cookies for analytics, personalization and advertising. By continuing to browse, you agree to our use of cookies. Learn more