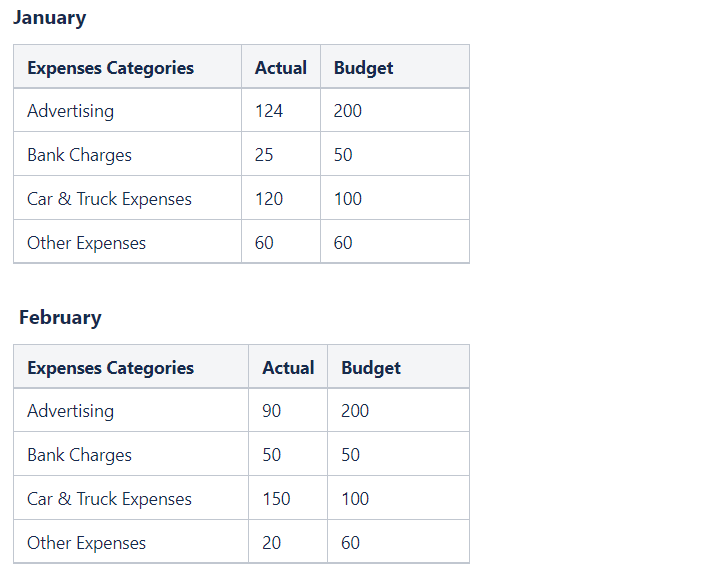
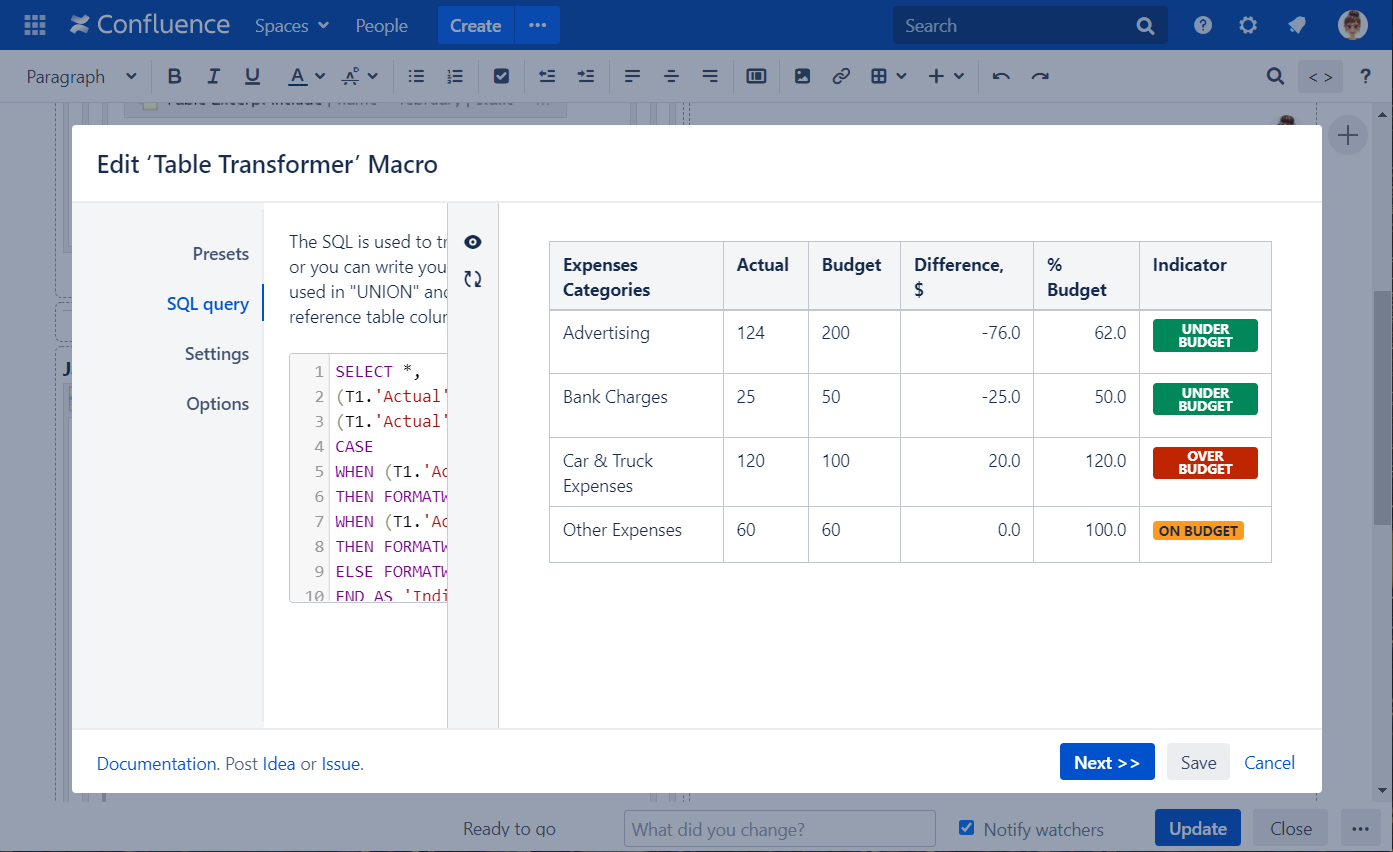
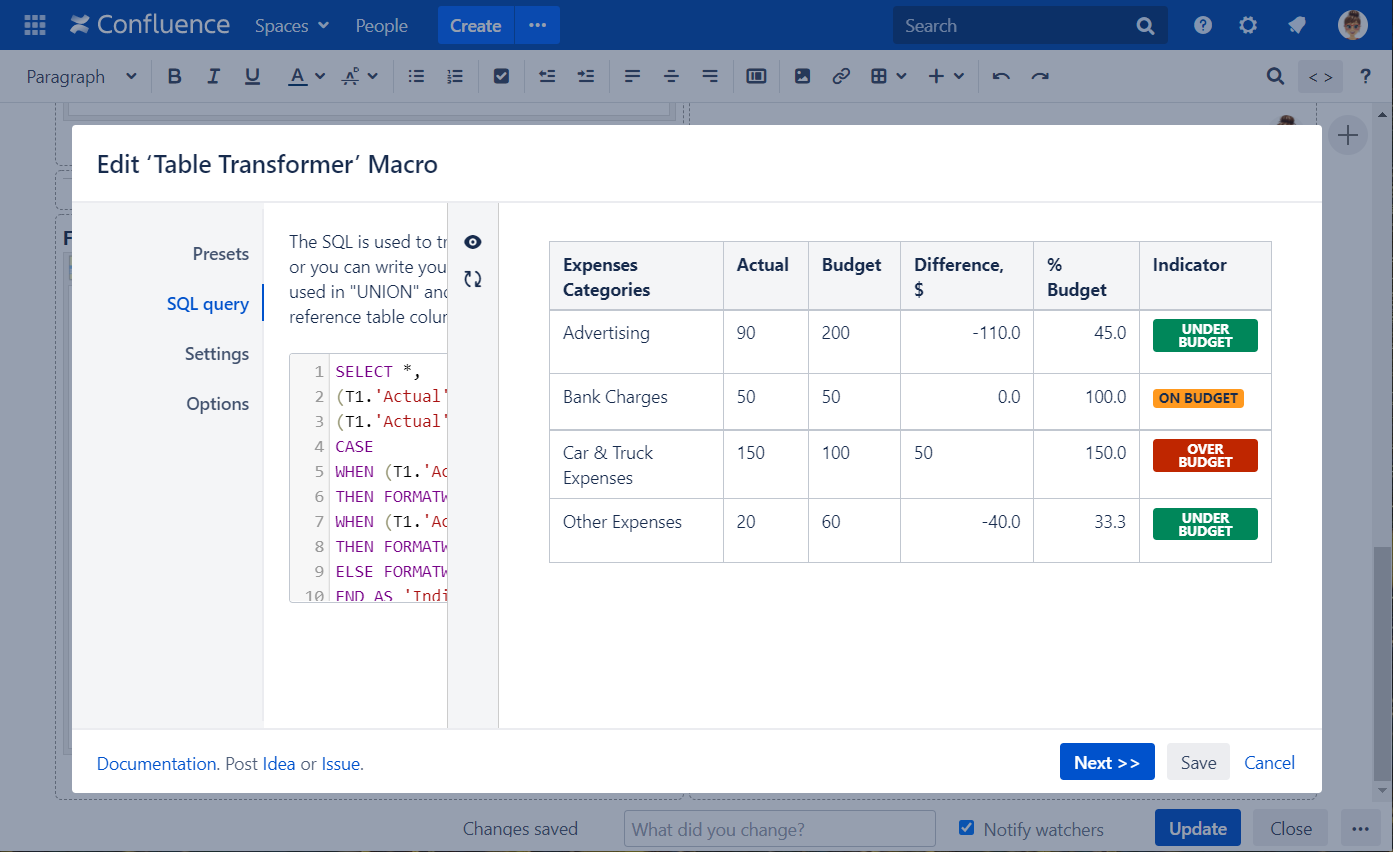
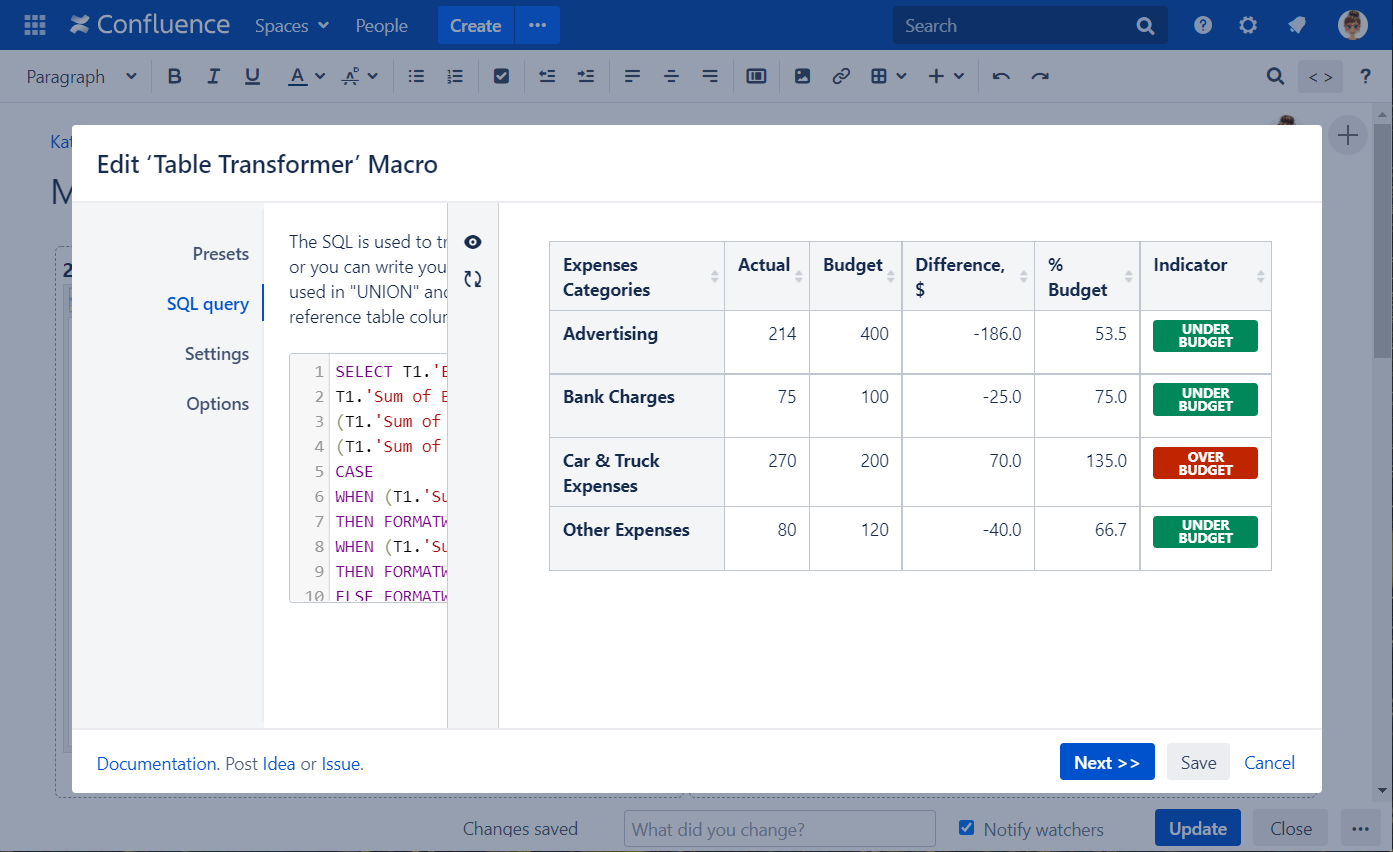
Caculating the difference between monthly budget and actual expenses by categories and display the appropriate status: "Under budget", "Over budget", "On budget".
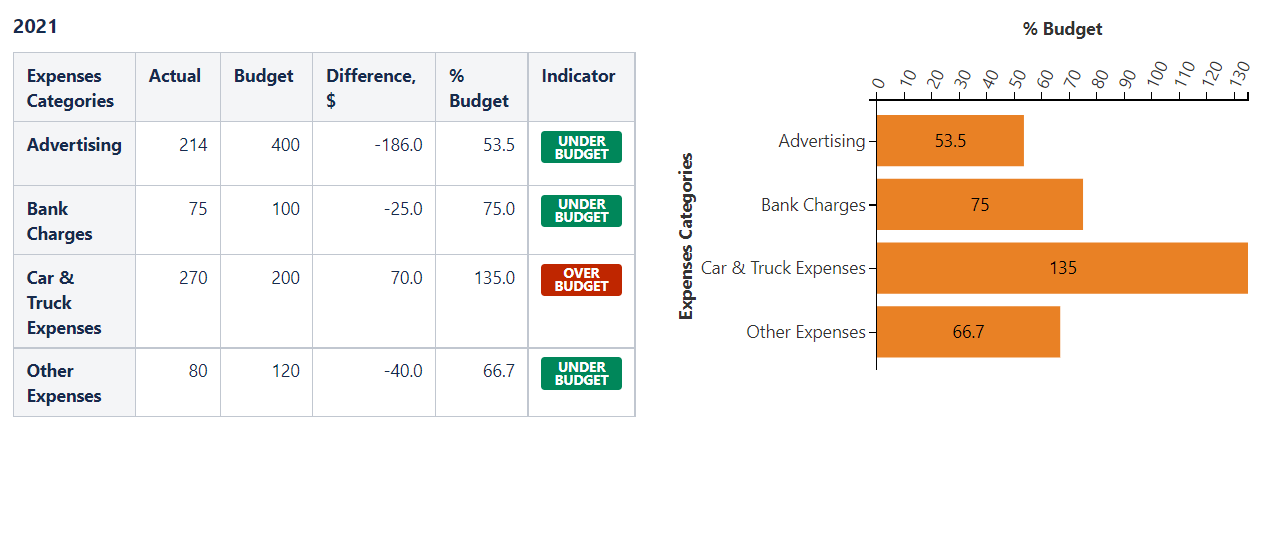
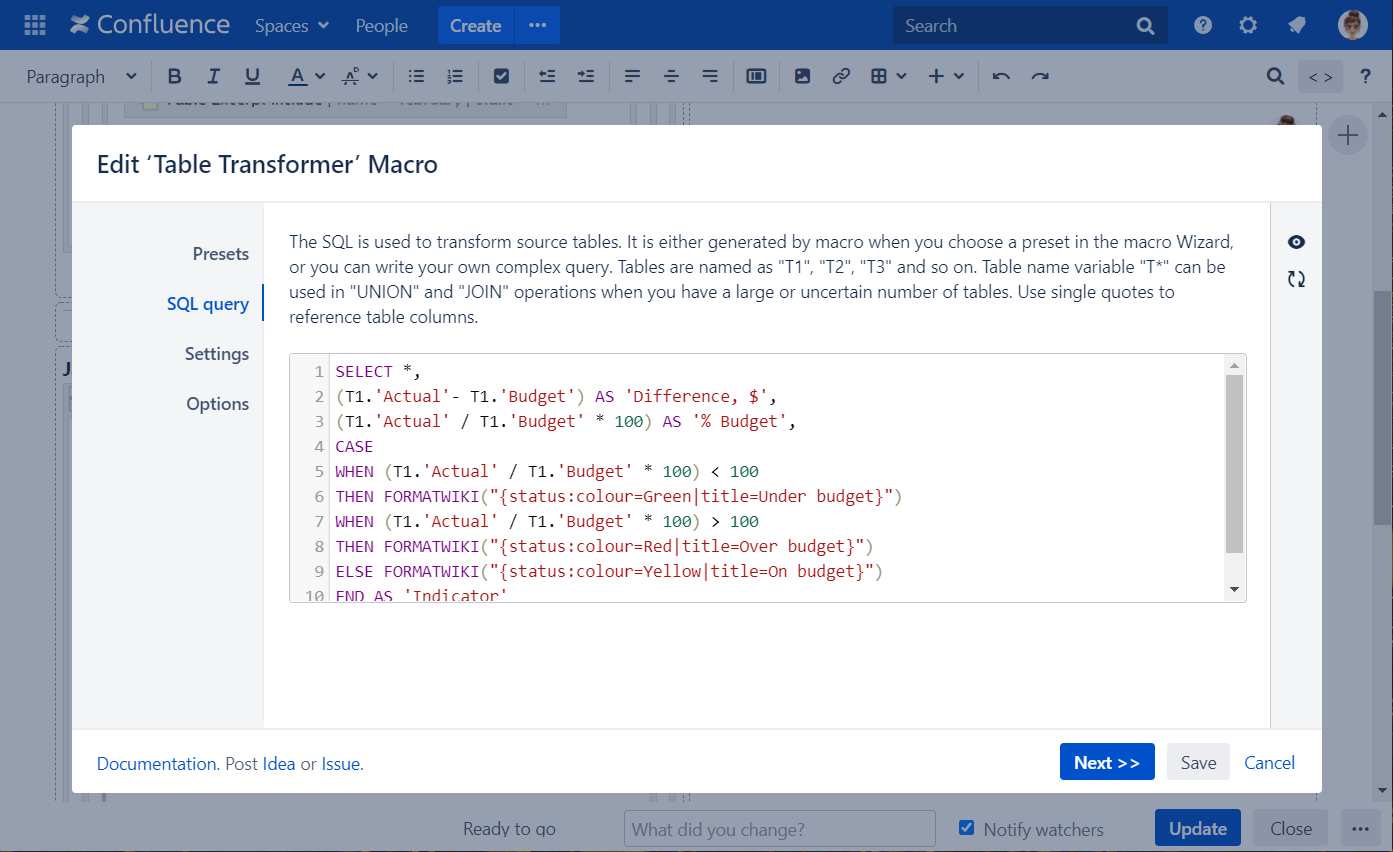
Table Transformer: Use the following SQL query for each month:
SELECT *,
(T1.'Actual'- T1.'Budget') AS 'Difference, $',
(T1.'Actual' / T1.'Budget' * 100) AS '% Budget',
CASE
WHEN (T1.'Actual' / T1.'Budget' * 100) < 100
THEN FORMATWIKI("{status:colour=Green|title=Under budget}")
WHEN (T1.'Actual' / T1.'Budget' * 100) > 100
THEN FORMATWIKI("{status:colour=Red|title=Over budget}")
ELSE FORMATWIKI("{status:colour=Yellow|title=On budget}")
END AS 'Indicator'
FROM T*
CODE
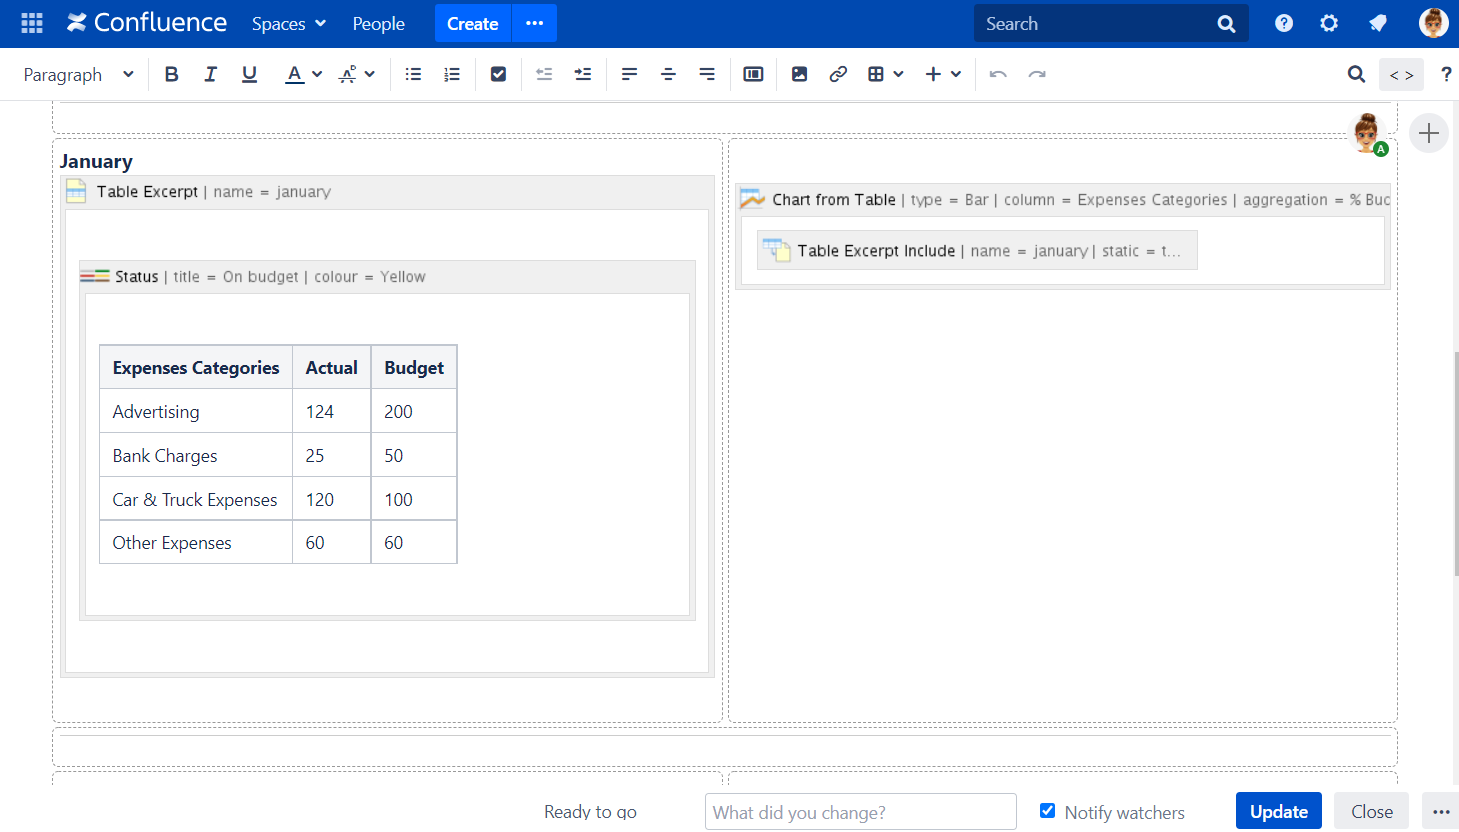
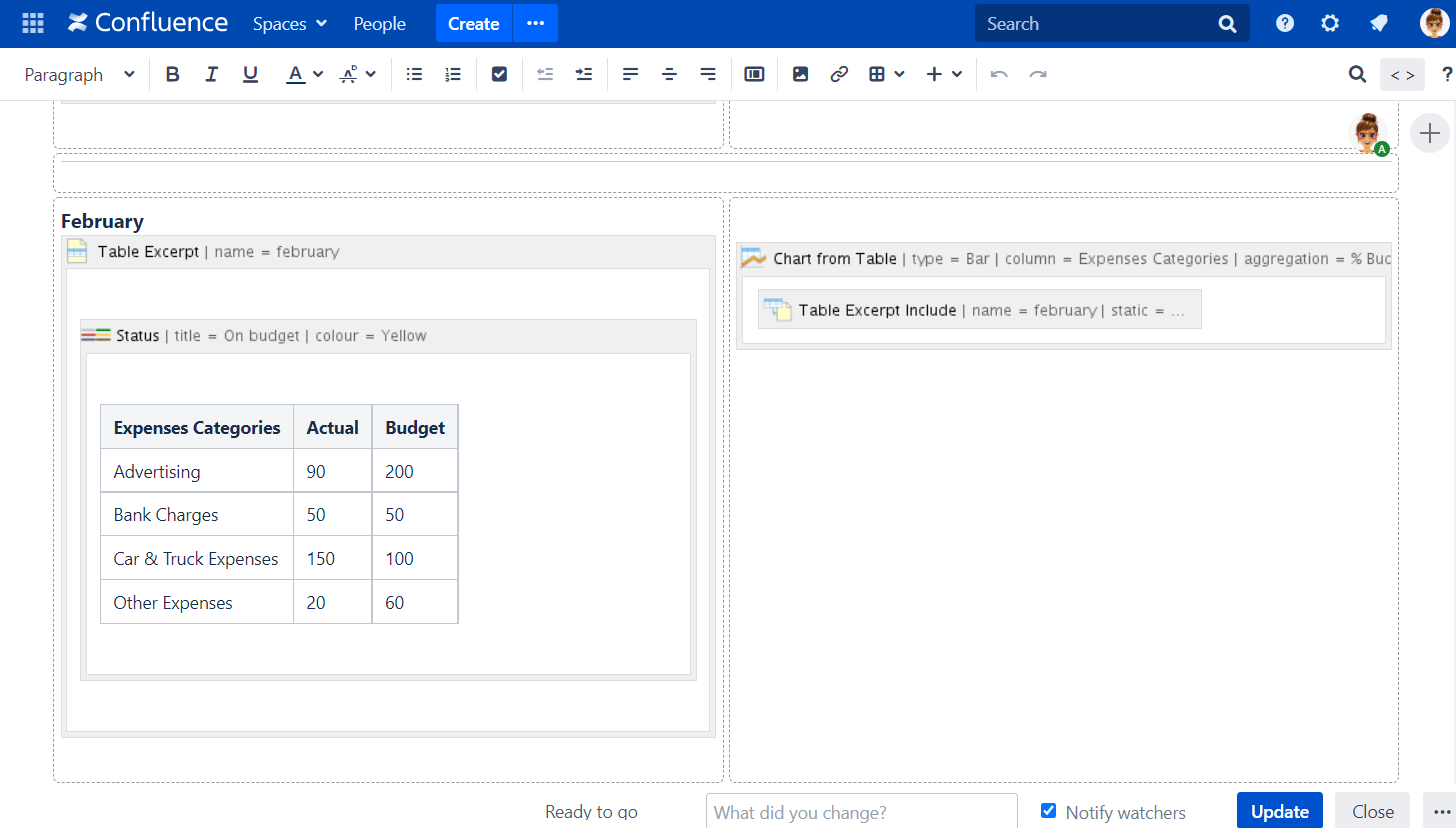
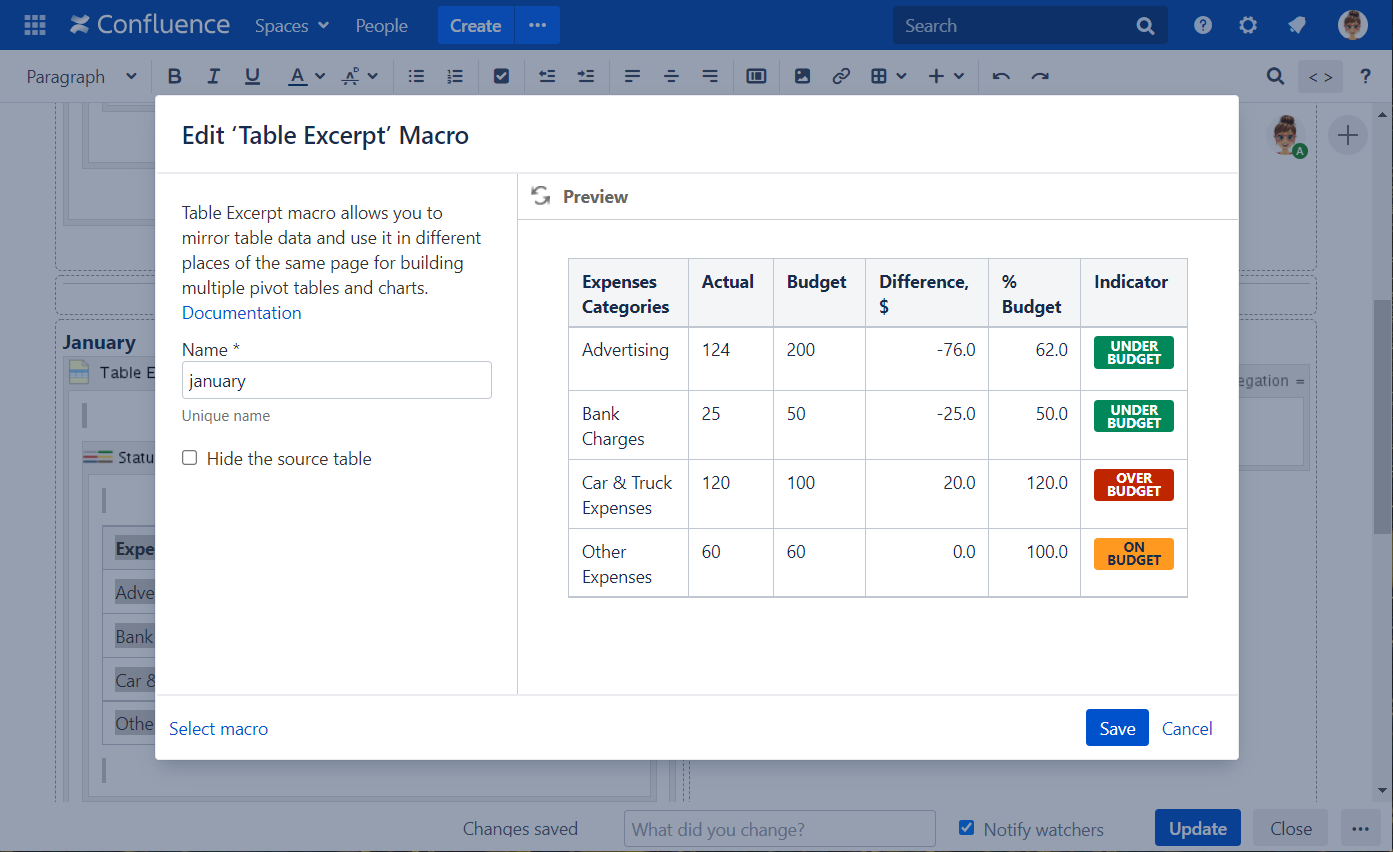
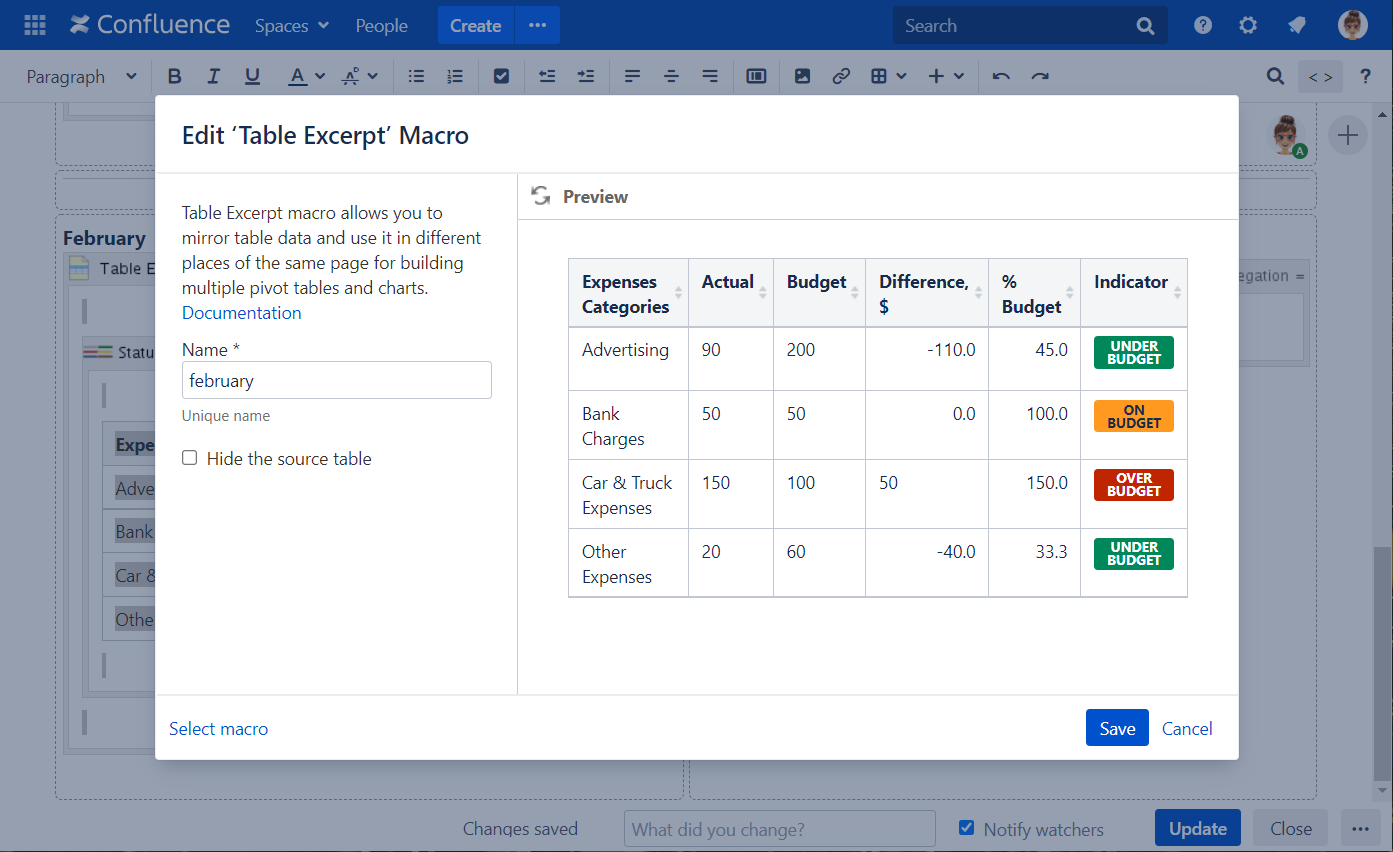
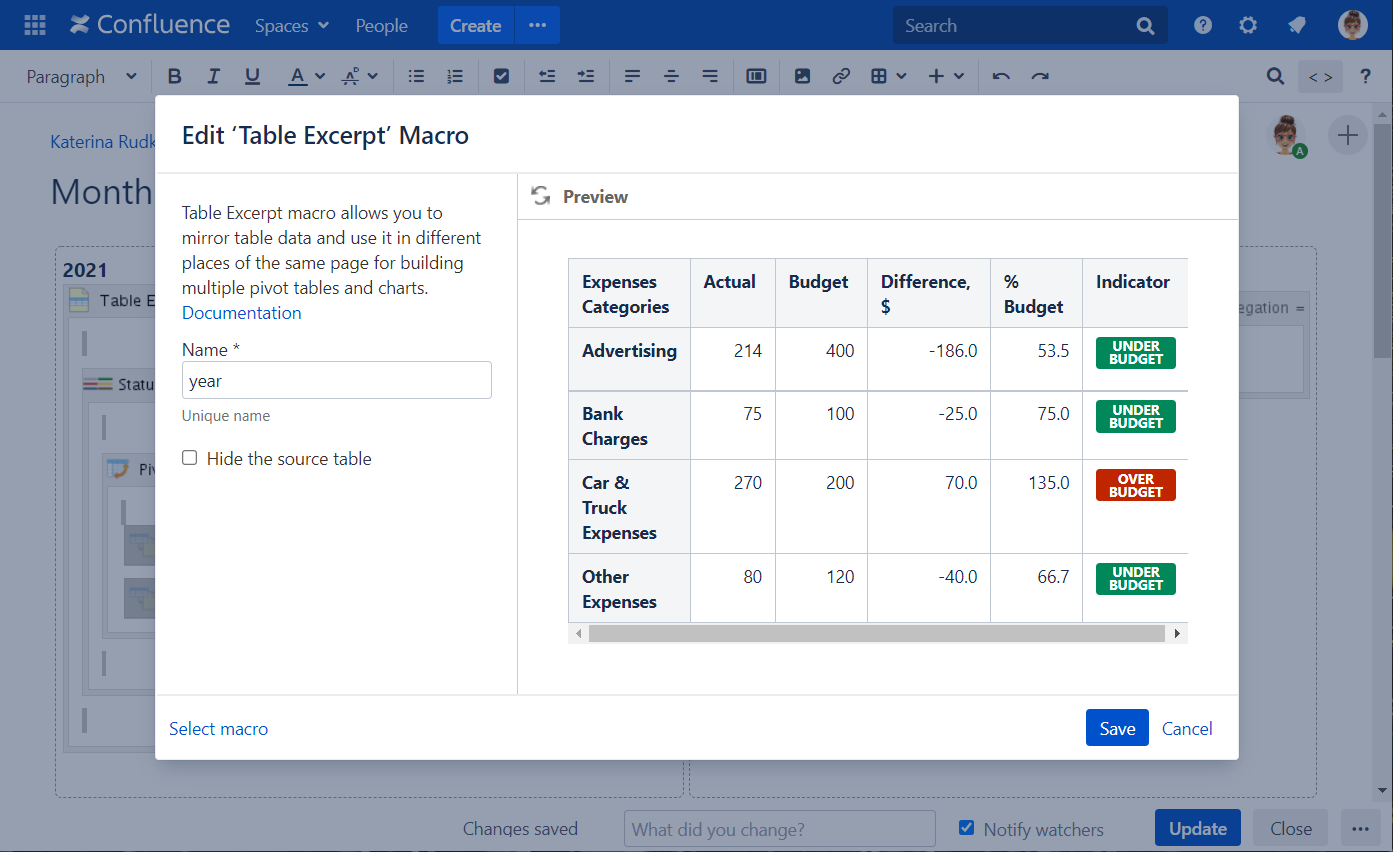
Table Excerpt:
Name
january
Name
february
Name
year
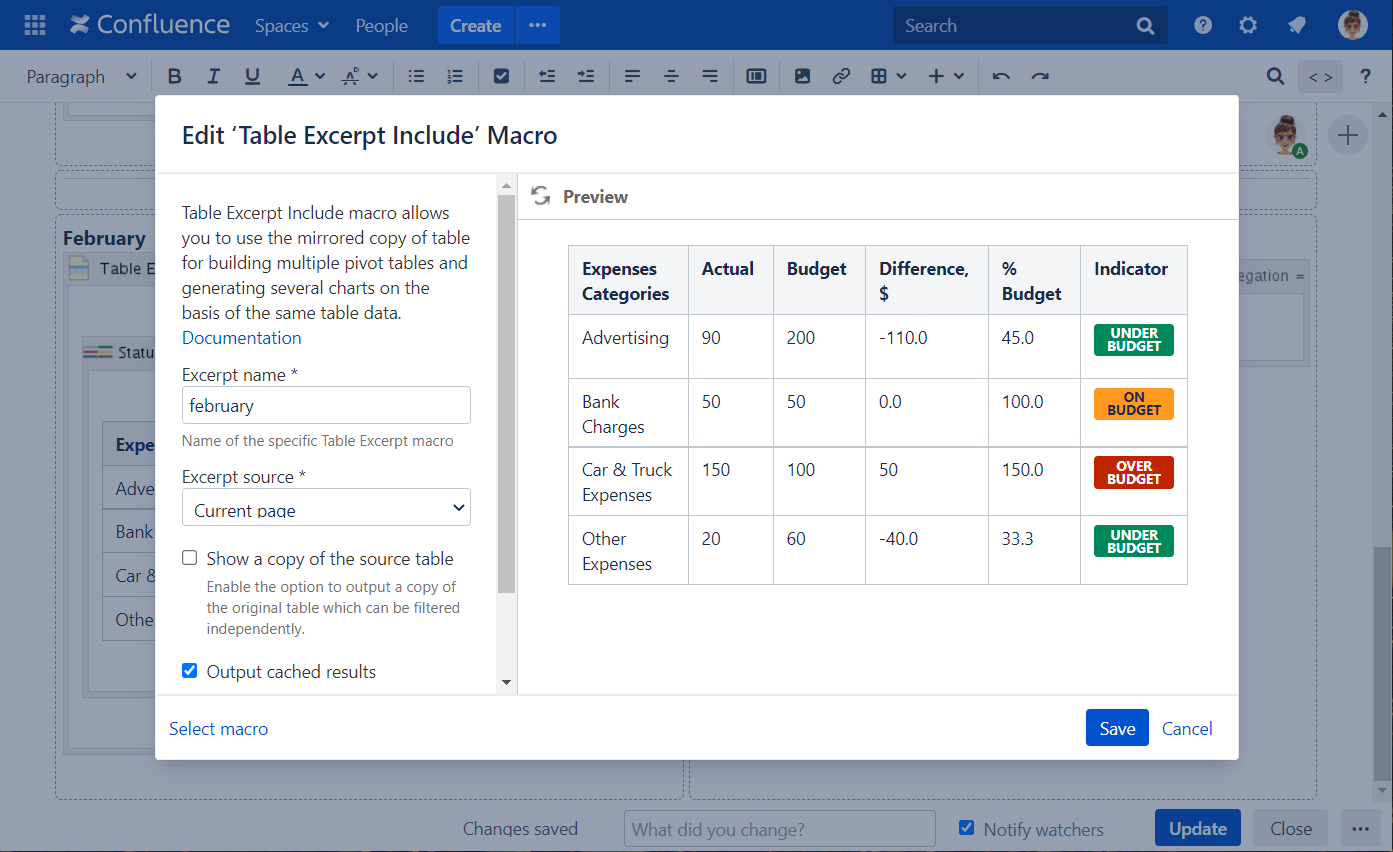
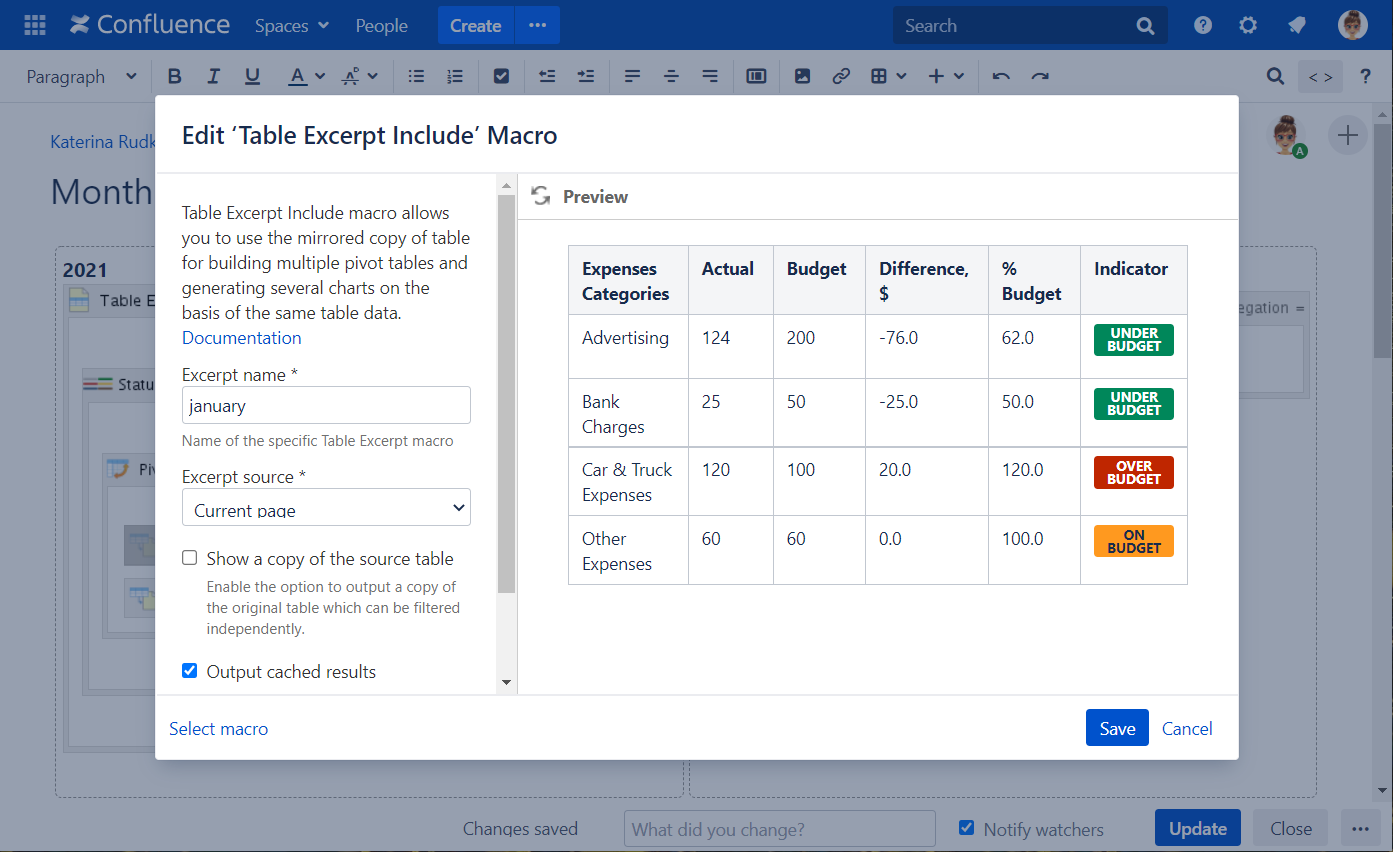
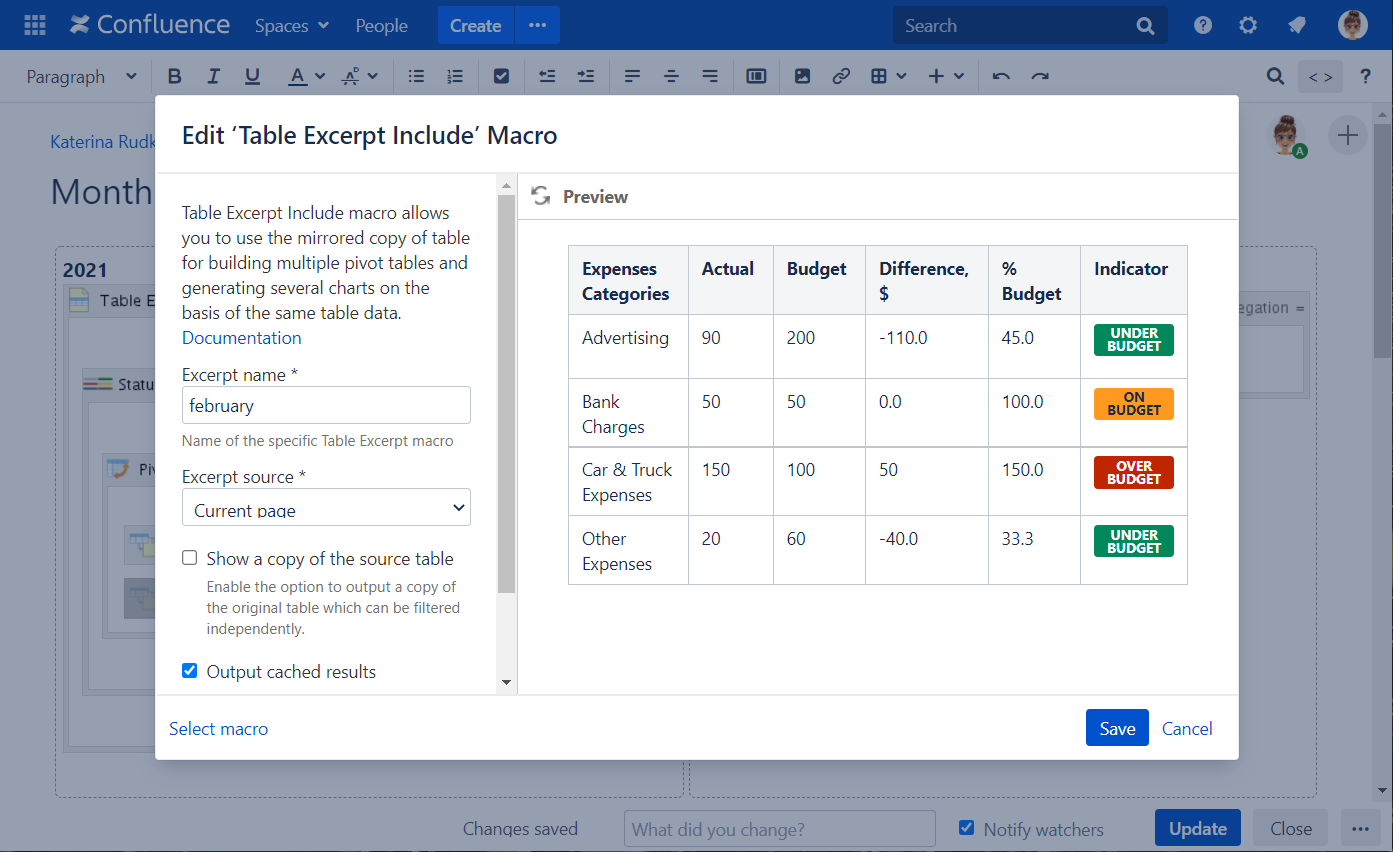
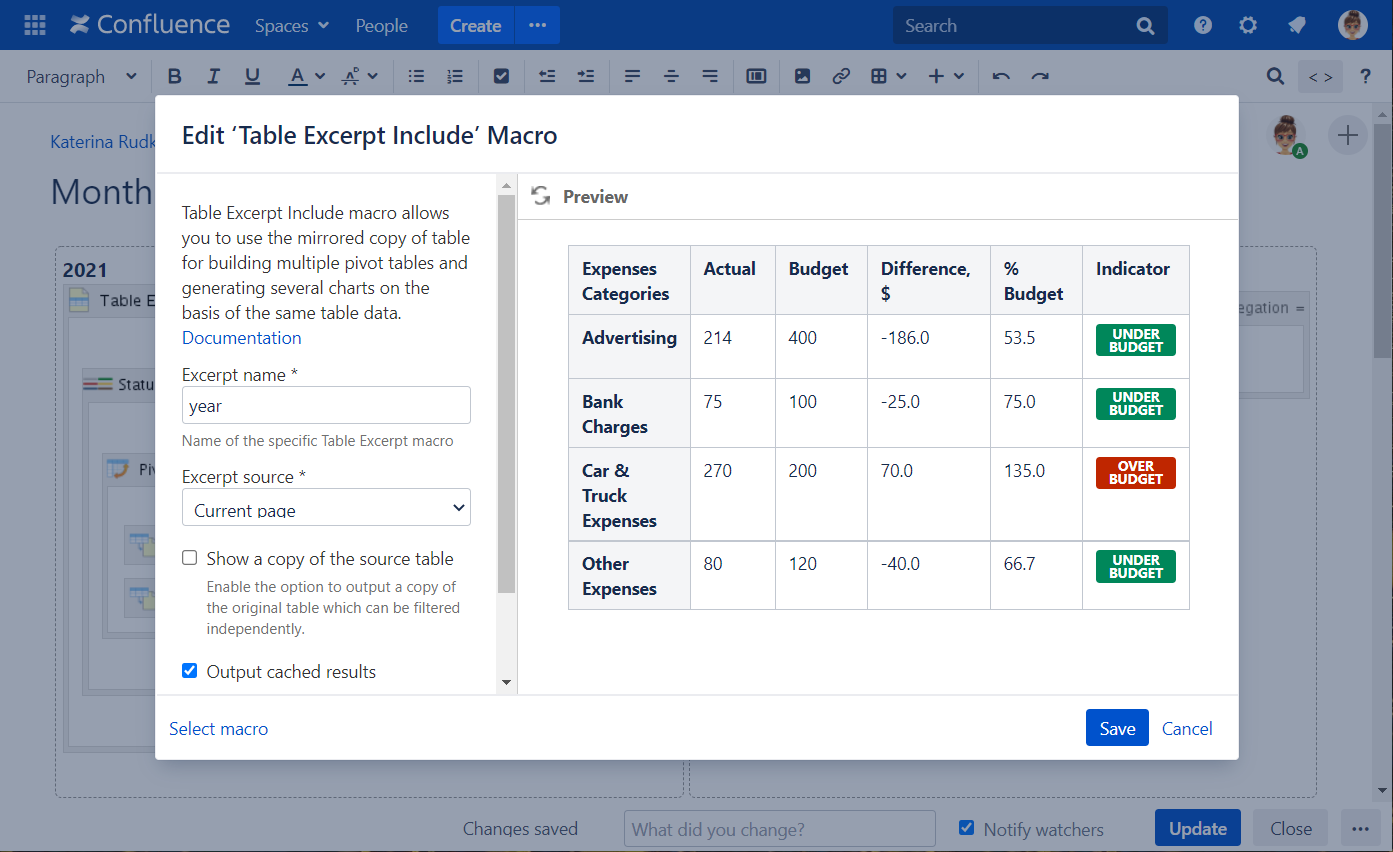
Table Excerpt Include:
Excerpt name
january
Excerpt source
Current page
Excerpt name
february
Excerpt source
Current page
Excerpt name
year
Excerpt source
Current page
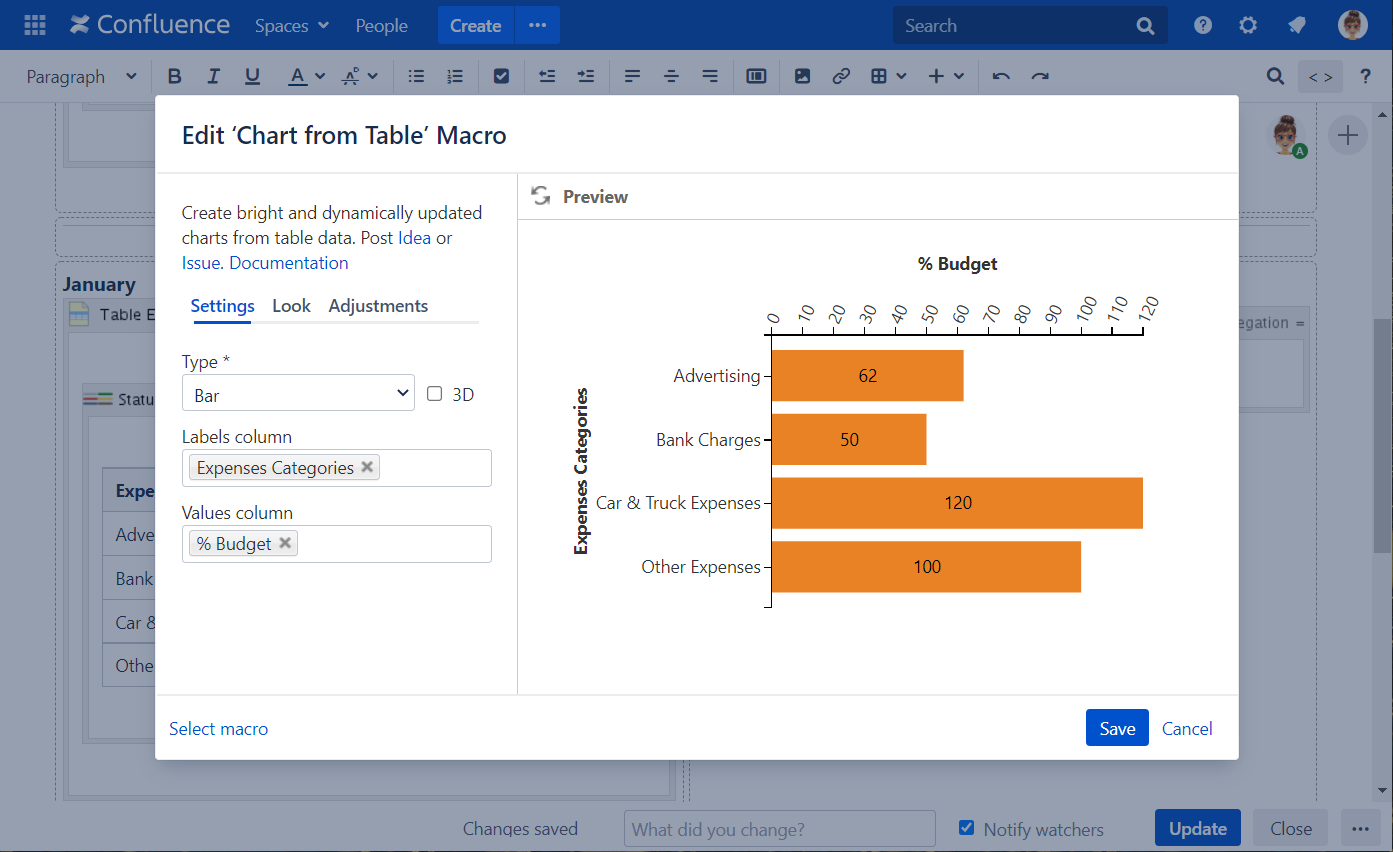
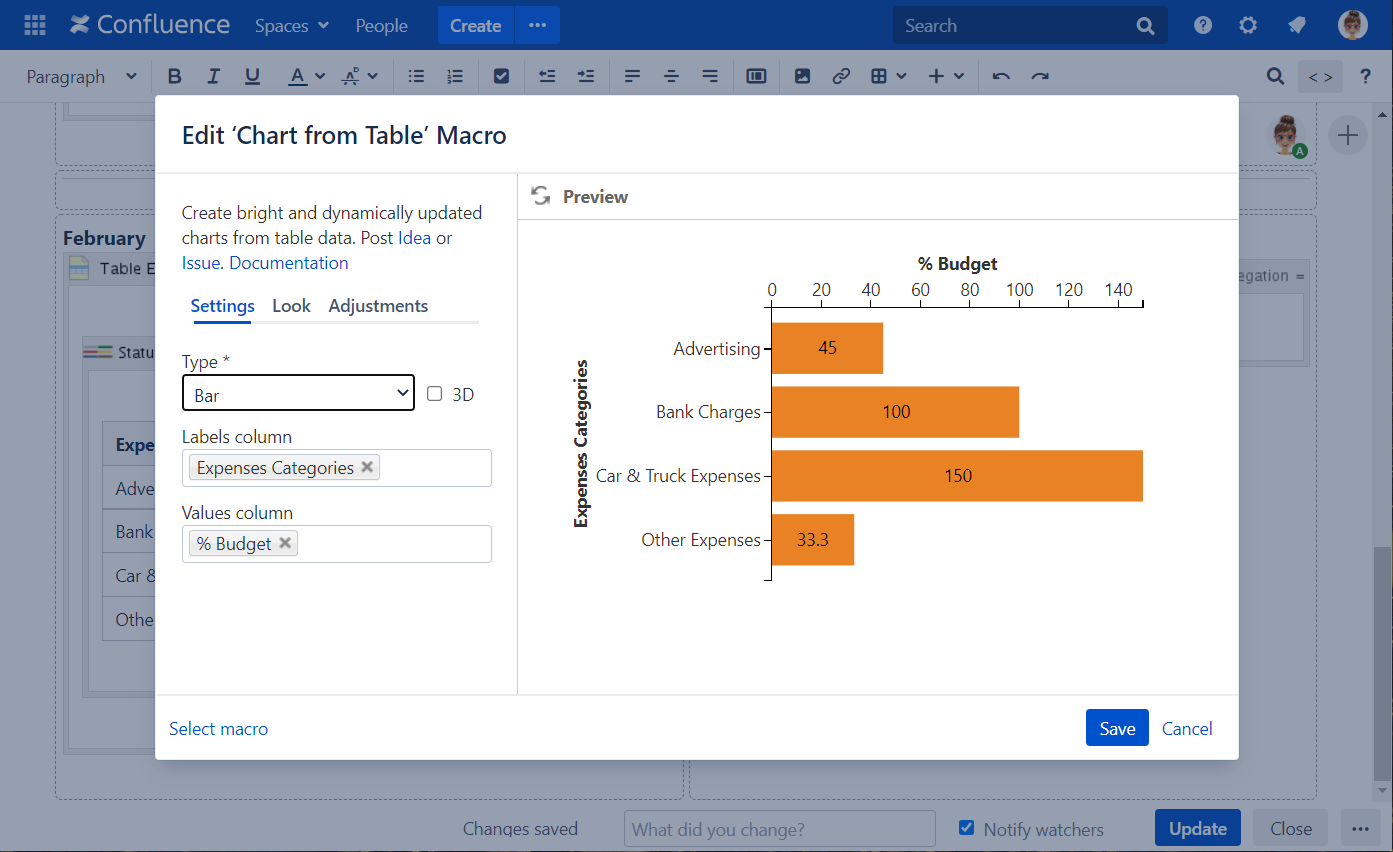
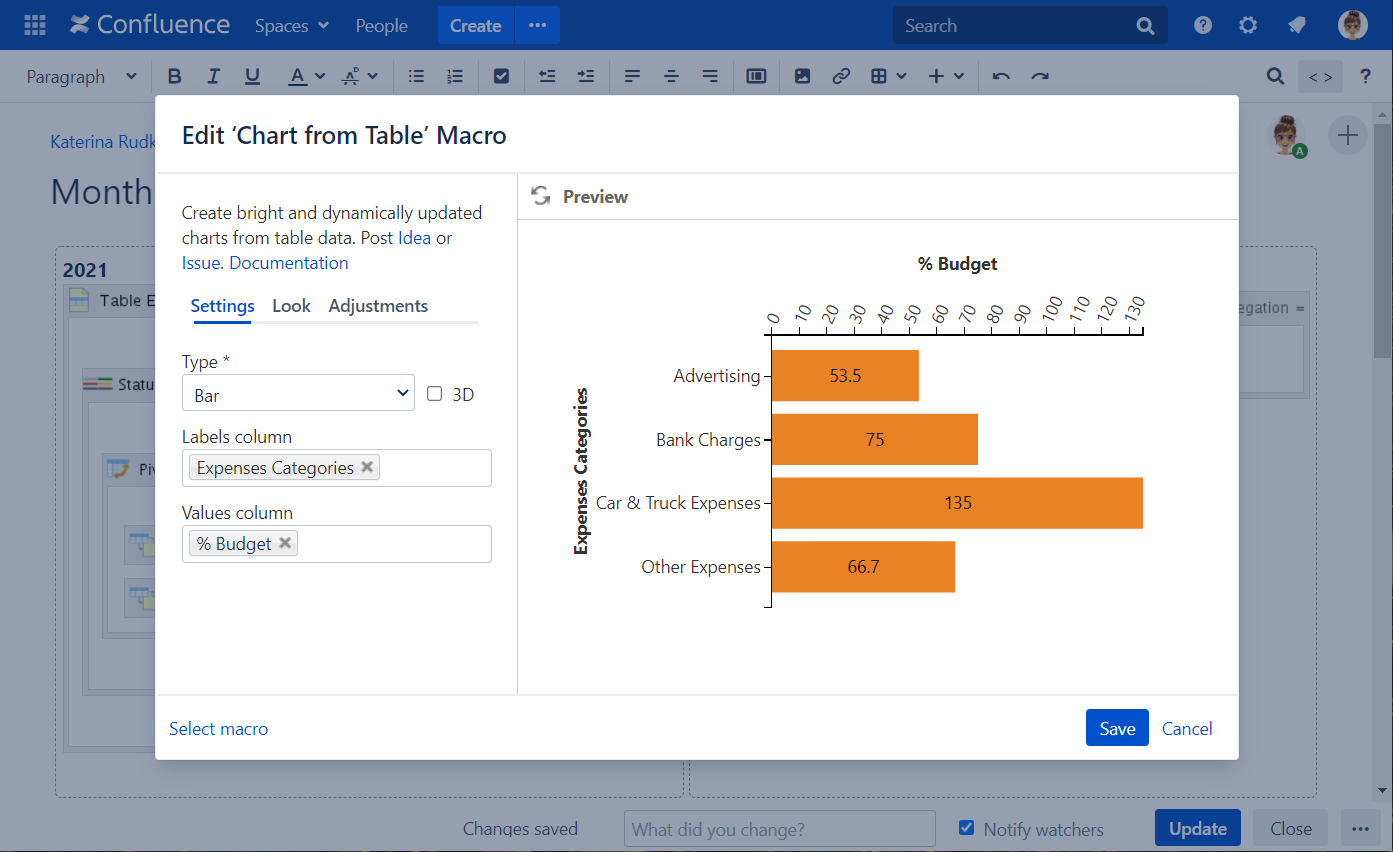
Chart from Table:
Type
Bar
Labels Column
Expenses Categories
Values Column
% Budget
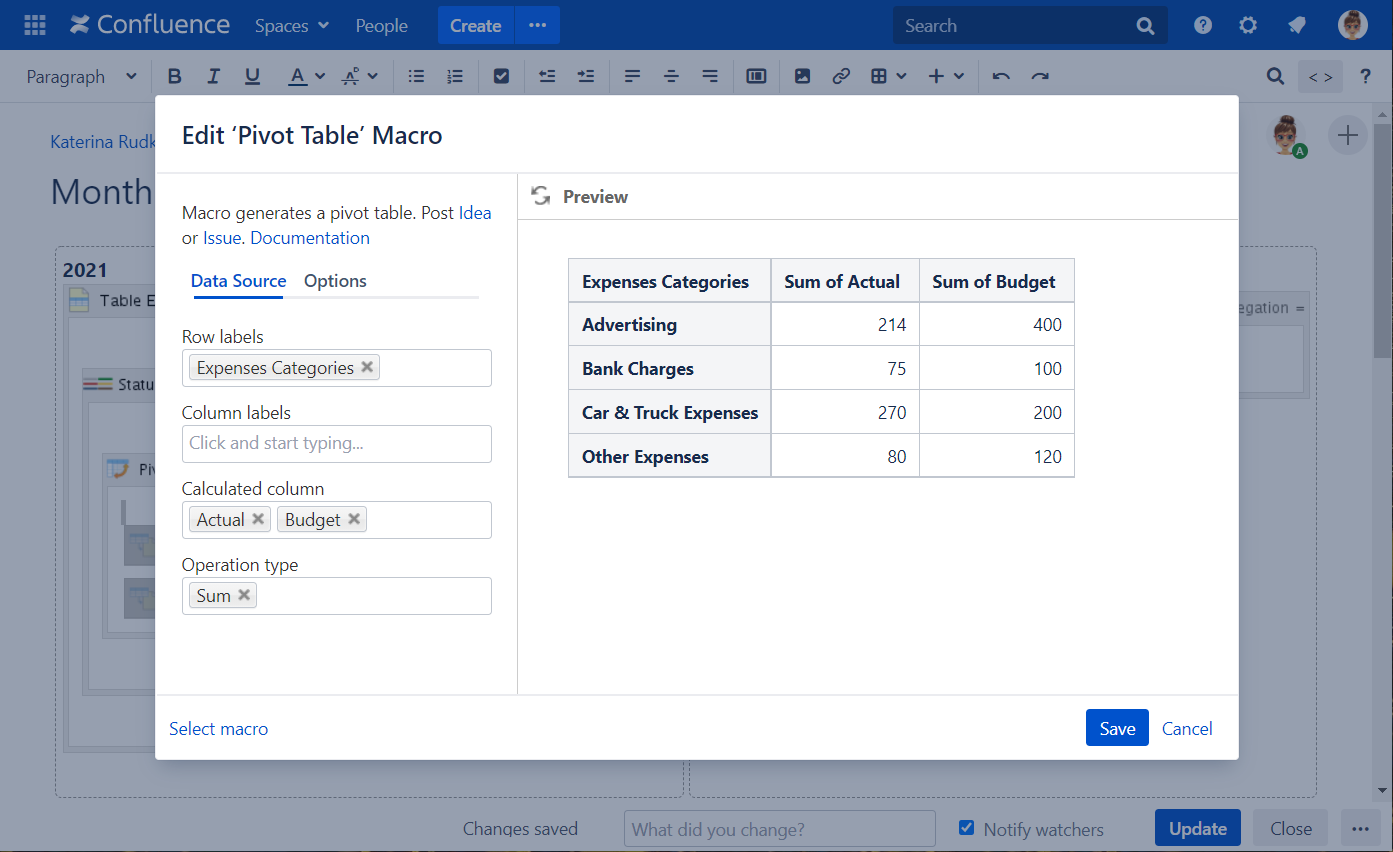
Pivot Table:
Row Labels
Expenses Categories
Column Labels
Calculated Column
Actual, Budget
Operation Type
Sum
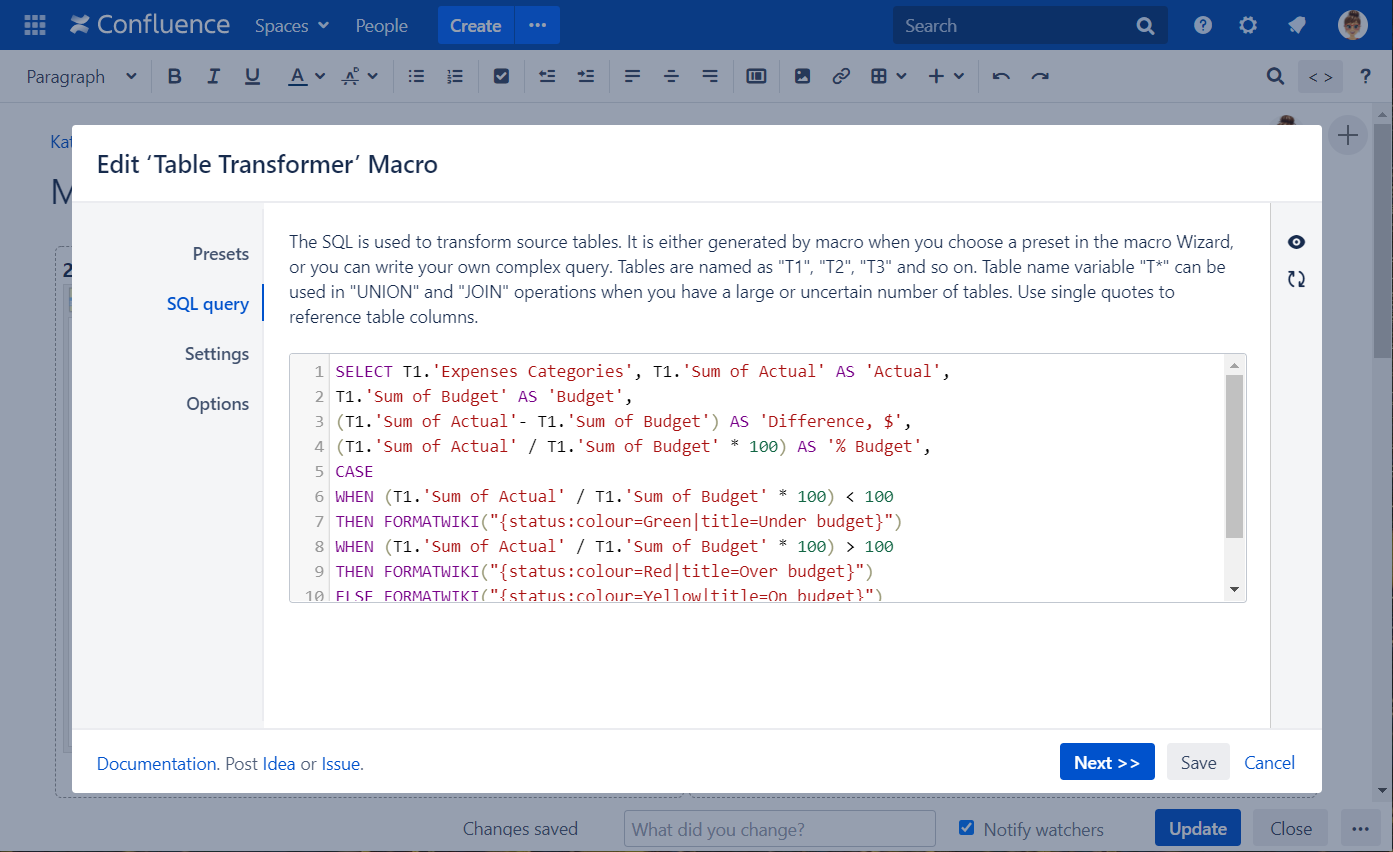
Table Transformer: Use the following SQL query ti sum data by months up:
SELECT T1.'Expenses Categories', T1.'Sum of Actual' AS 'Actual',
T1.'Sum of Budget' AS 'Budget',
(T1.'Sum of Actual'- T1.'Sum of Budget') AS 'Difference, $',
(T1.'Sum of Actual' / T1.'Sum of Budget' * 100) AS '% Budget',
CASE
WHEN (T1.'Sum of Actual' / T1.'Sum of Budget' * 100) < 100
THEN FORMATWIKI("{status:colour=Green|title=Under budget}")
WHEN (T1.'Sum of Actual' / T1.'Sum of Budget' * 100) > 100
THEN FORMATWIKI("{status:colour=Red|title=Over budget}")
ELSE FORMATWIKI("{status:colour=Yellow|title=On budget}")
END AS 'Indicator'
FROM T*
CODE
SOME TEXT HERE SOME TEXT HERE
SOME TEXT HERE SOME TEXT HERE
Cookie Notice
This website uses cookies for analytics, personalization and advertising. By continuing to browse, you agree to our use of cookies. Learn more