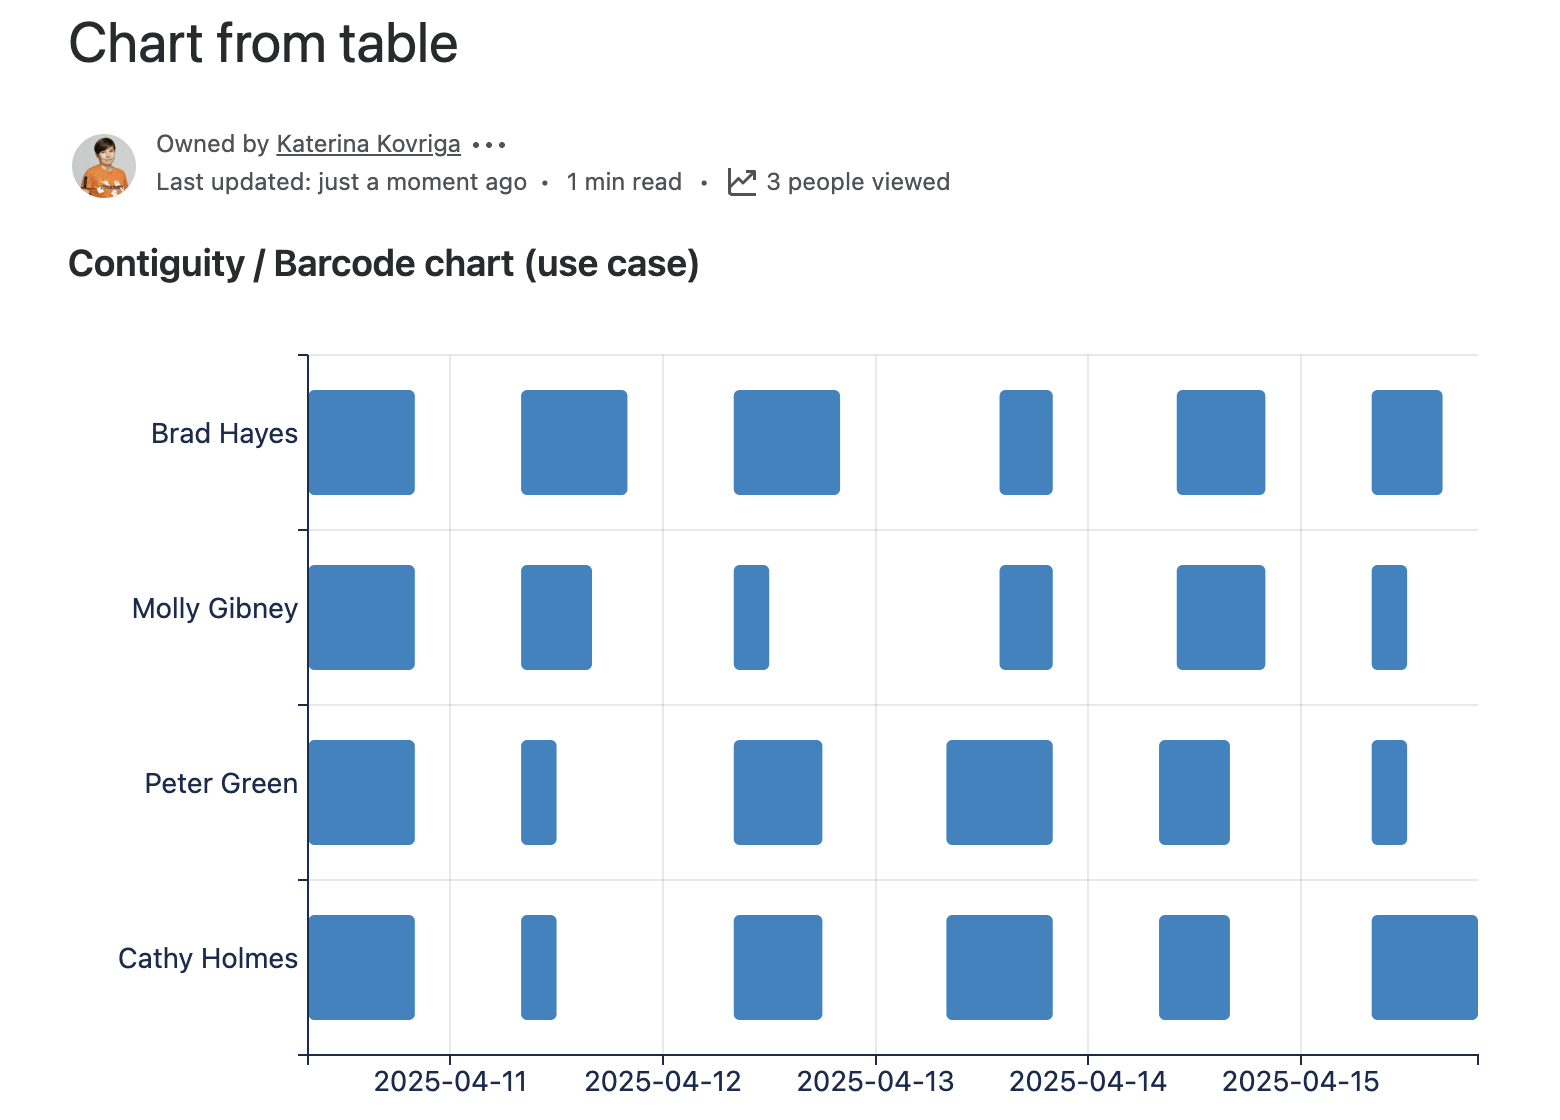
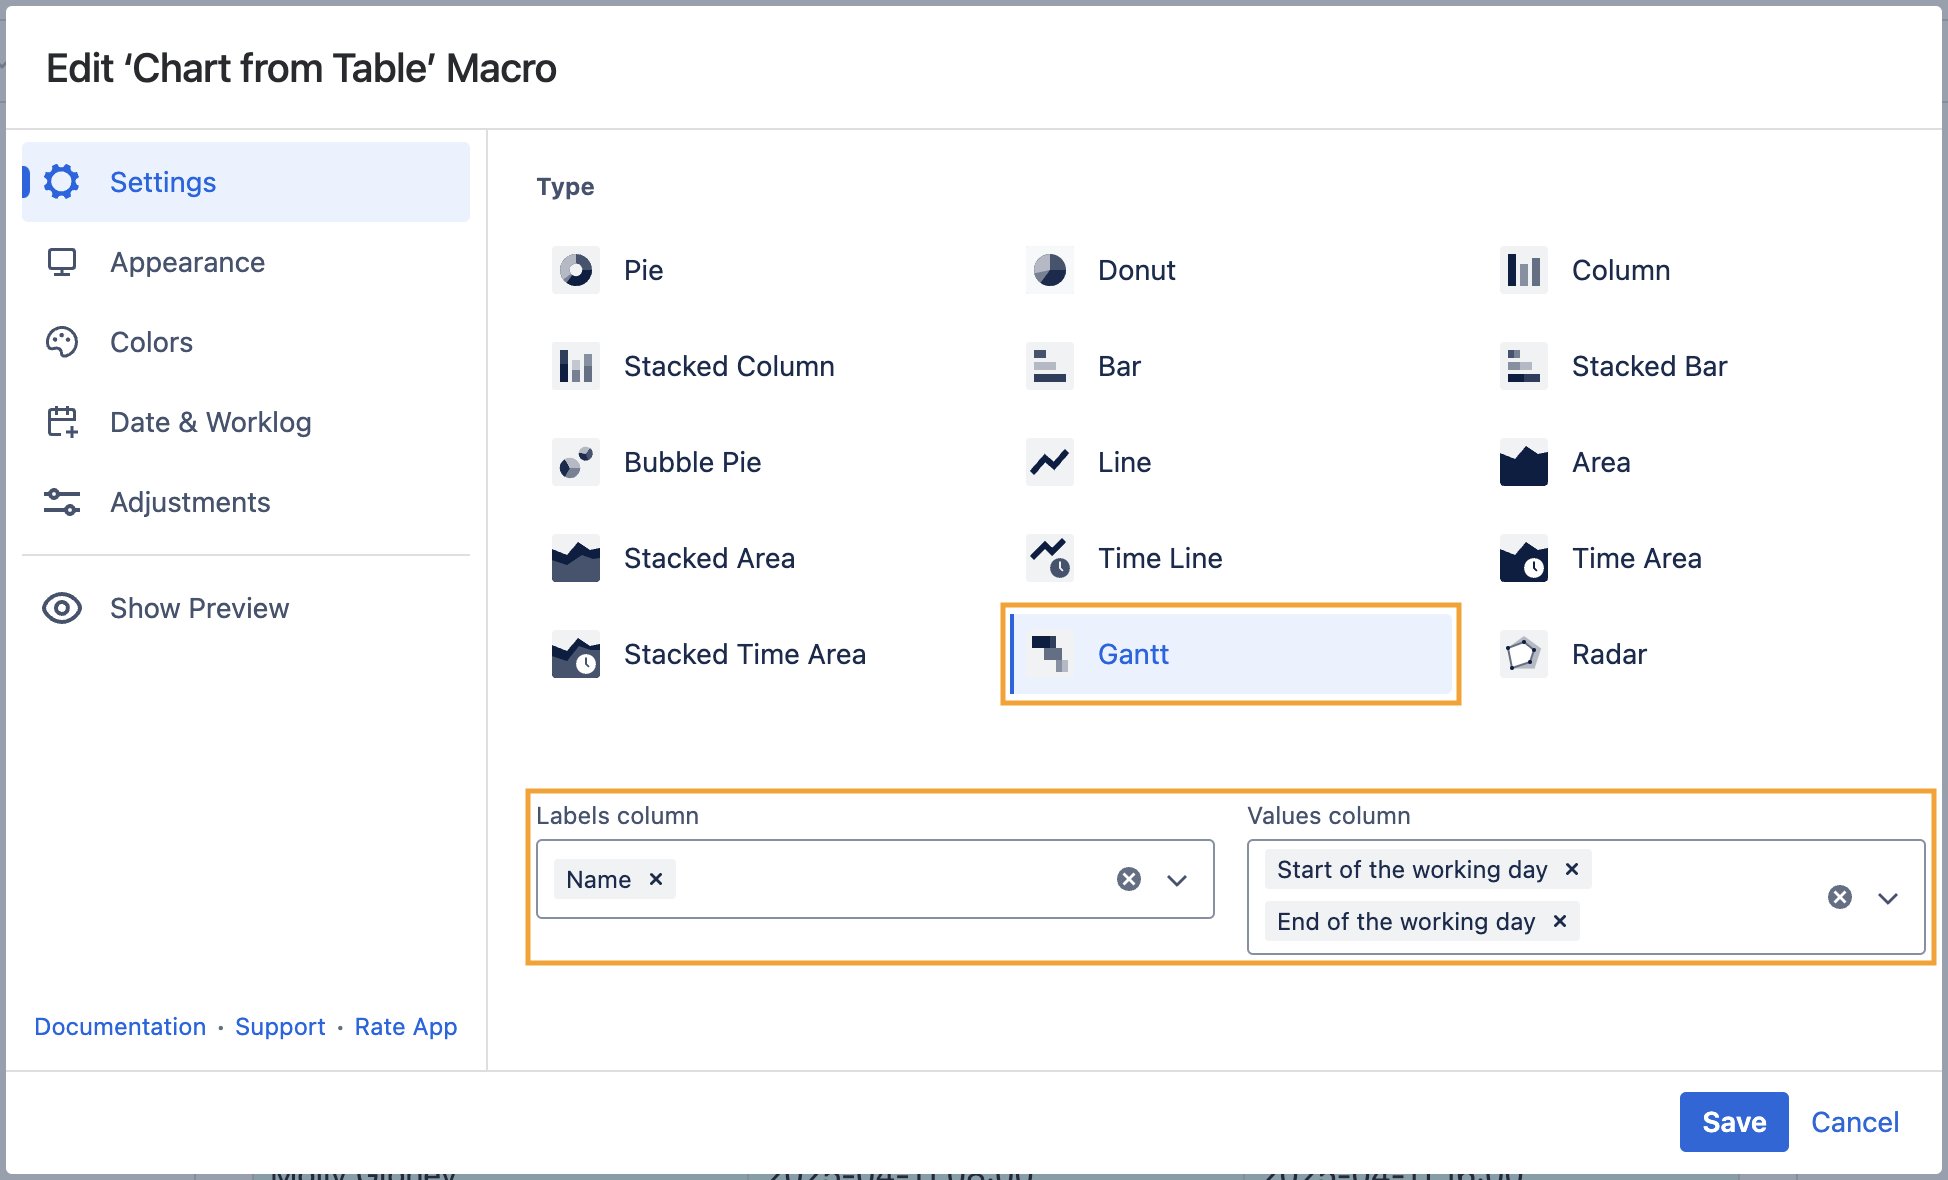
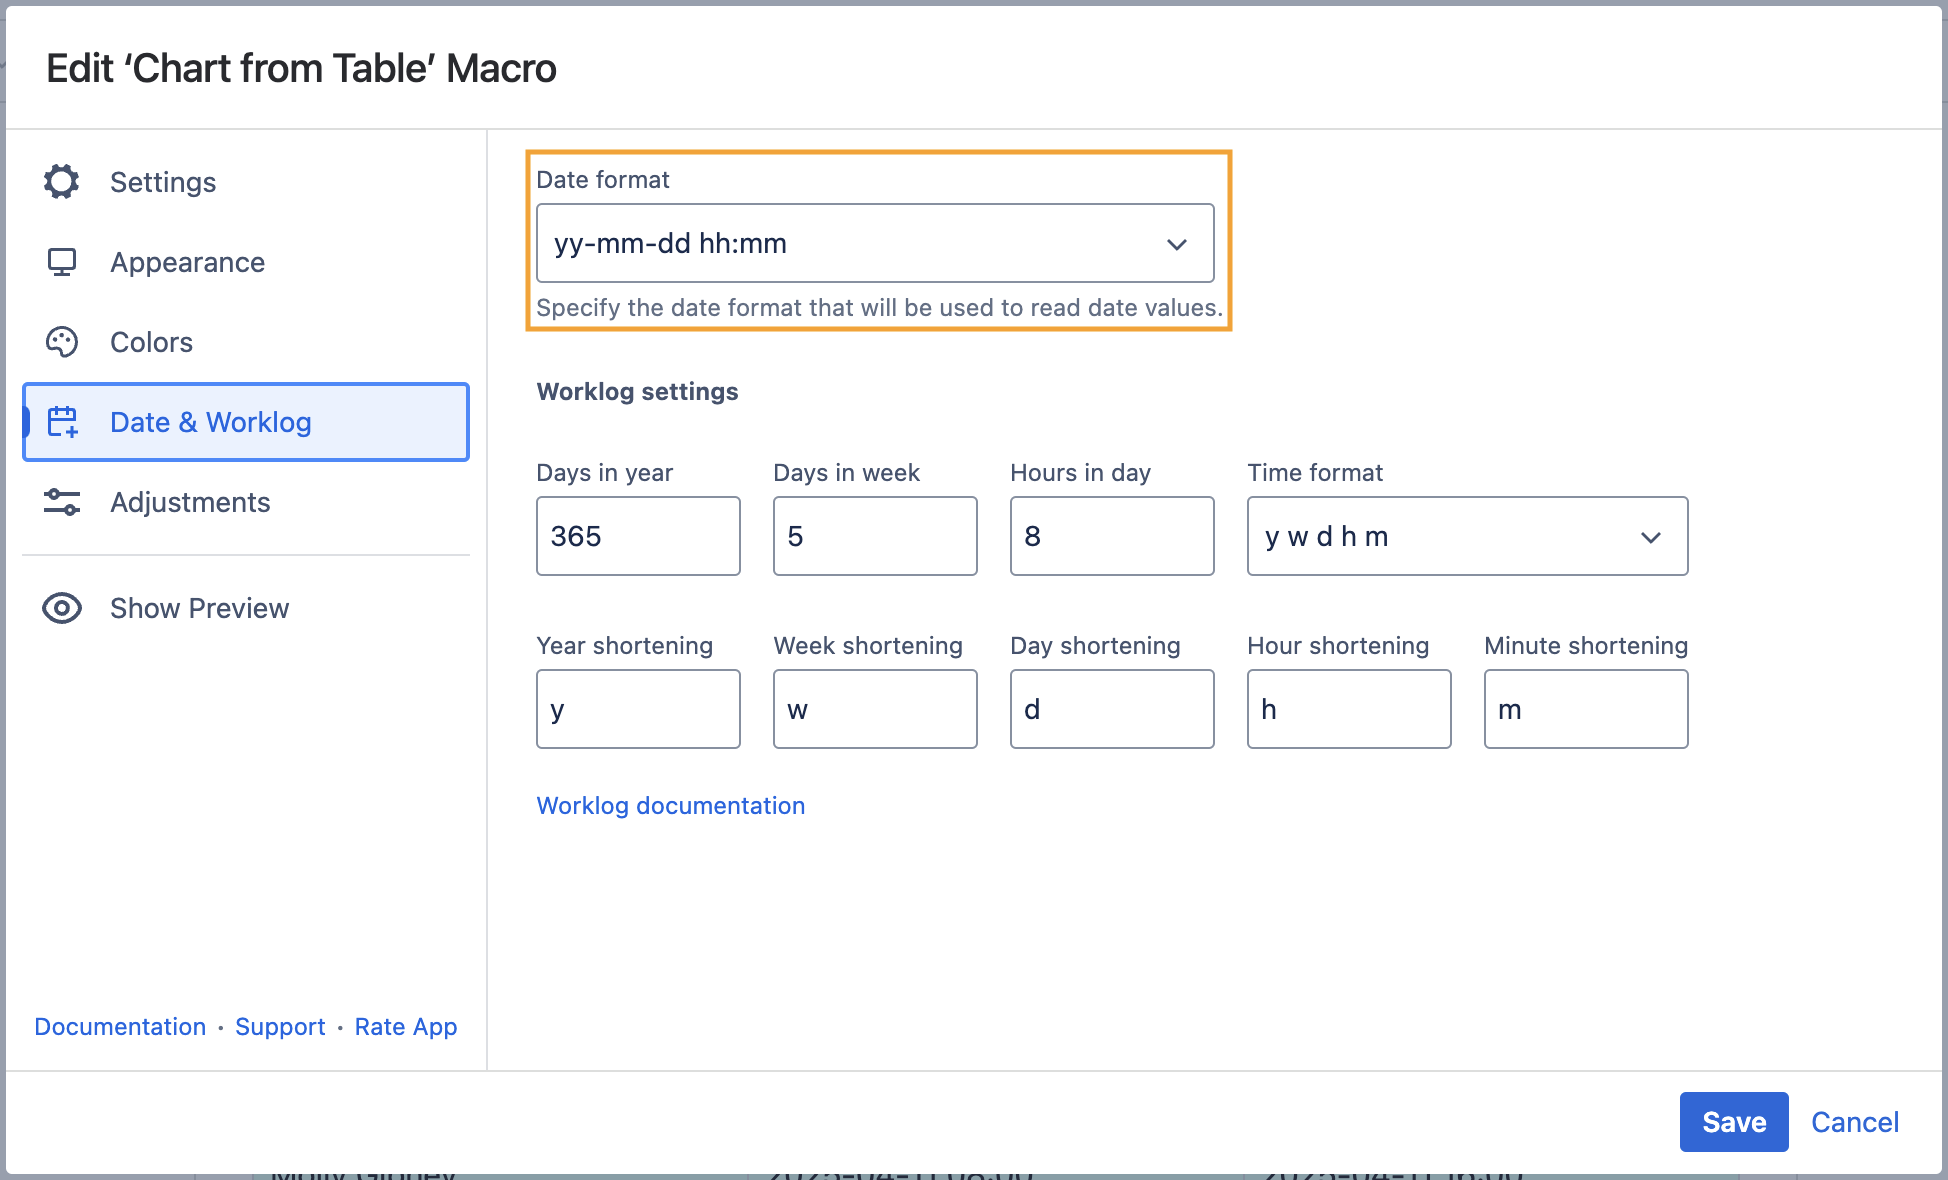
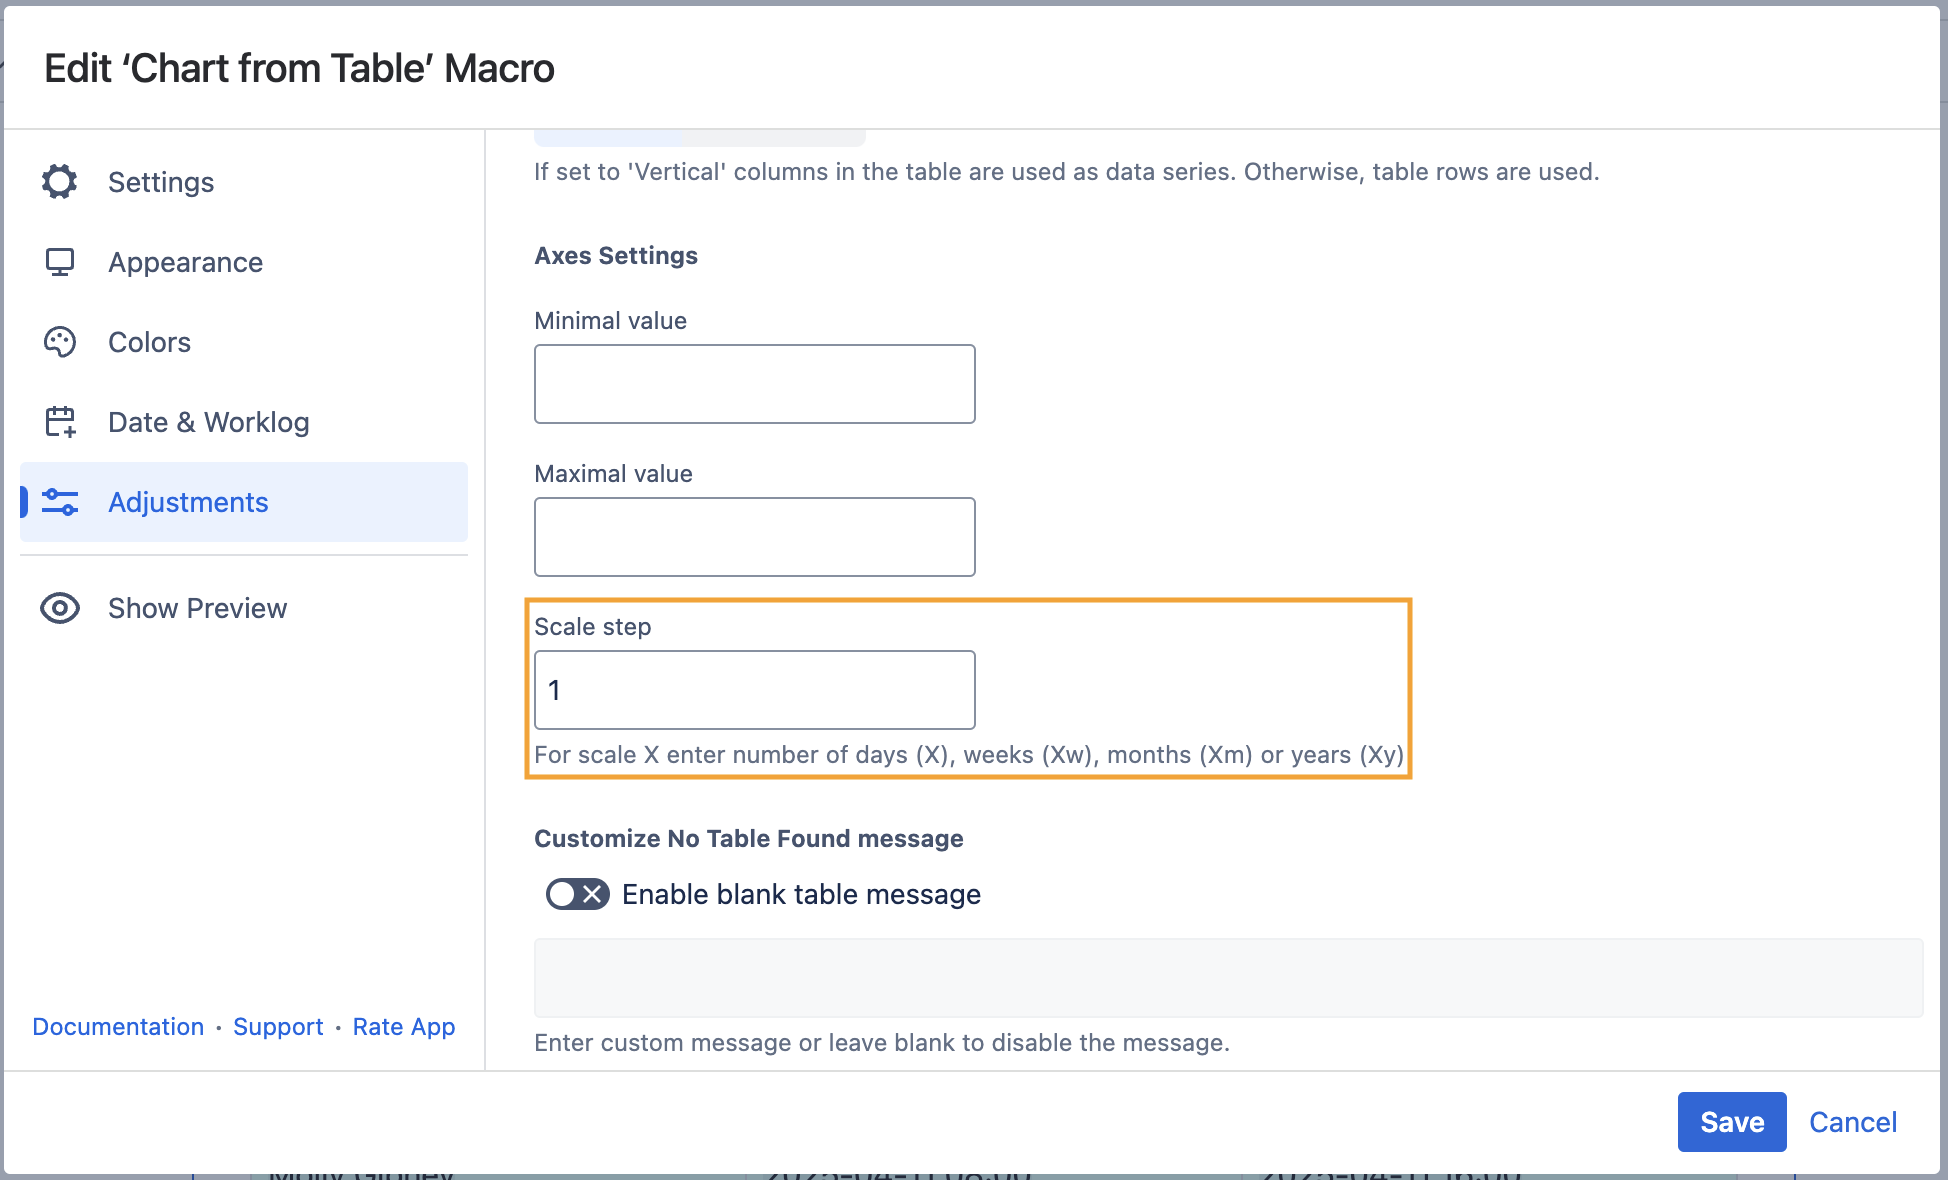
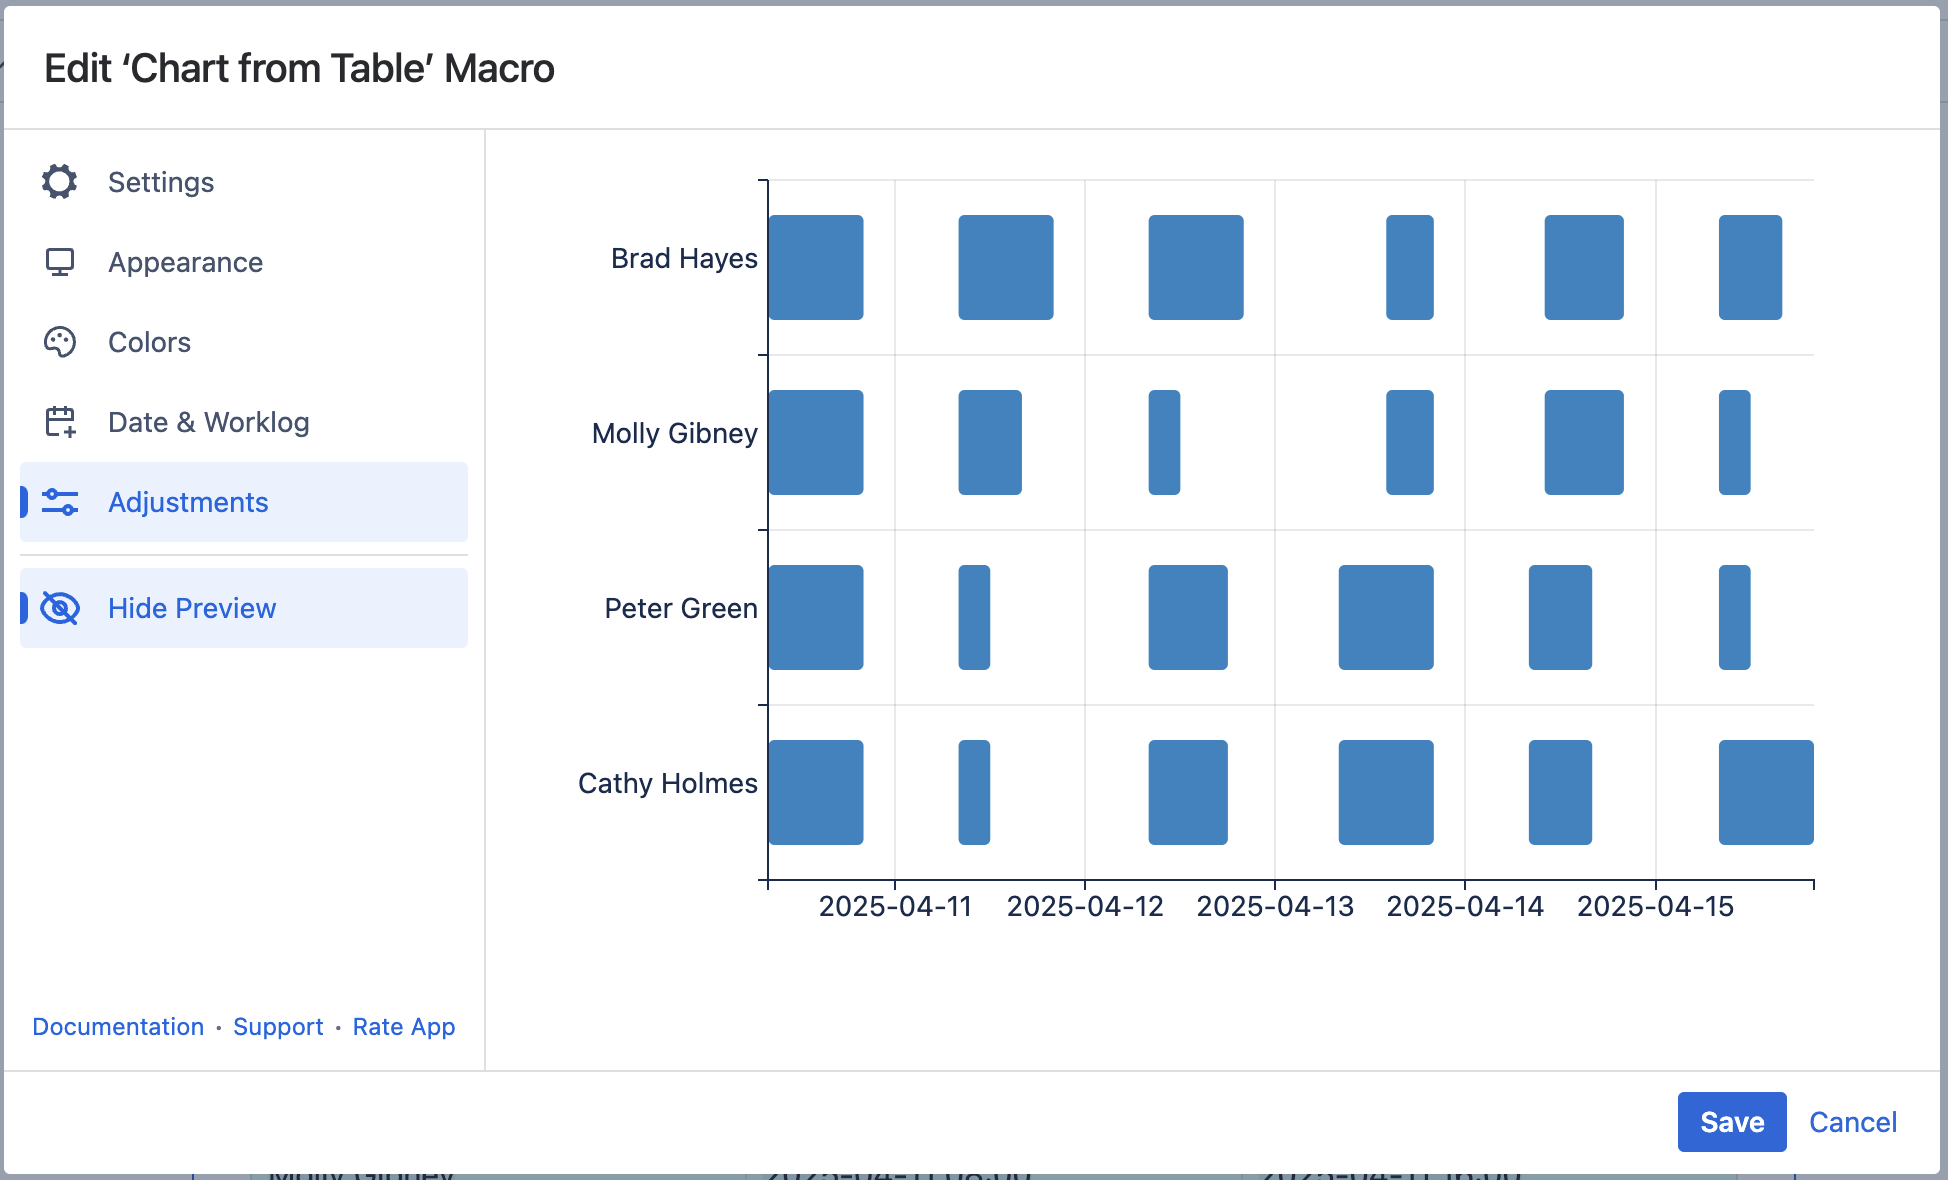
Table Filter, Charts & Spreadsheets for Confluence User guide Chart from Table Current: Contiguity / Barcode chart (use case) PDF Download PDF Download page Contiguity / Barcode chart (use case). Current page All pages Contiguity / Barcode chart (use case) You can build a Contiguity or Barcode chart with the help of the Gantt chart type. Use caseYou have a table with columns containing names of employees, the start and the end of working hours day by day.You are going to build a chart with time ranges of daily working hours shown according to an employee's name. Source tableYour source table looks like the table below. NameStart of the working dayEnd of the working dayBrad Hayes2025-04-10 08:002025-04-10 20:00Molly Gibney2025-04-10 08:002025-04-10 20:00Peter Green2025-04-10 08:002025-04-10 20:00Cathy Holmes2025-04-10 08:002025-04-10 20:00Brad Hayes2025-04-11 08:002025-04-11 20:00Molly Gibney2025-04-11 08:002025-04-11 16:00Peter Green2025-04-11 08:002025-04-11 12:00Cathy Holmes2025-04-11 08:002025-04-11 12:00Brad Hayes2025-04-12 08:002025-04-12 20:00Molly Gibney2025-04-12 08:002025-04-12 12:00Peter Green2025-04-12 08:002025-04-12 18:00Cathy Holmes2025-04-12 08:002025-04-12 18:00Brad Hayes2025-04-13 14:002025-04-13 20:00Molly Gibney2025-04-13 14:002025-04-13 20:00Peter Green2025-04-13 08:002025-04-13 20:00Cathy Holmes2025-04-13 08:002025-04-13 20:00Brad Hayes2025-04-14 10:002025-04-14 20:00Molly Gibney2025-04-14 10:002025-04-14 20:00Peter Green2025-04-14 08:002025-04-14 16:00Cathy Holmes2025-04-14 08:002025-04-14 16:00Brad Hayes2025-04-15 08:002025-04-15 16:00Molly Gibney2025-04-15 08:002025-04-15 12:00Peter Green2025-04-15 08:002025-04-15 12:00Cathy Holmes2025-04-15 08:002025-04-15 20:00 SolutionWrap the table with the Chart from Table macro.Choose the Gantt chart type.Set the required Labels and Values columns.Specify the correct Date format and other options if needed. ×