Download PDF
Download page Radar (Spider) chart type.
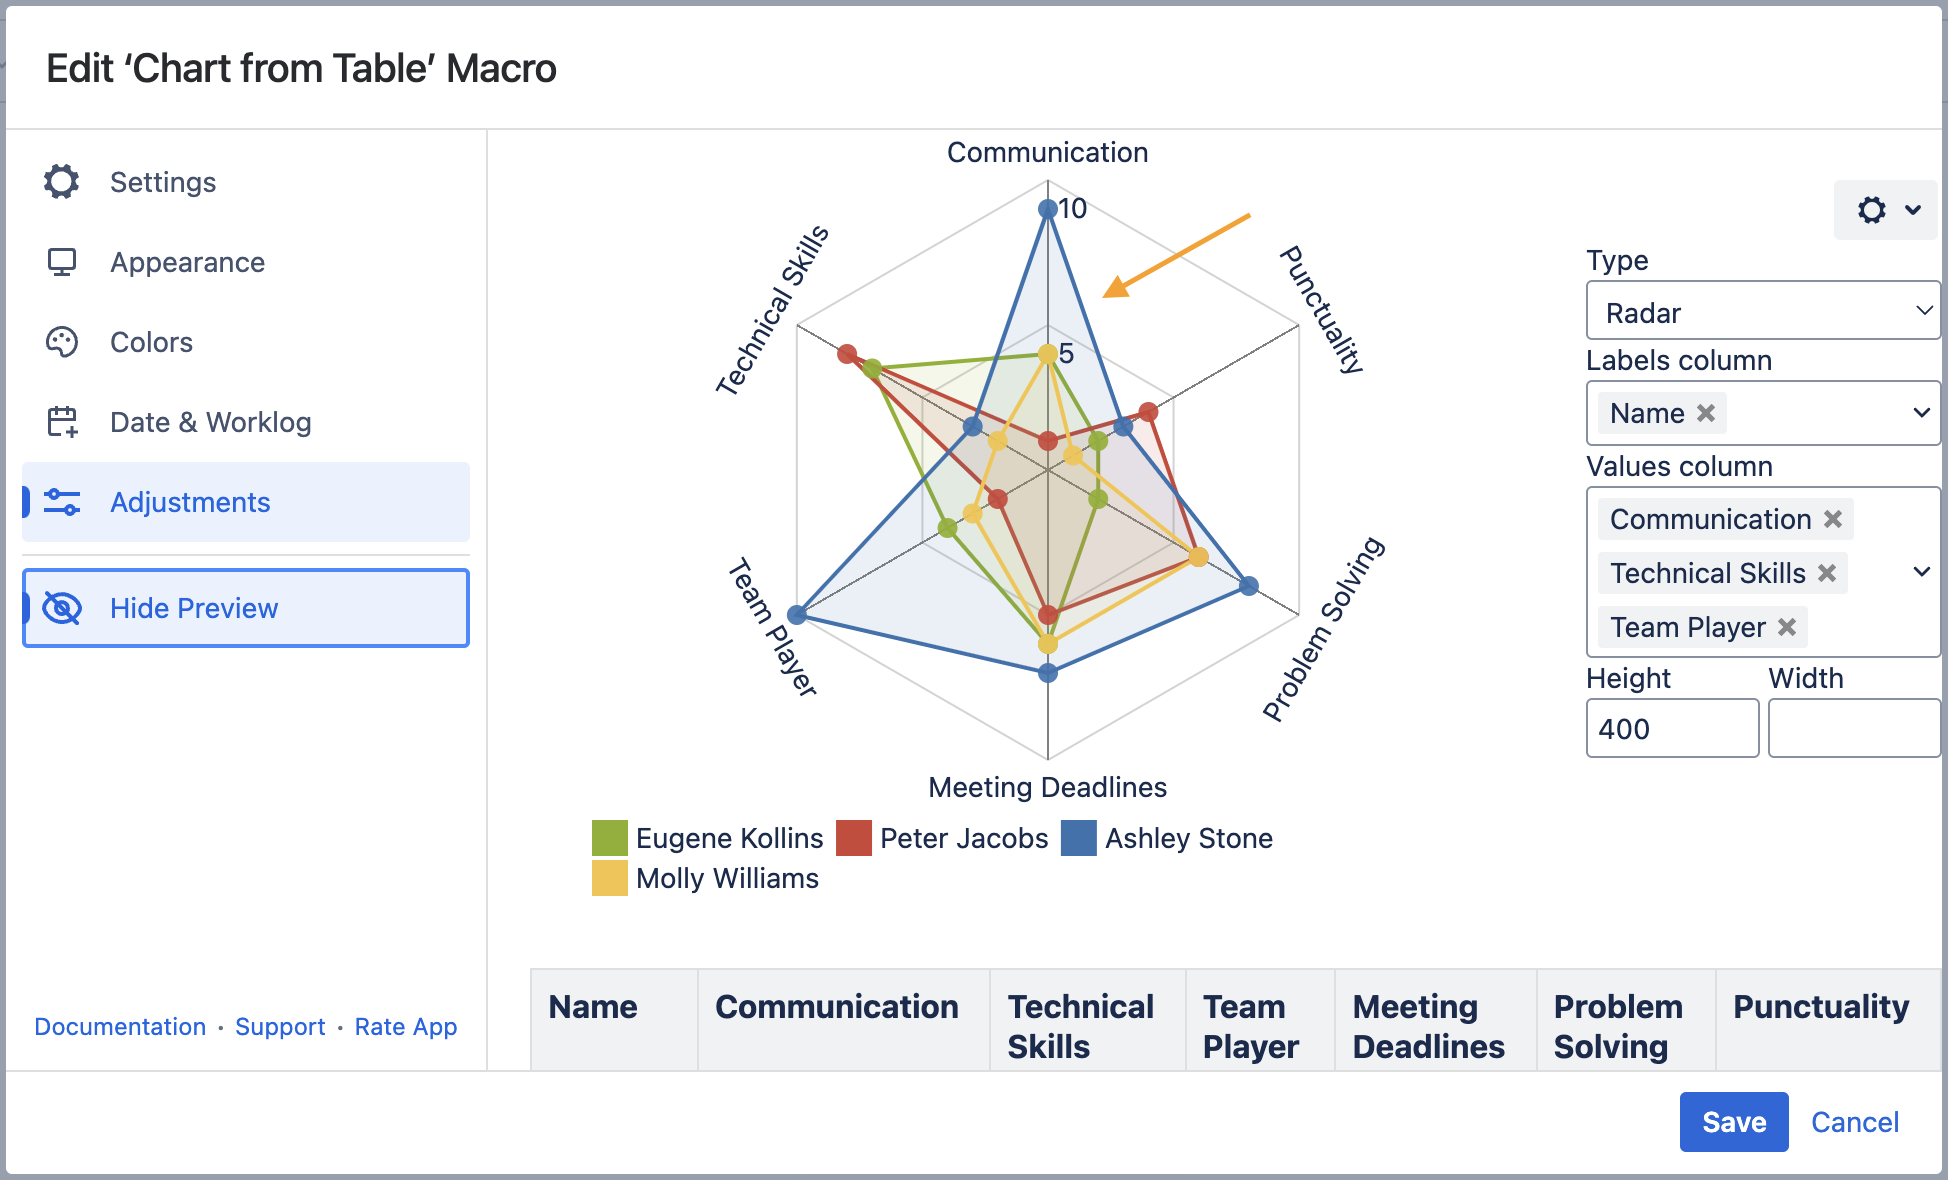
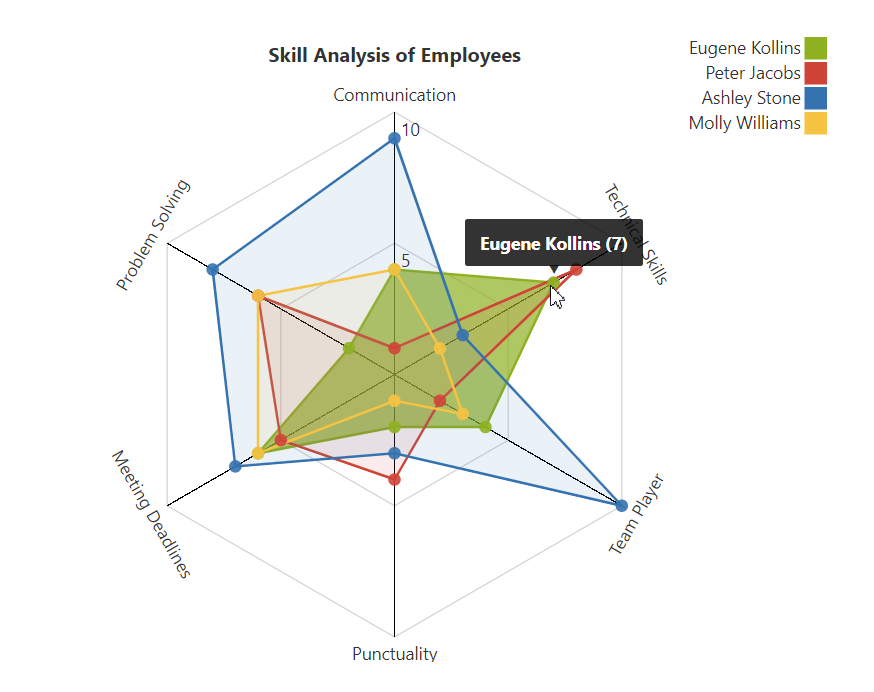
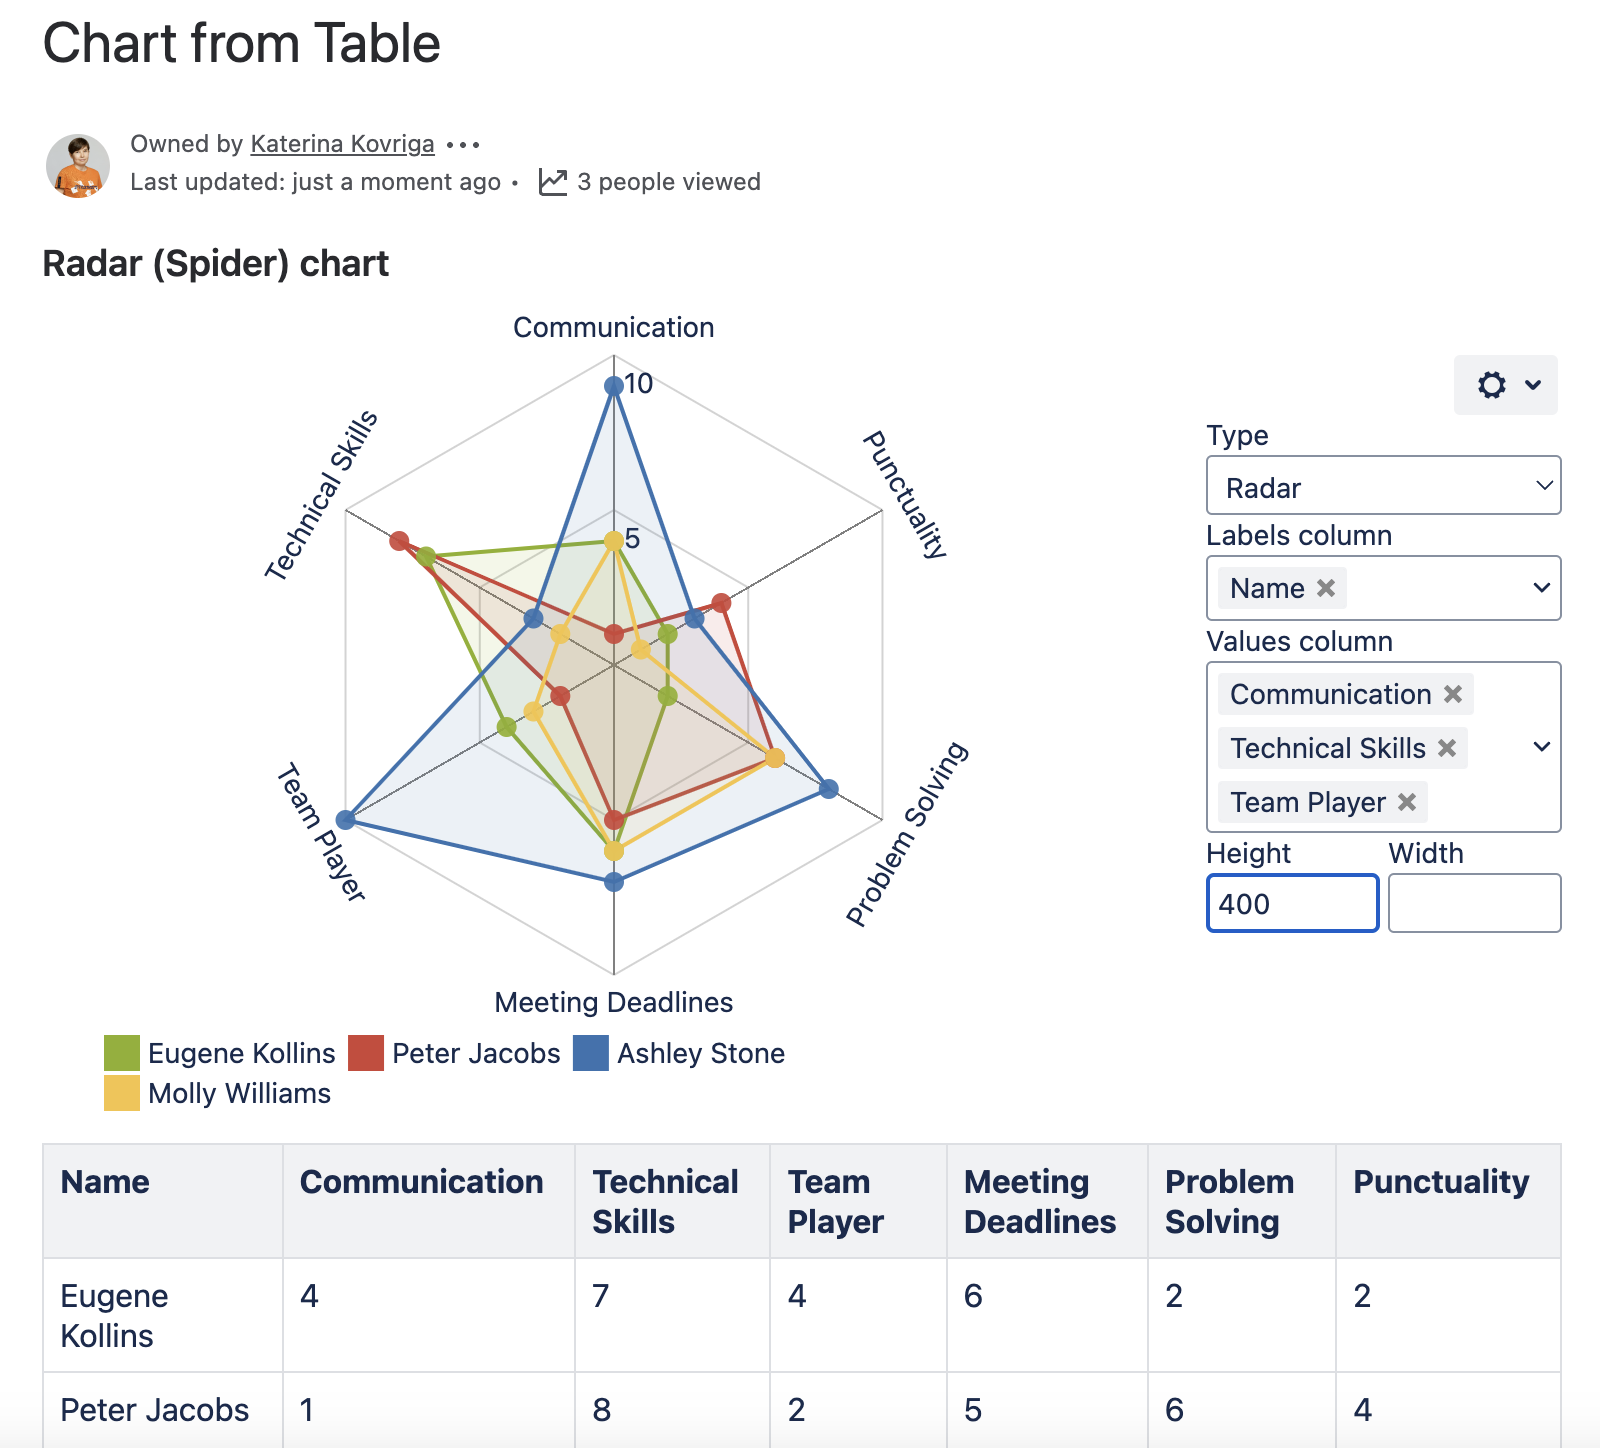
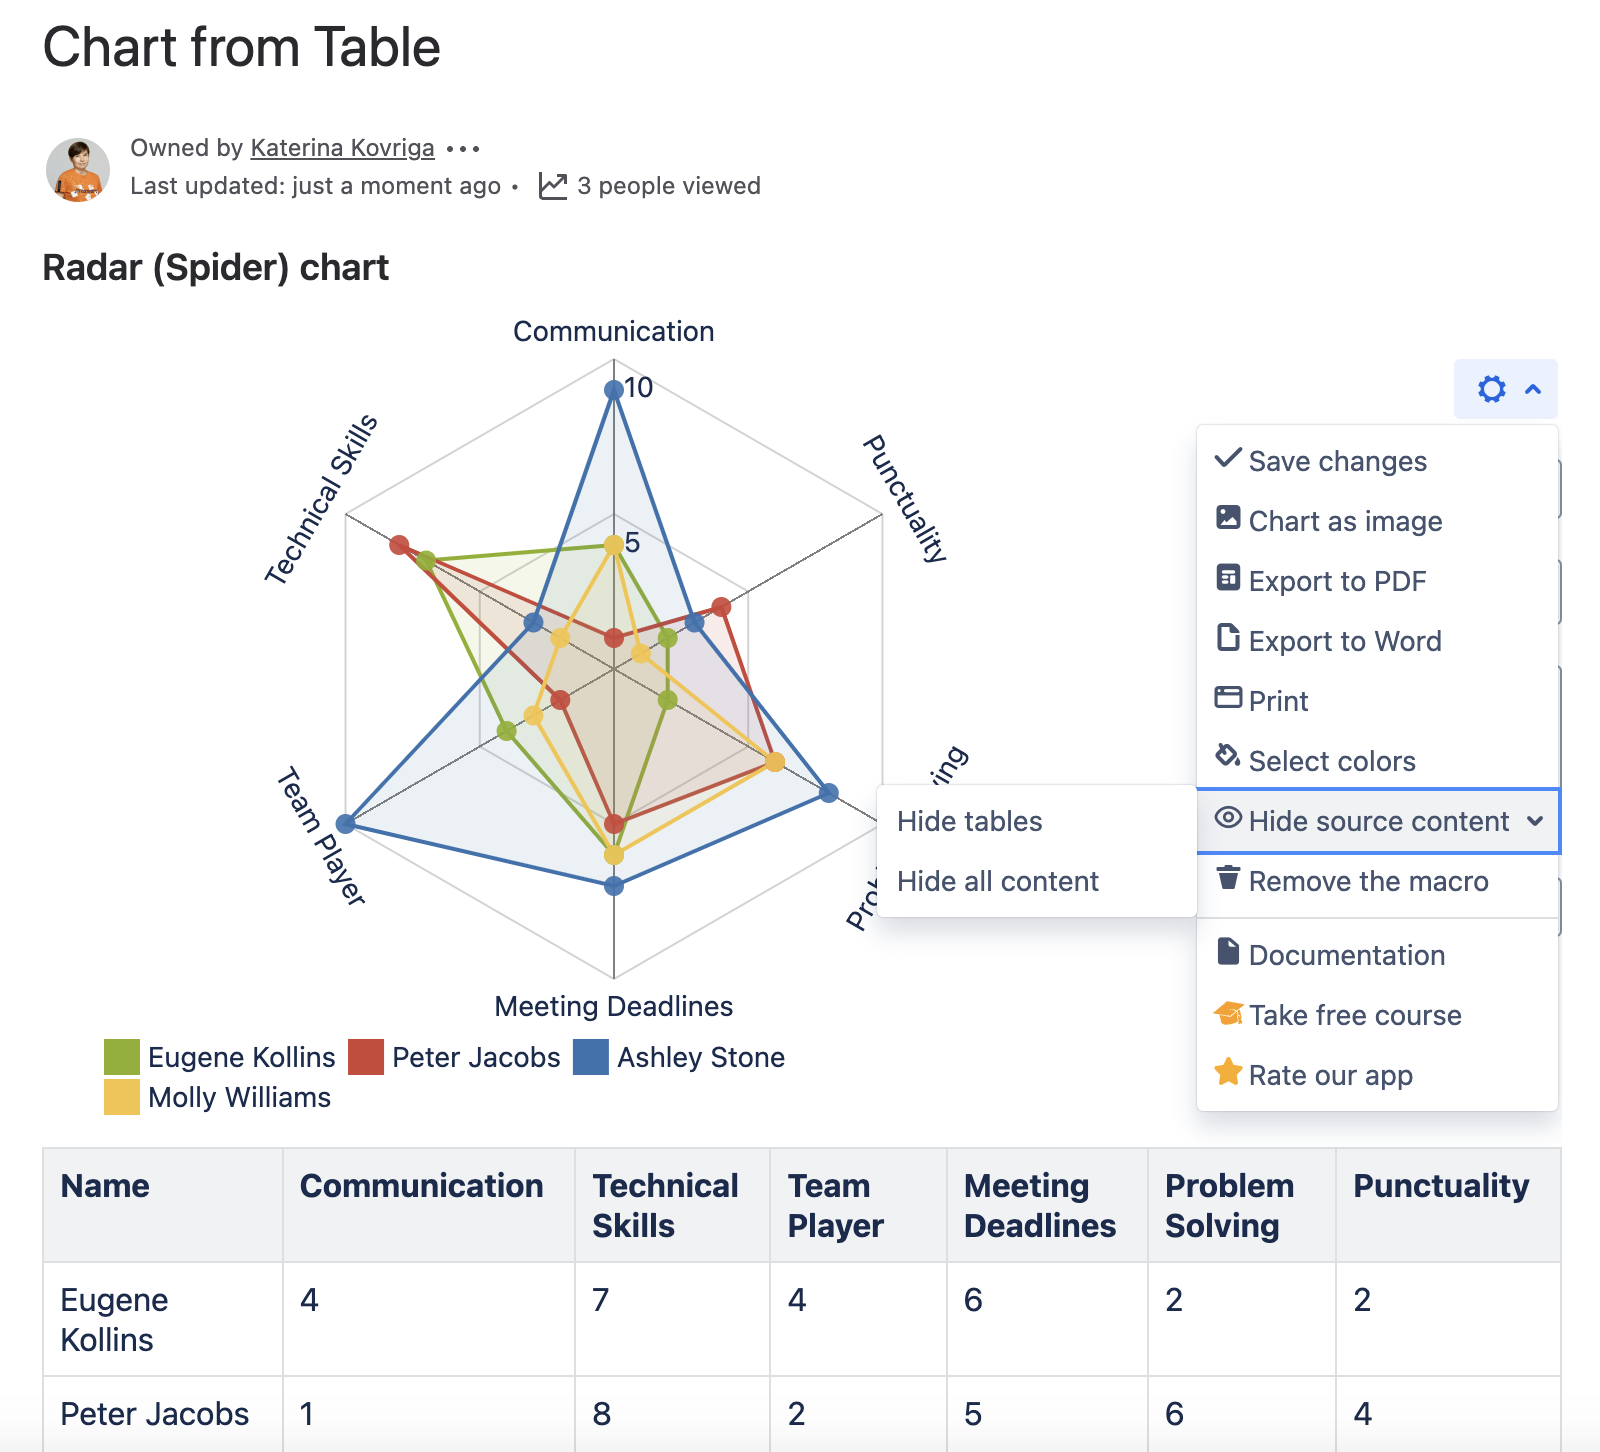
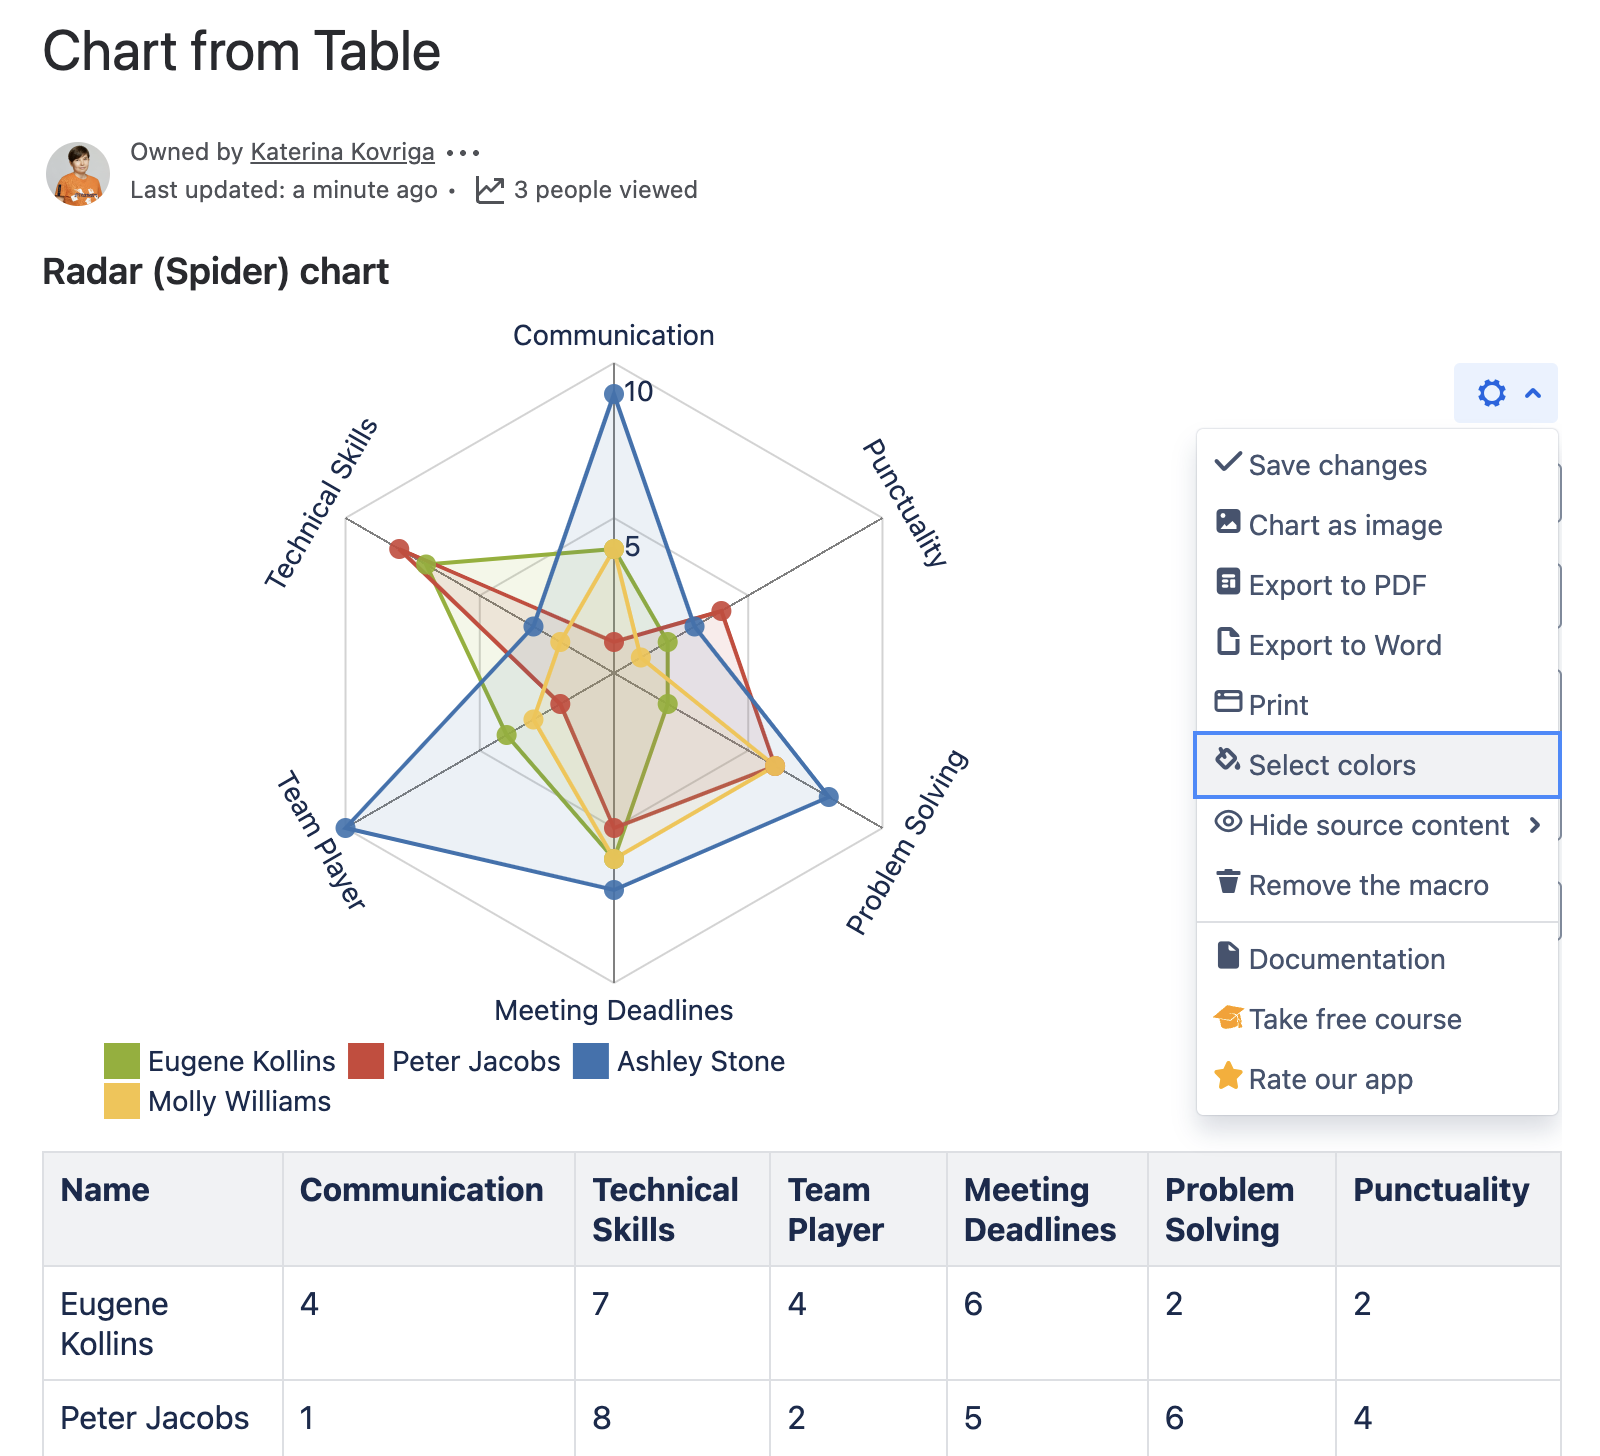
Radar (Spider) chart type
Overview
Rendered Chart
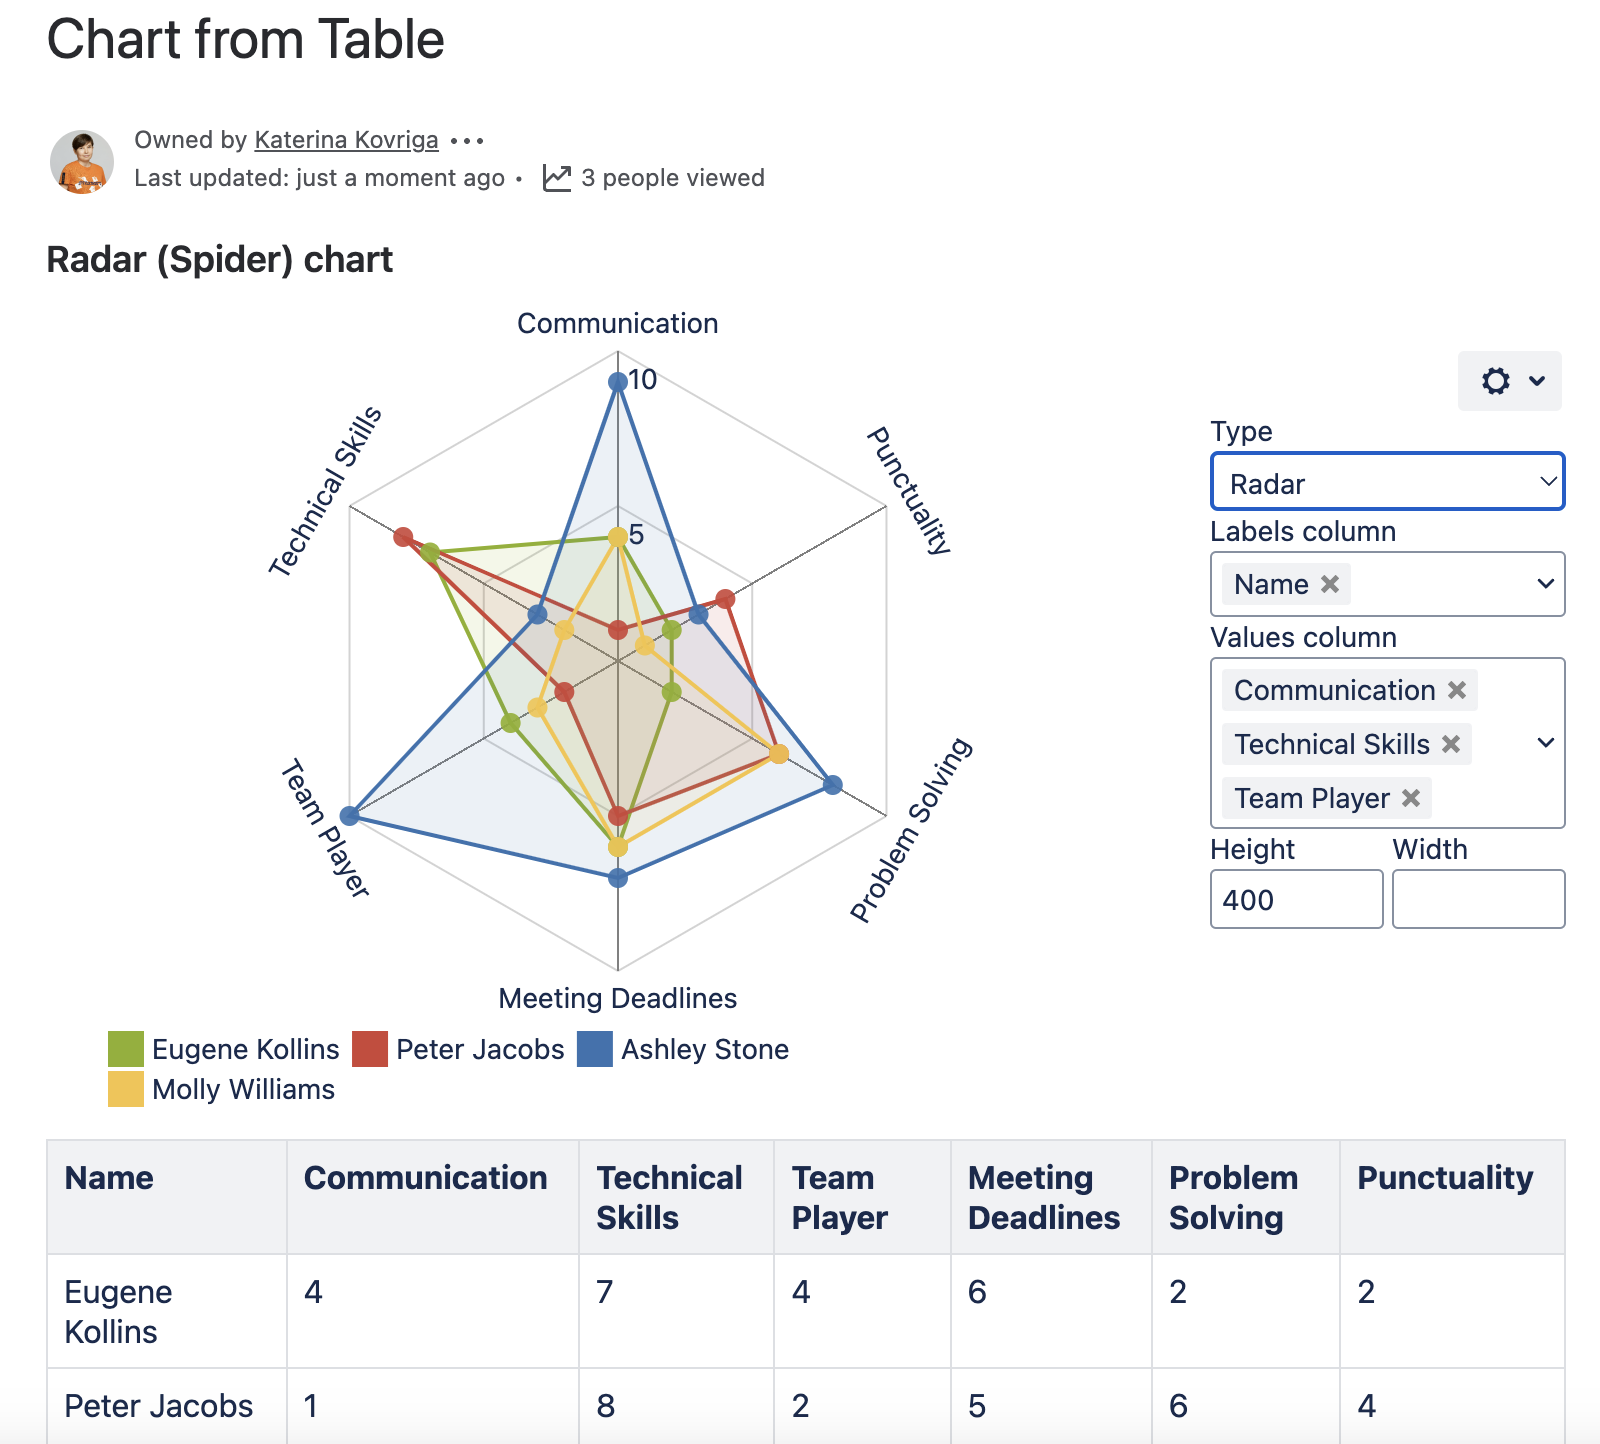
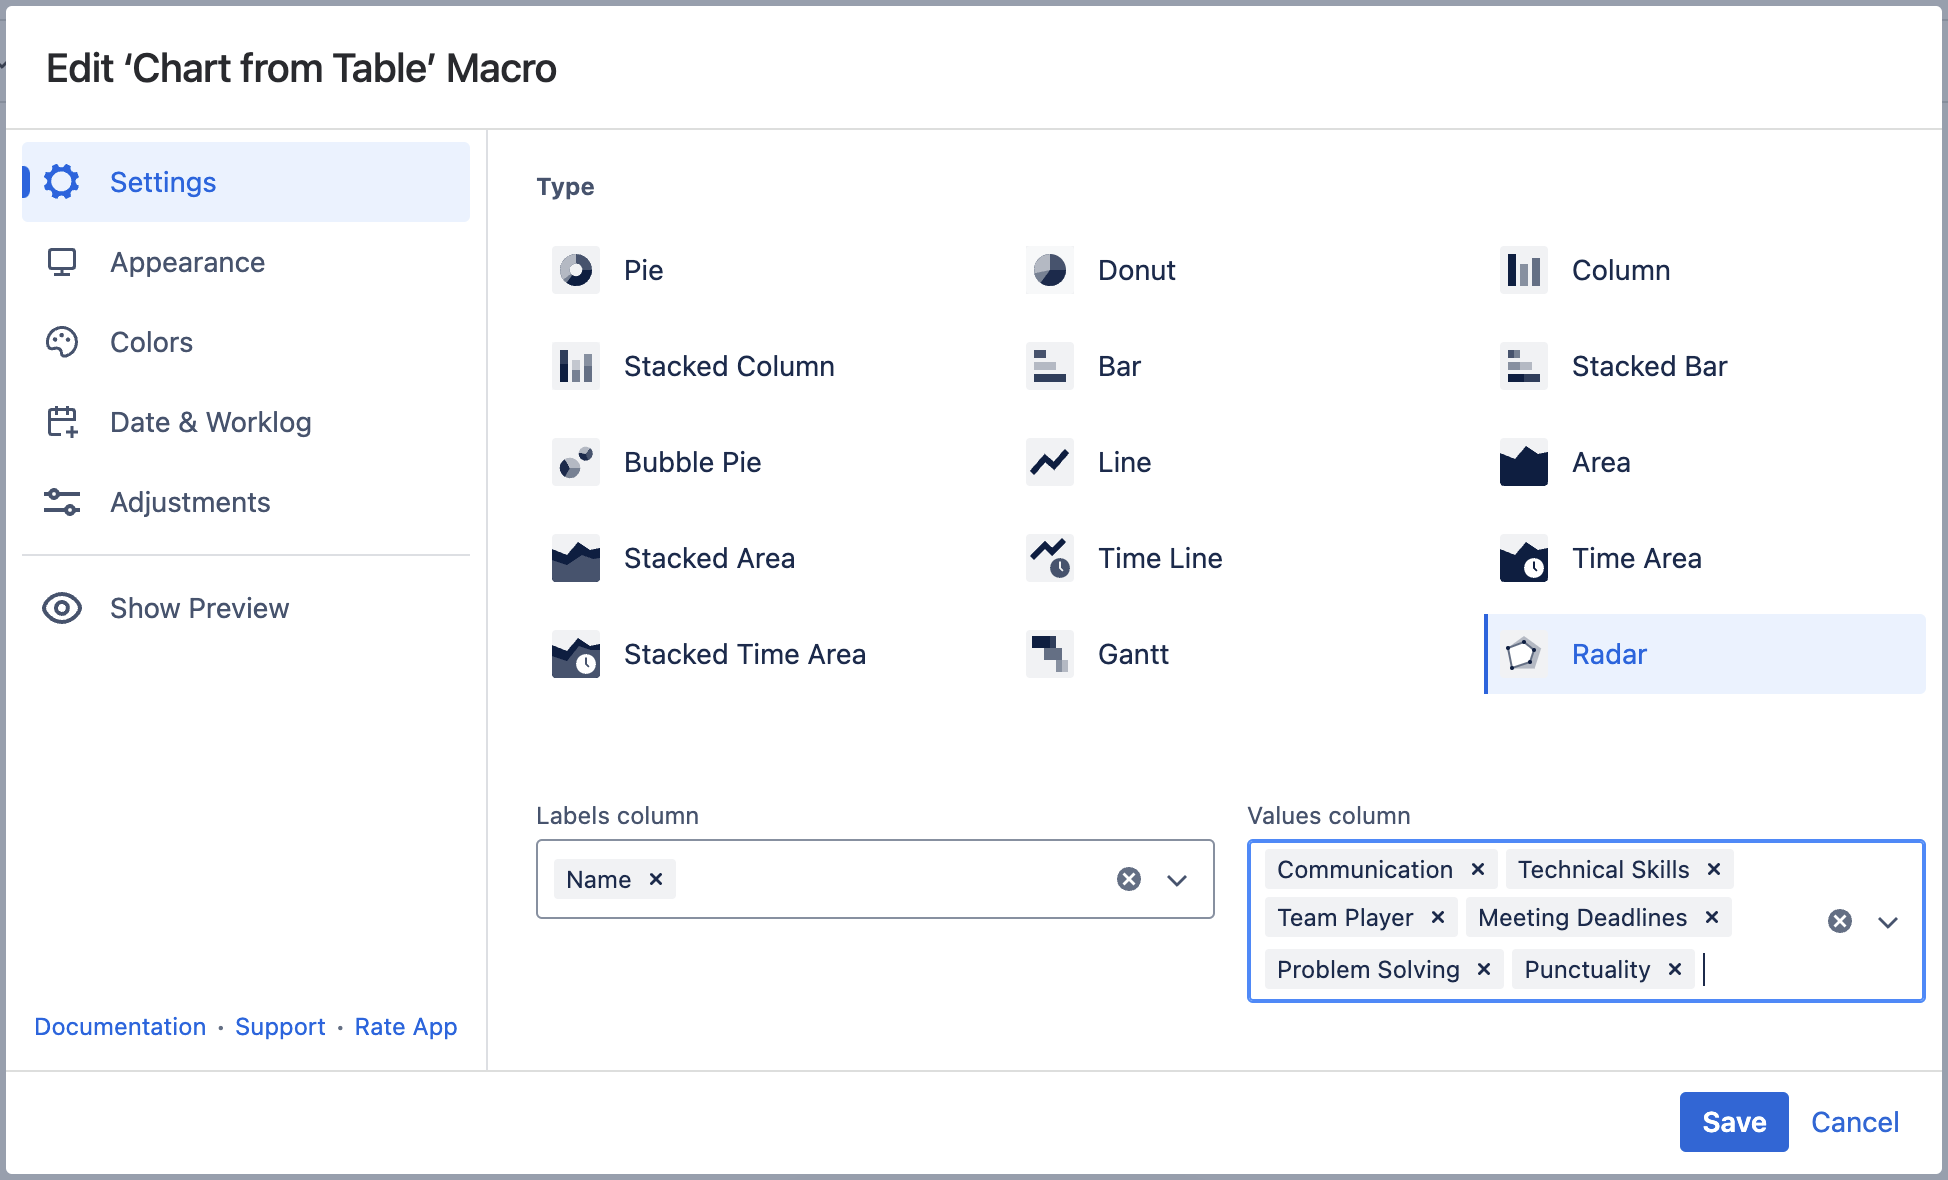
Parameters in Macro Browser
| Labels column | Name |
|---|---|
| Values column |
|
| Type | Radar |
| Maximal value | 10 |
Data Table in Macro Placeholder
| Name | Communication | Technical Skills | Team Player | Meeting Deadlines | Problem Solving | Punctuality |
|---|---|---|---|---|---|---|
| Eugene Kollins | 4 | 7 | 4 | 6 | 2 | 2 |
| Peter Jacobs | 1 | 8 | 2 | 5 | 6 | 4 |
| Ashley Stone | 9 | 3 | 10 | 7 | 8 | 3 |
| Molly Williams | 4 | 2 | 3 | 6 | 6 | 1 |
Settings Tab
Select the chart type
To select the chart type in the page view mode:
- Insert the Chart from Table macro.
- Hover over the chart controls on the right of the table.
- Locate the Type option and select the chart type. The chart will be automatically regenerated.
- To save the modifications in the macro body, click the cogwheel icon and select Save changes.
To select the chart type in the macro browser:
- Switch the page to the edit mode.
- Insert the Chart from Table macro and paste the table within the macro body.
- Select the macro and click Edit.
- Locate the Type option in the Settings tab and select the chart type.
- Save the macro and the page.
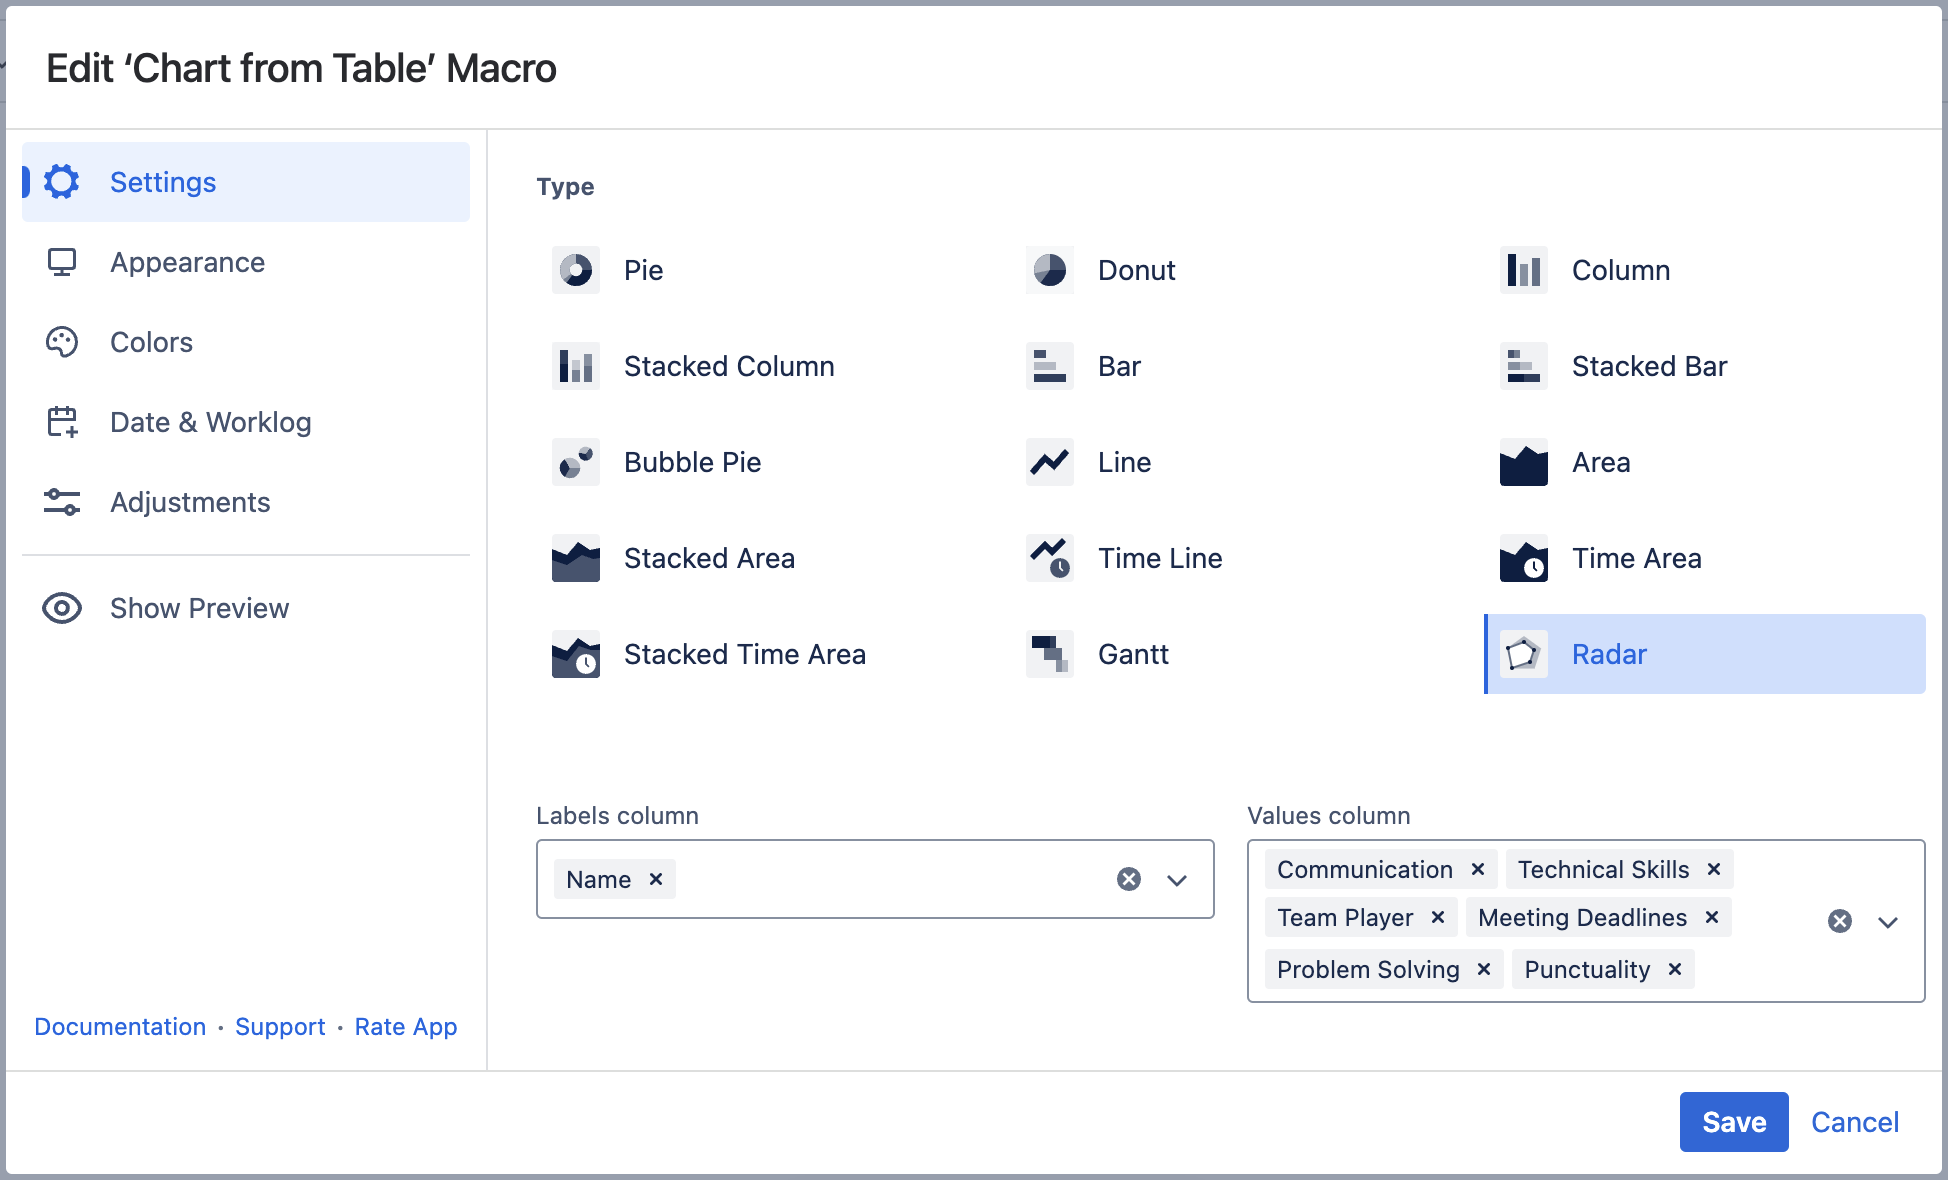
Select data series
Labels column - the column containing labels for data values.
Values column - the column or columns containing numerical values for chart generation.
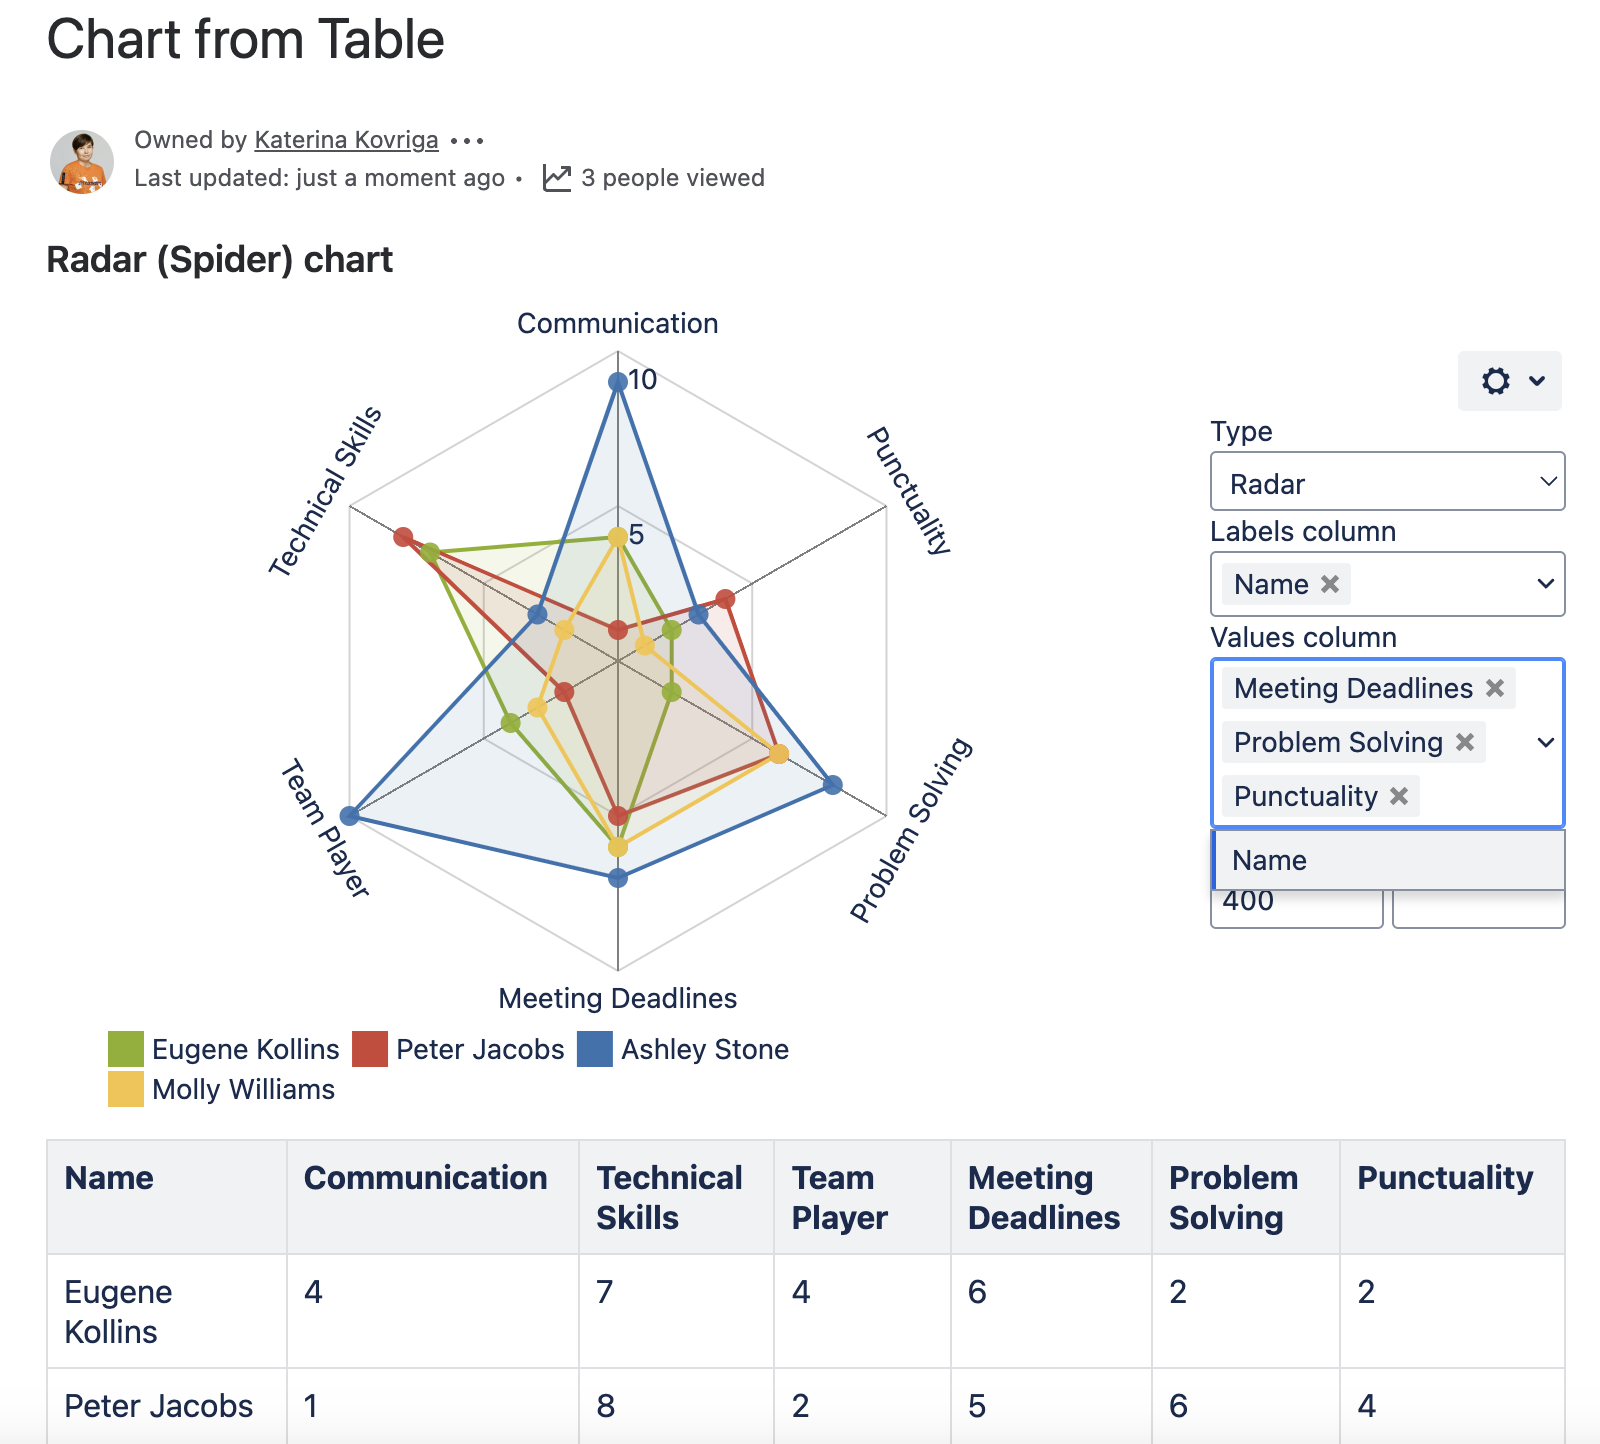
To select data series in the page view mode:
- Insert the Chart from Table macro.
- Hover over the chart controls on the right of the table.
- Locate the Labels column and Values column options and select the table columns containing data for chart generation. The chart will be automatically regenerated.
- To save the modifications in the macro body, click the cogwheel icon and select Save changes.
To select data series in the macro browser:
- Switch the page to the edit mode.
- Insert the Chart from Table macro and paste the table within the macro body.
- Select the macro and click Edit.
- Locate the Labels column and Values column options in the Settings tab and select the table columns containing data for chart generation.
- Save the macro and the page.
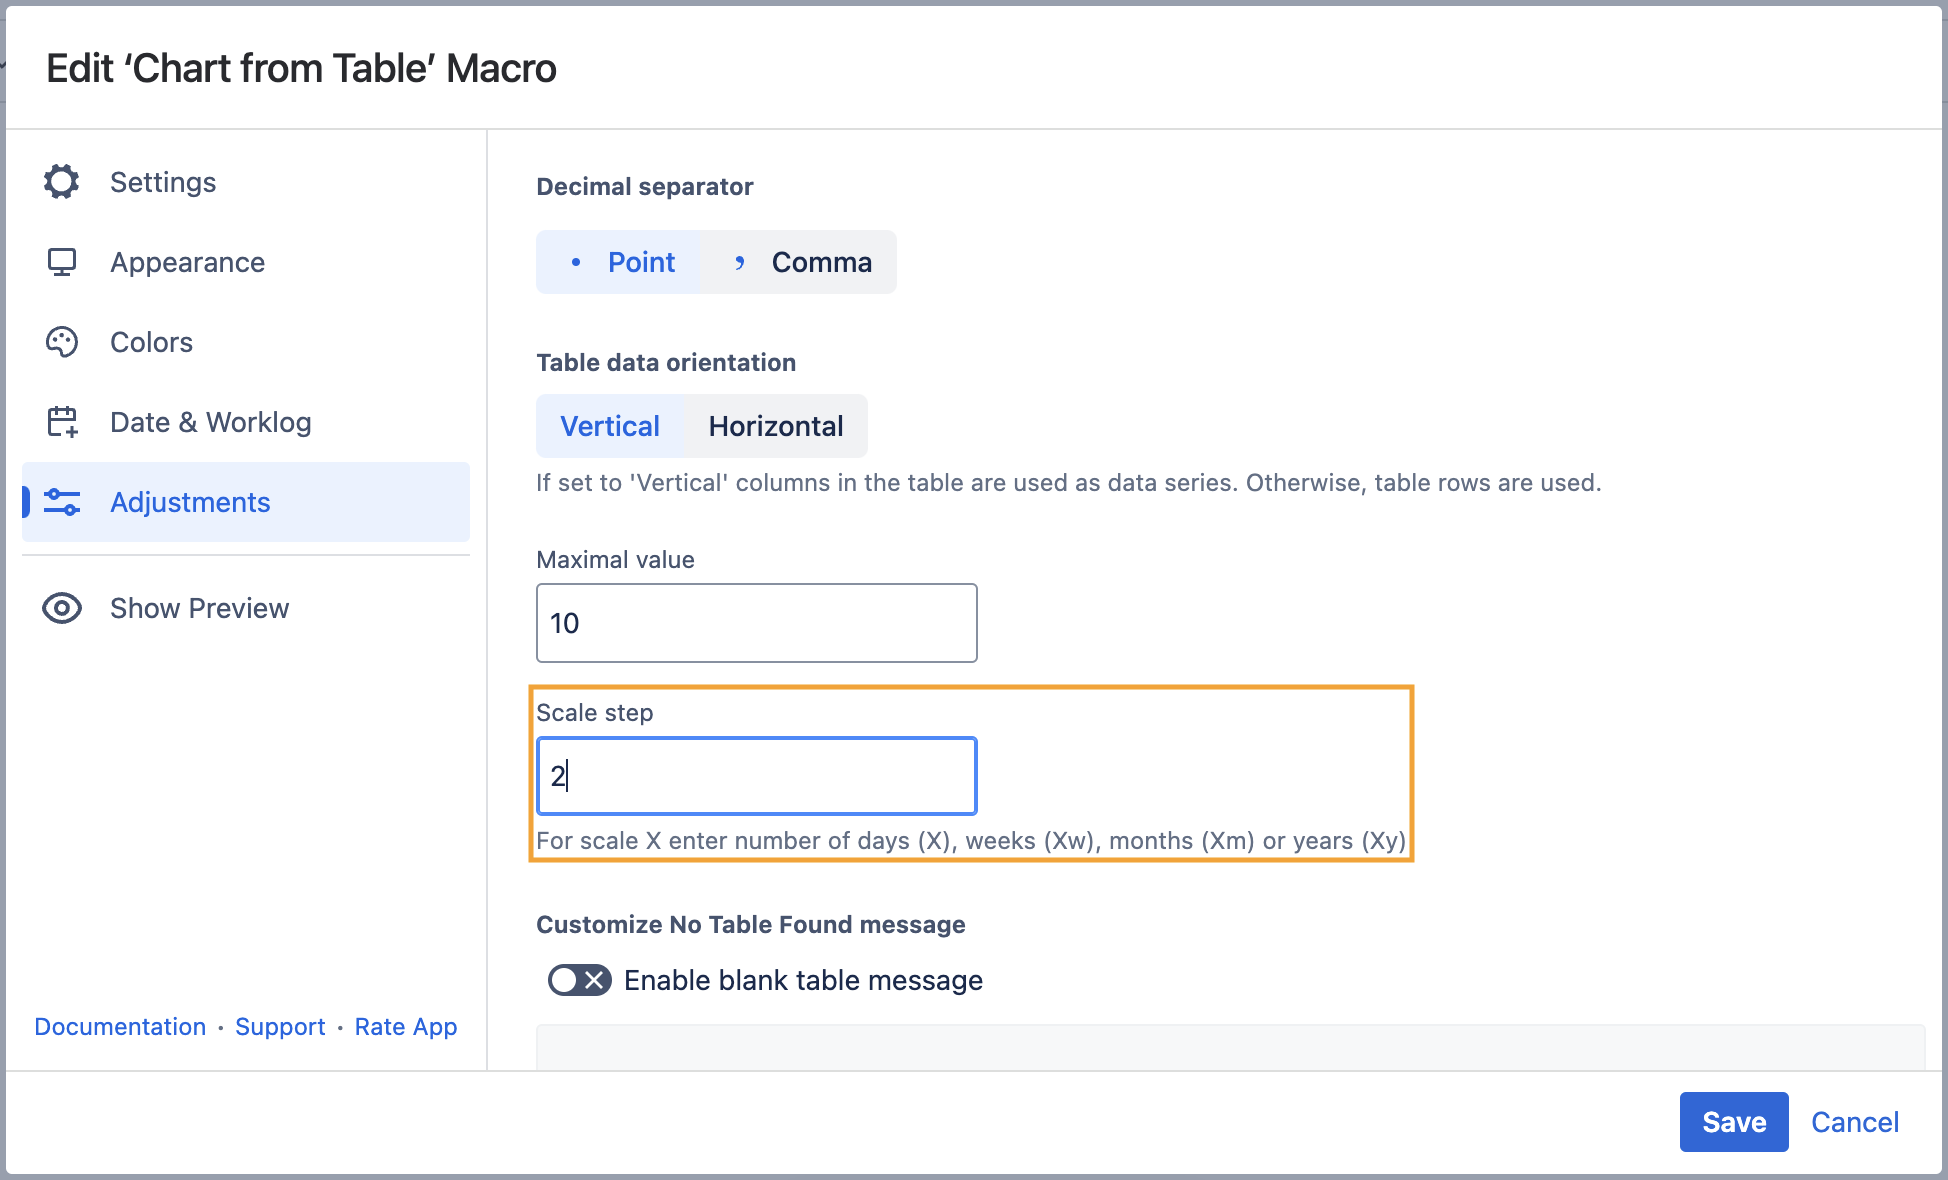
Adjustments Tab
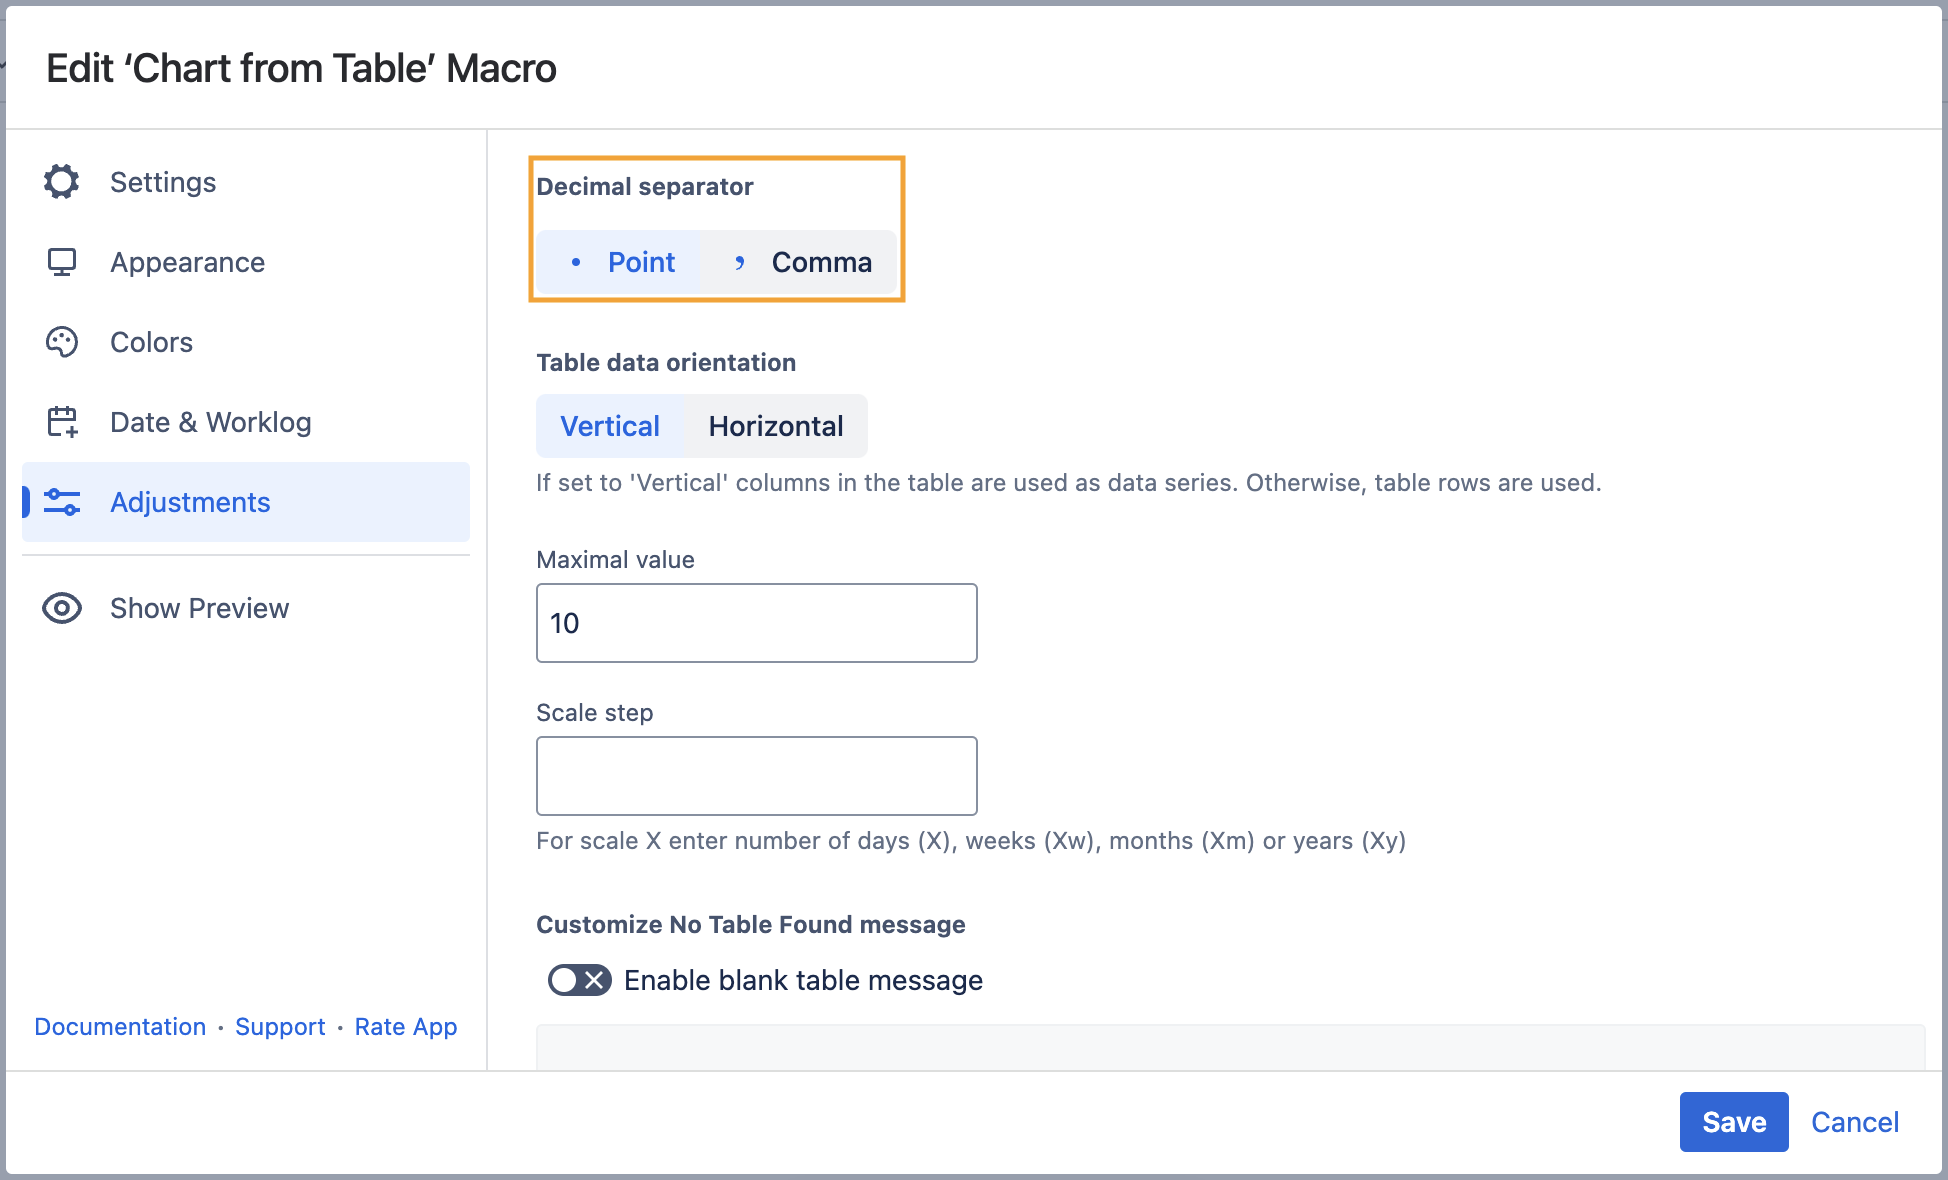
Set the decimal separator
- Switch the page to the edit mode.
- Select the macro and click Edit.
- Switch to the Adjustments tab.
- Locate the Decimal separator option.
- Specify the correct decimal separator for numeric values in the source table (point or comma).
- Save the macro and the page.
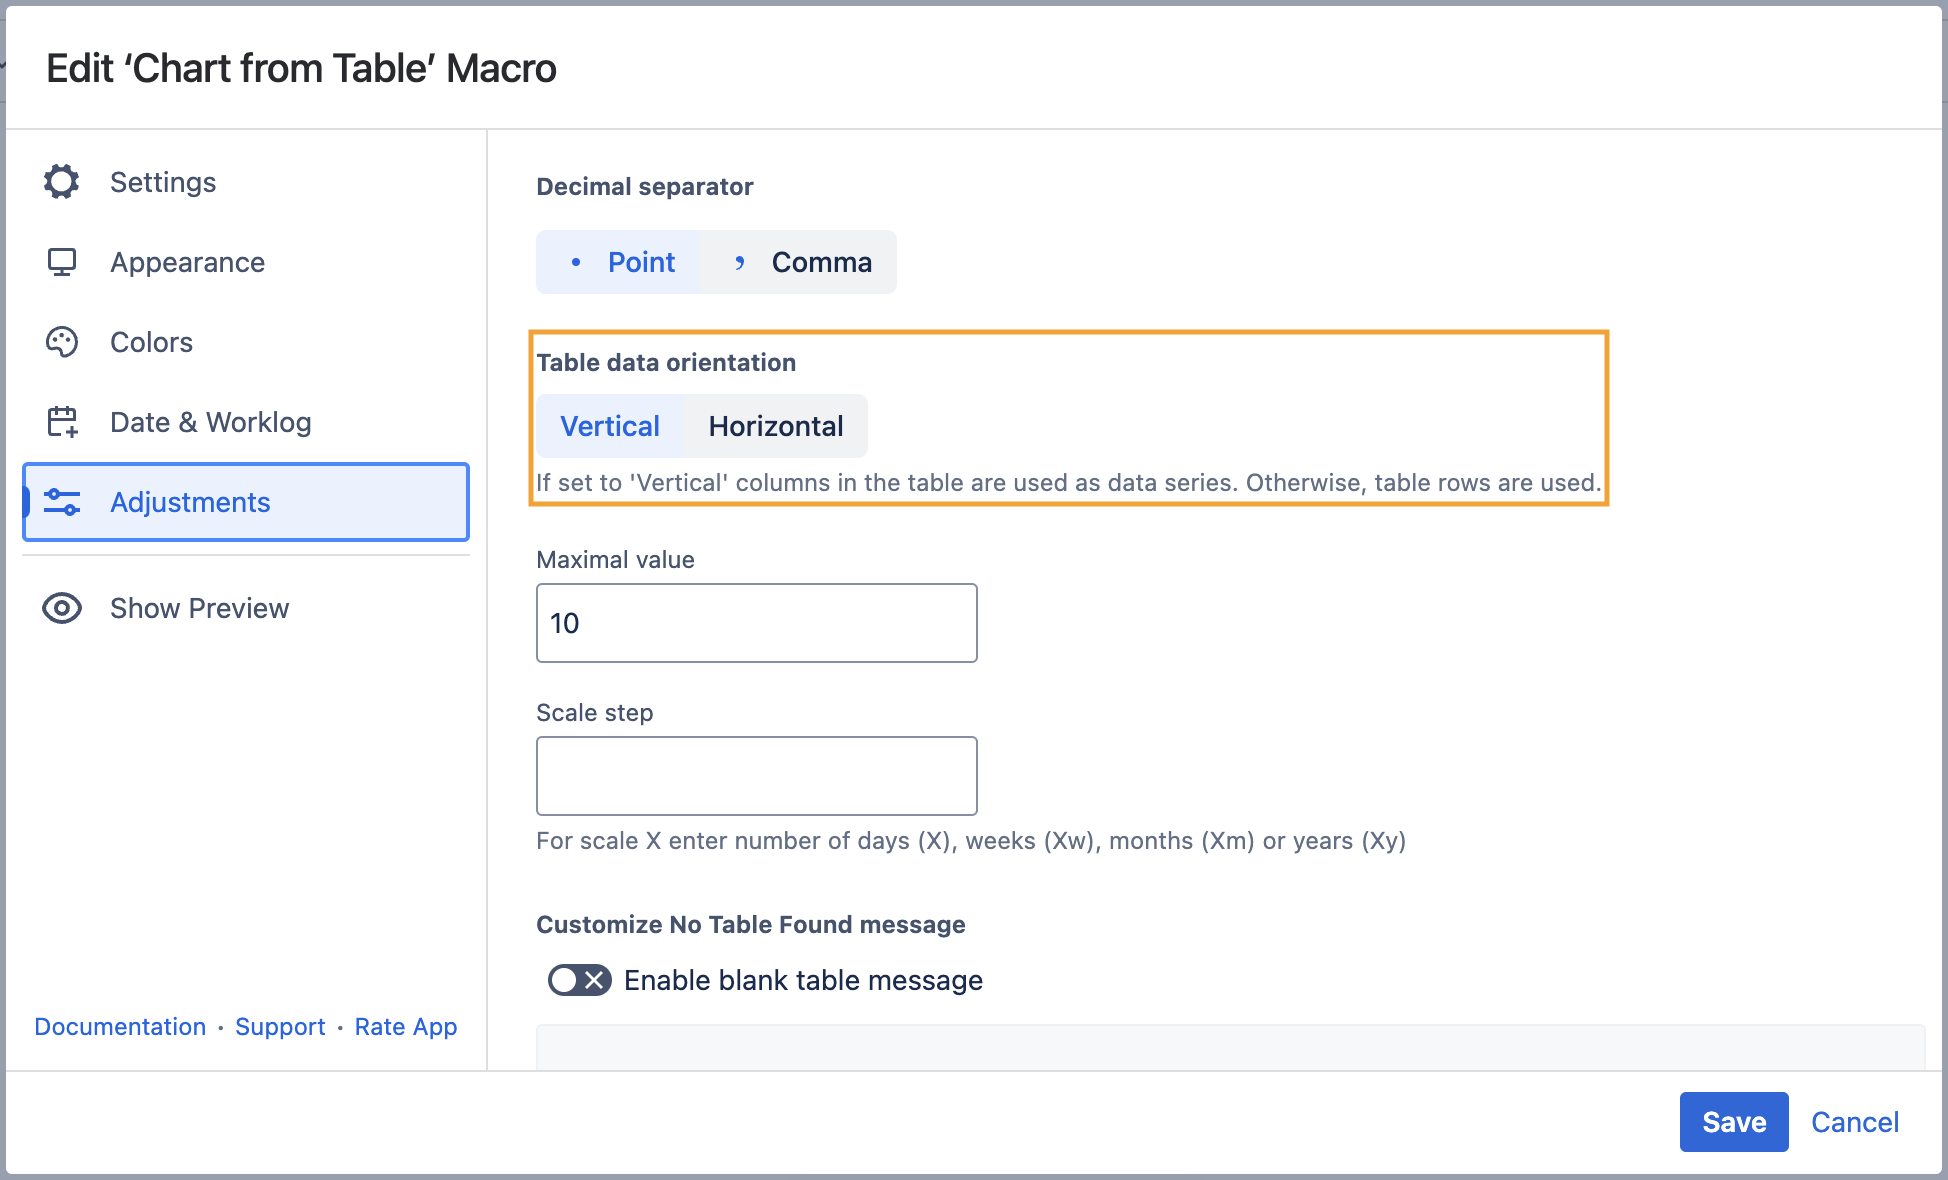
Set the table data orientation
- Switch the page to the edit mode.
- Select the macro and click Edit.
- Switch to the Adjustments tab.
- Locate the Table data orientation option.
- Select the Vertical or Horizontal option.
- Save the macro and the page.
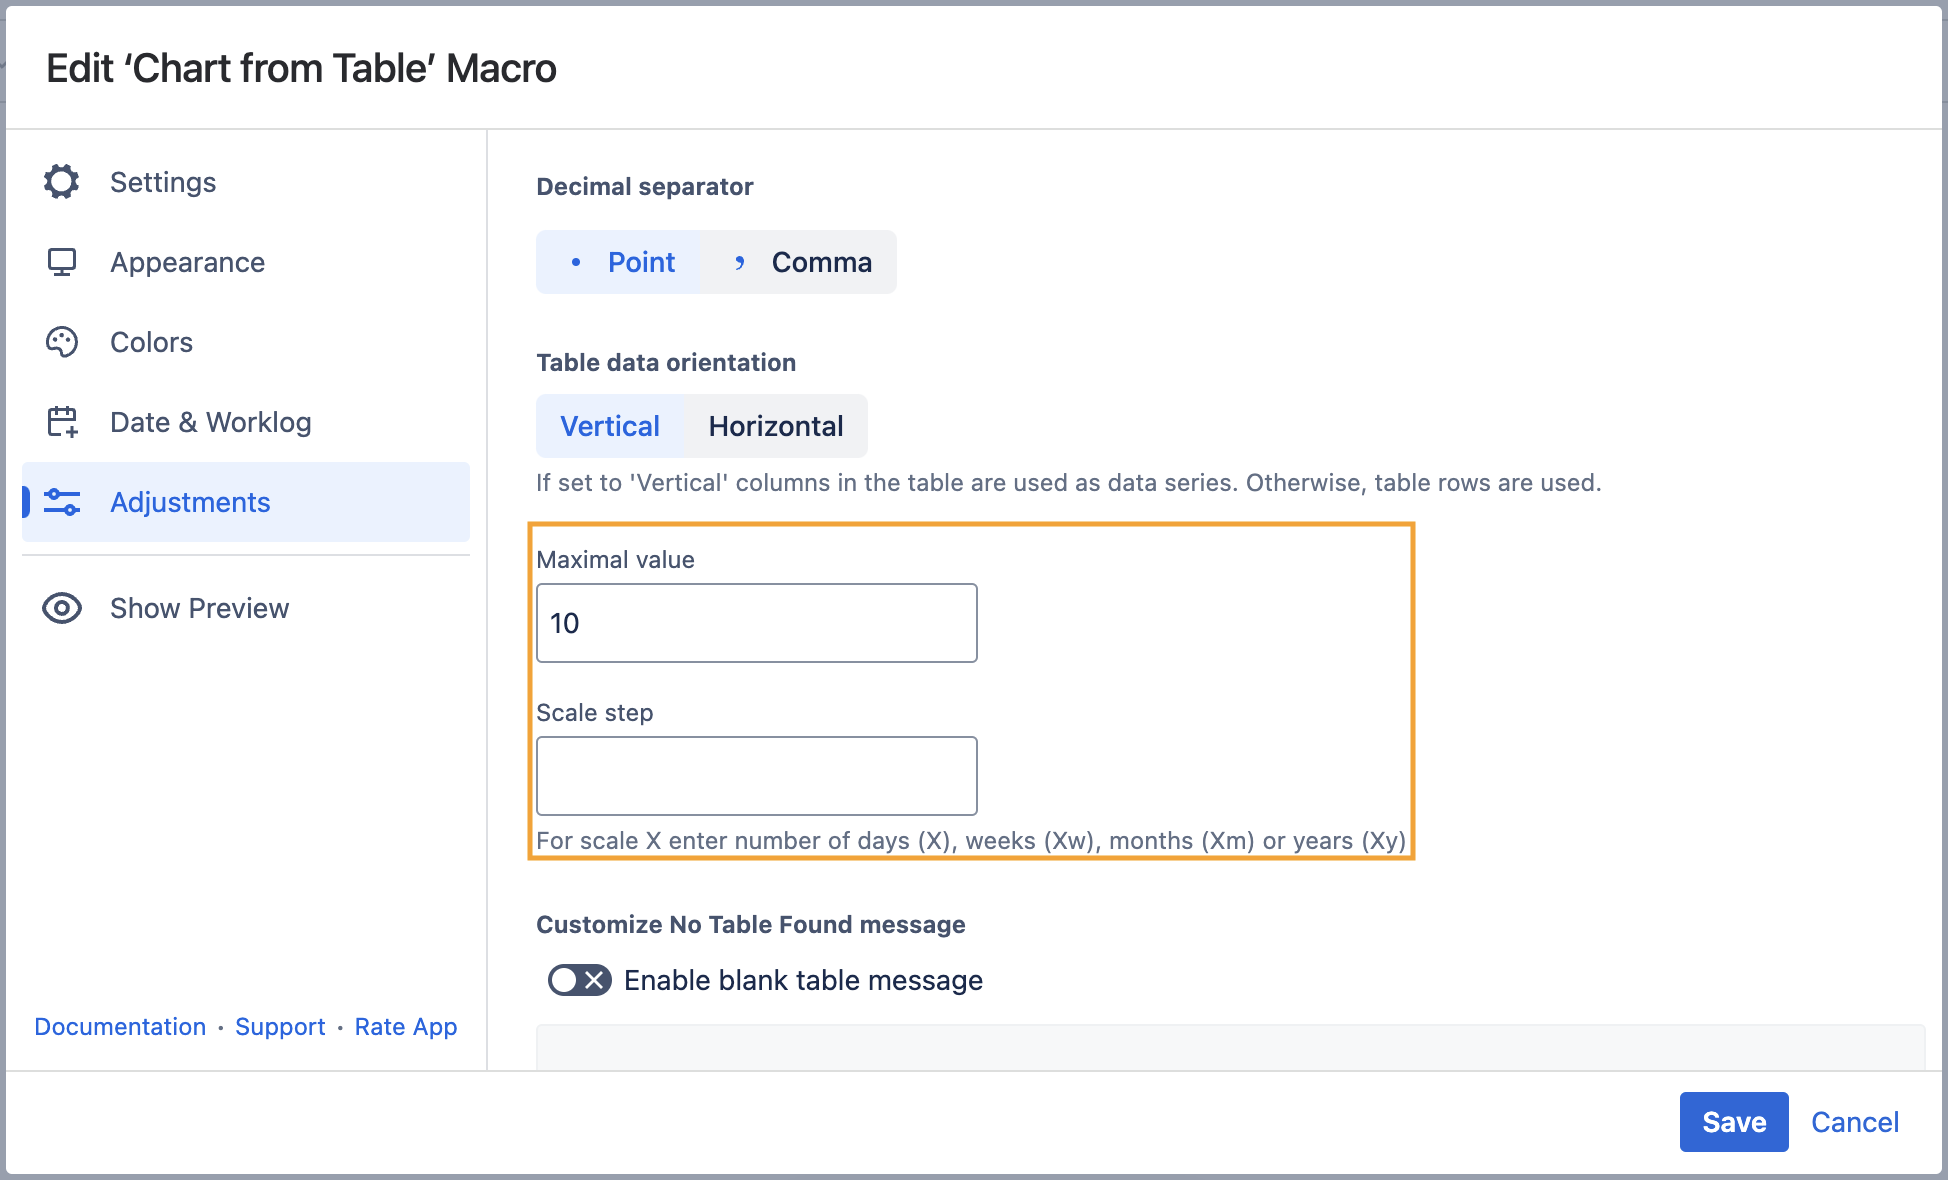
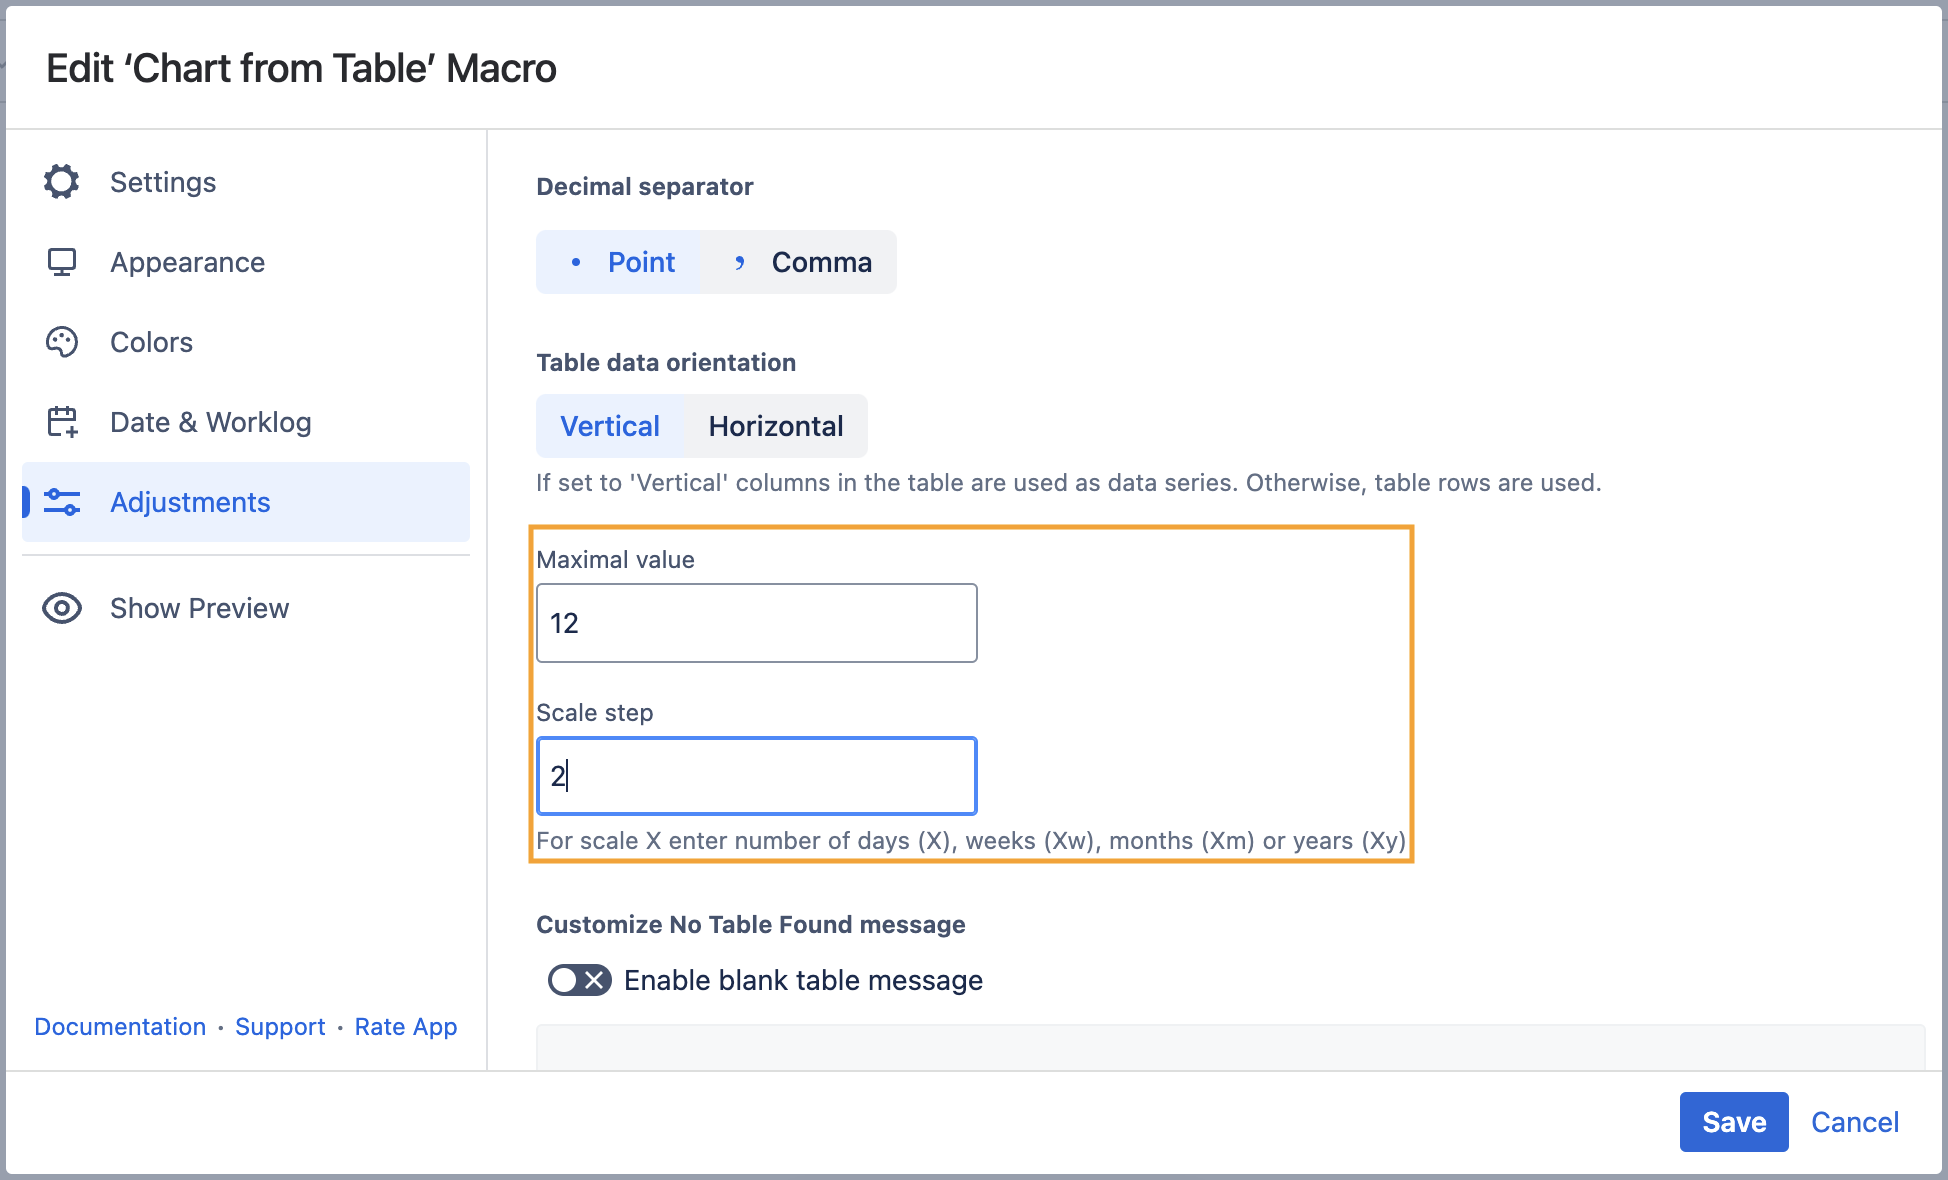
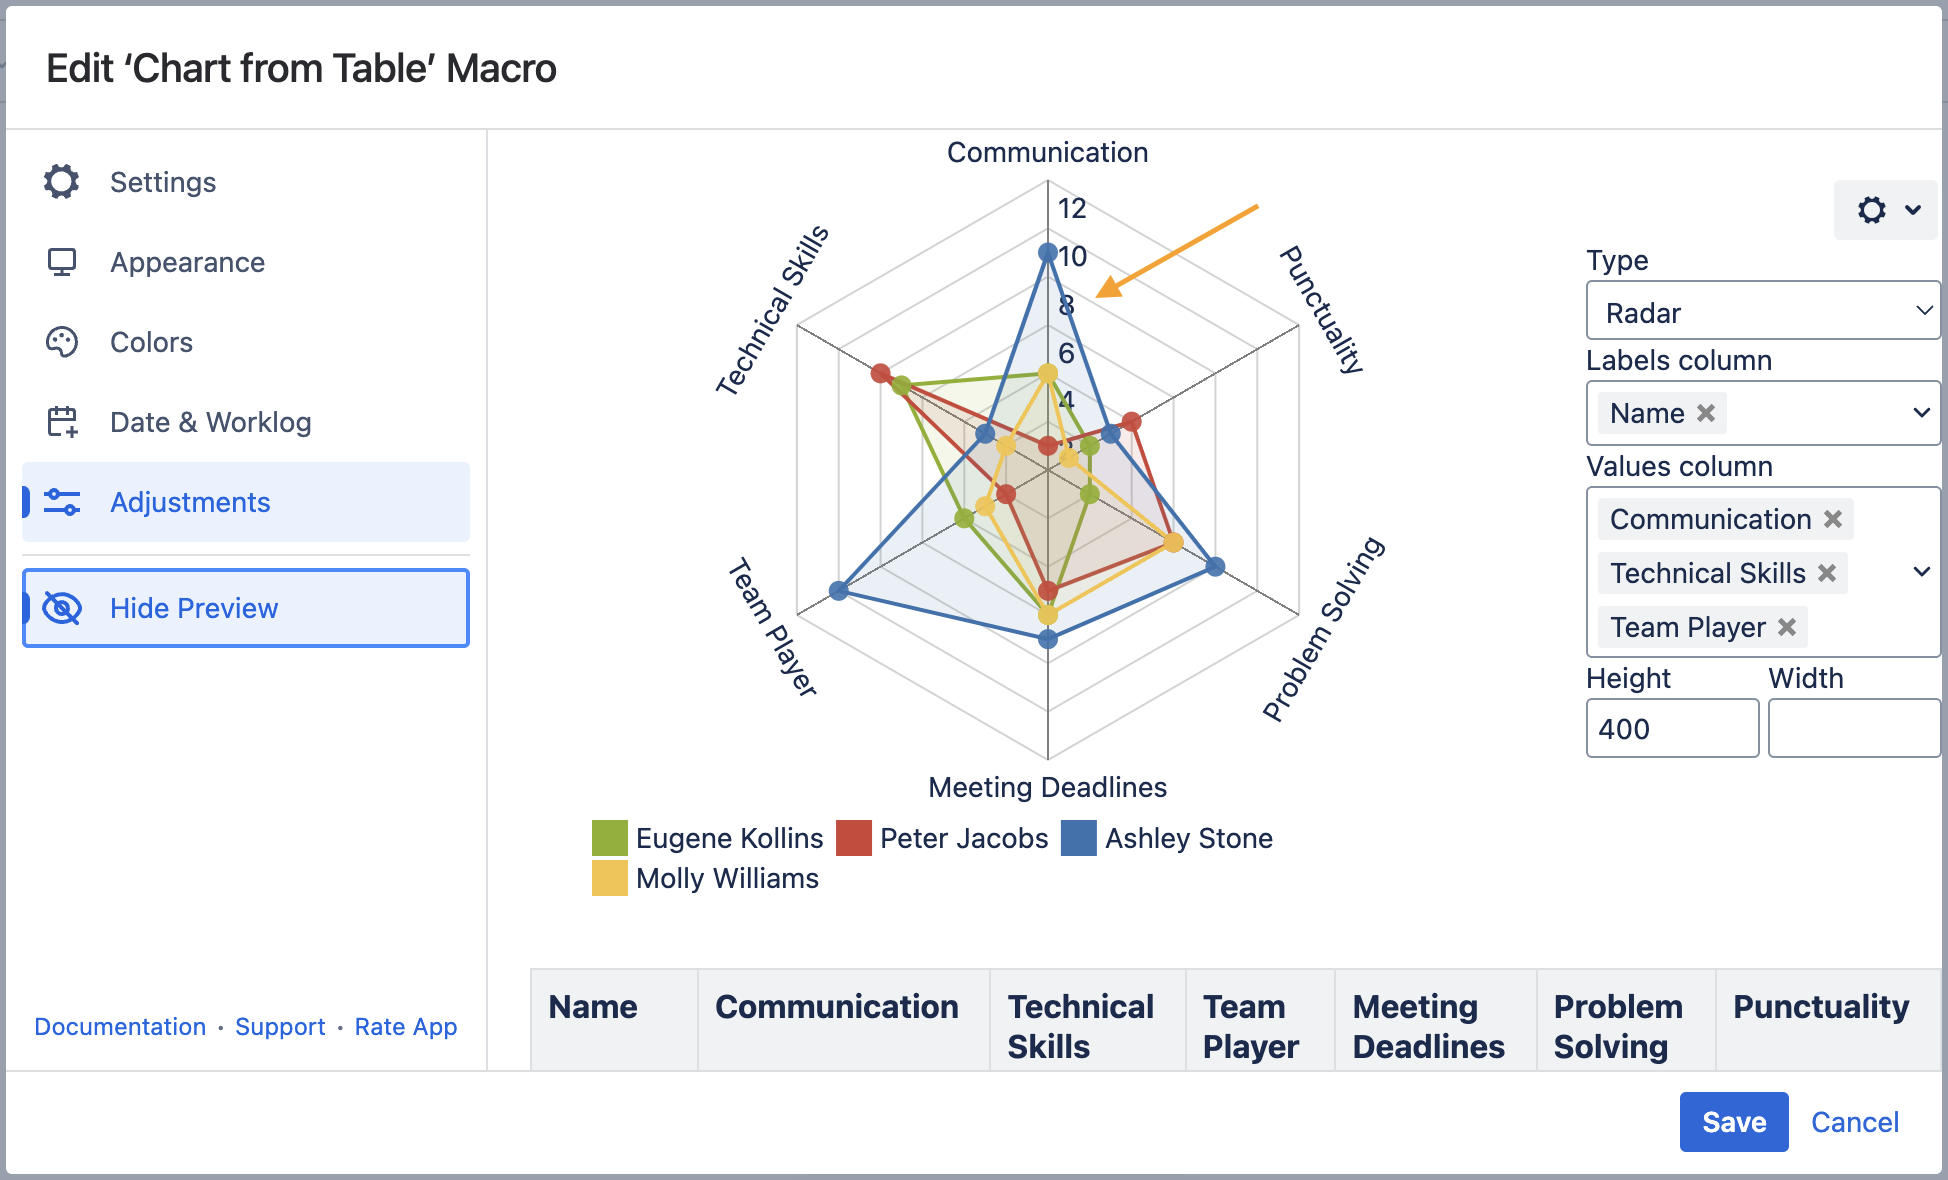
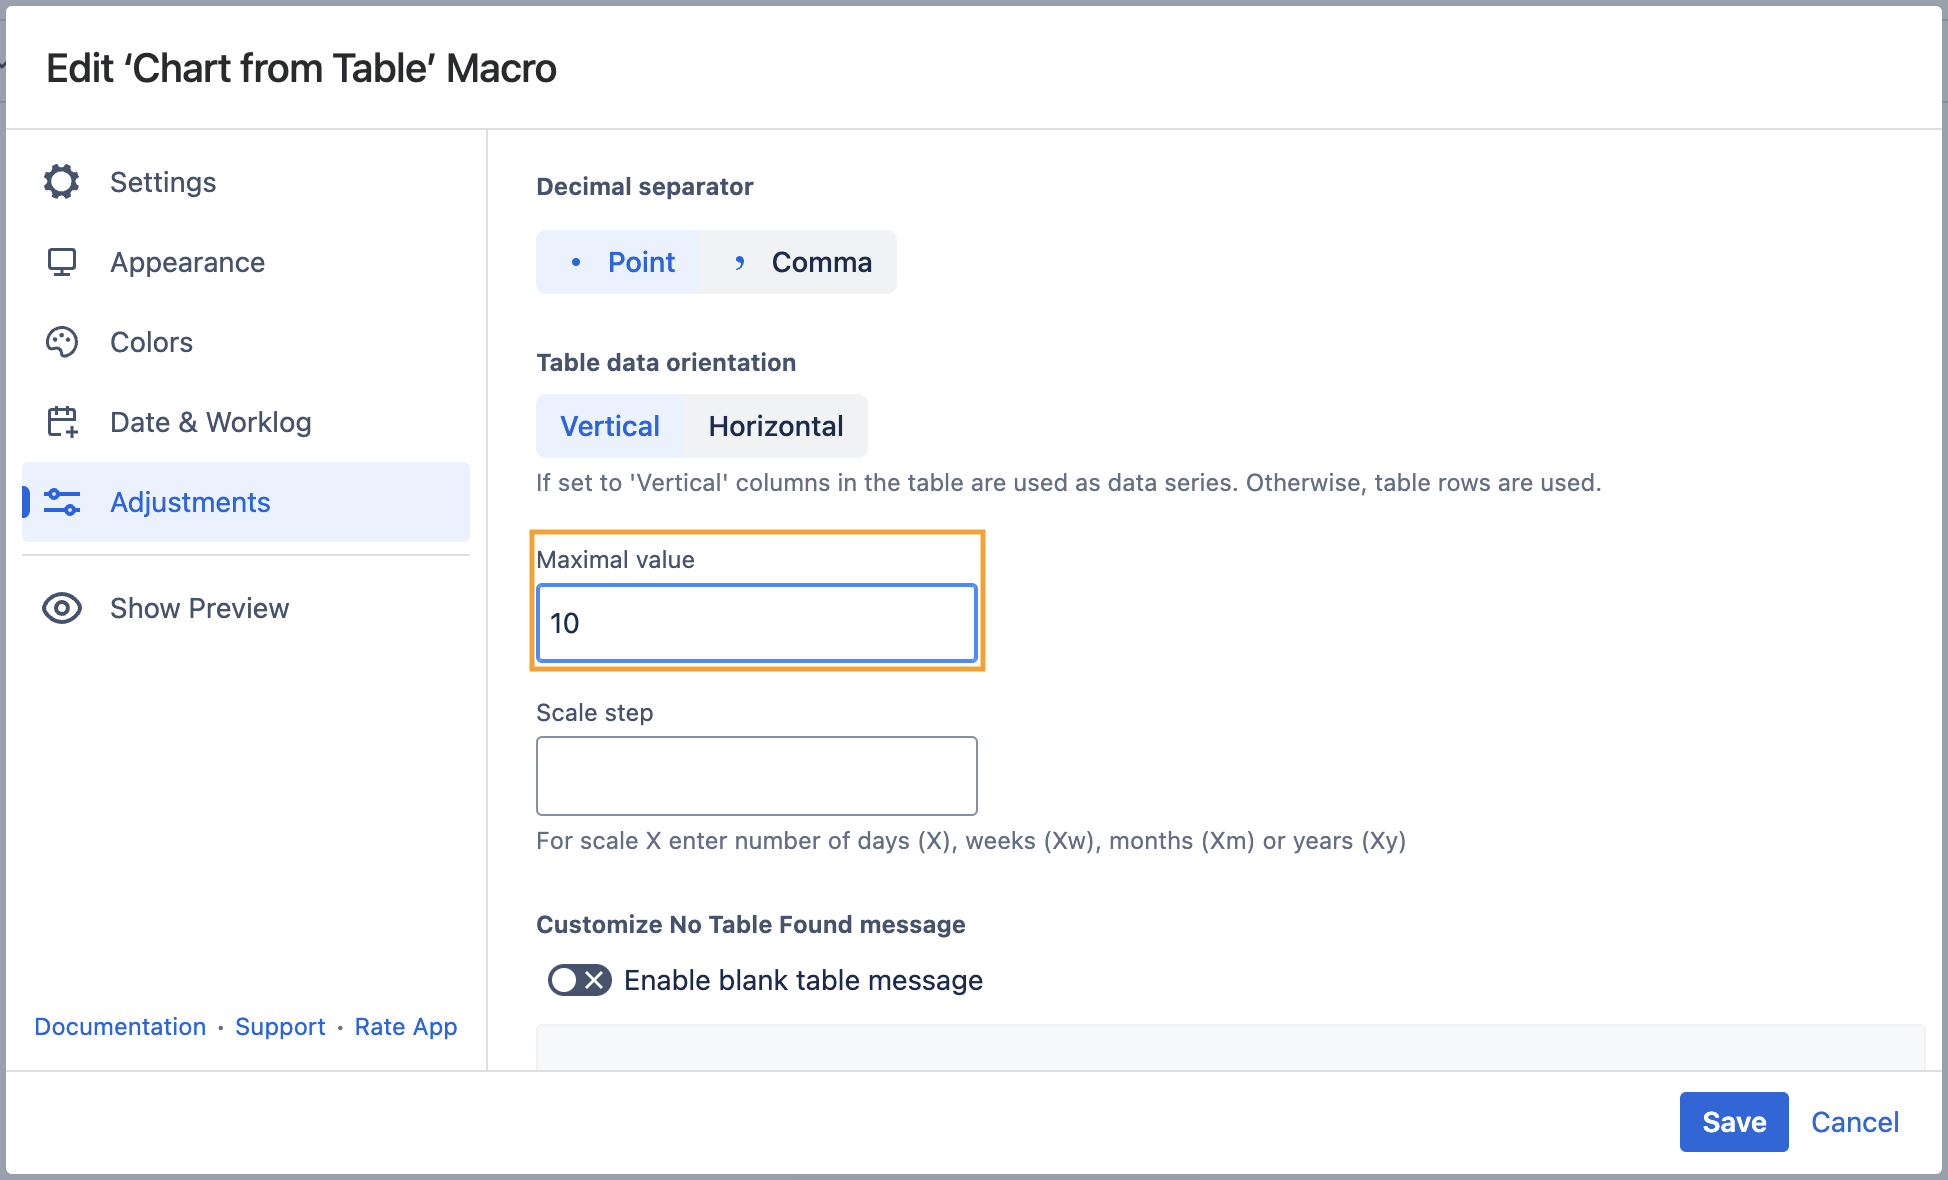
Set the maximal value
Maximal value - You can specify the maximal value for showing only data values not greater than the specified maximal value.
- Switch the page to the edit mode.
- Select the macro and click Edit.
- Switch to the Adjustments tab.
- Locate the Maximal value options and set the values.
- Save the macro and the page.
Set the scale step
Scale Step - the required scale step of Y axis for showing the chart.
- Switch the page to the edit mode.
- Select the macro and click Edit.
- Switch to the Adjustments tab.
- Locate the Scale Step options and set the scale step.
- Save the macro and the page.
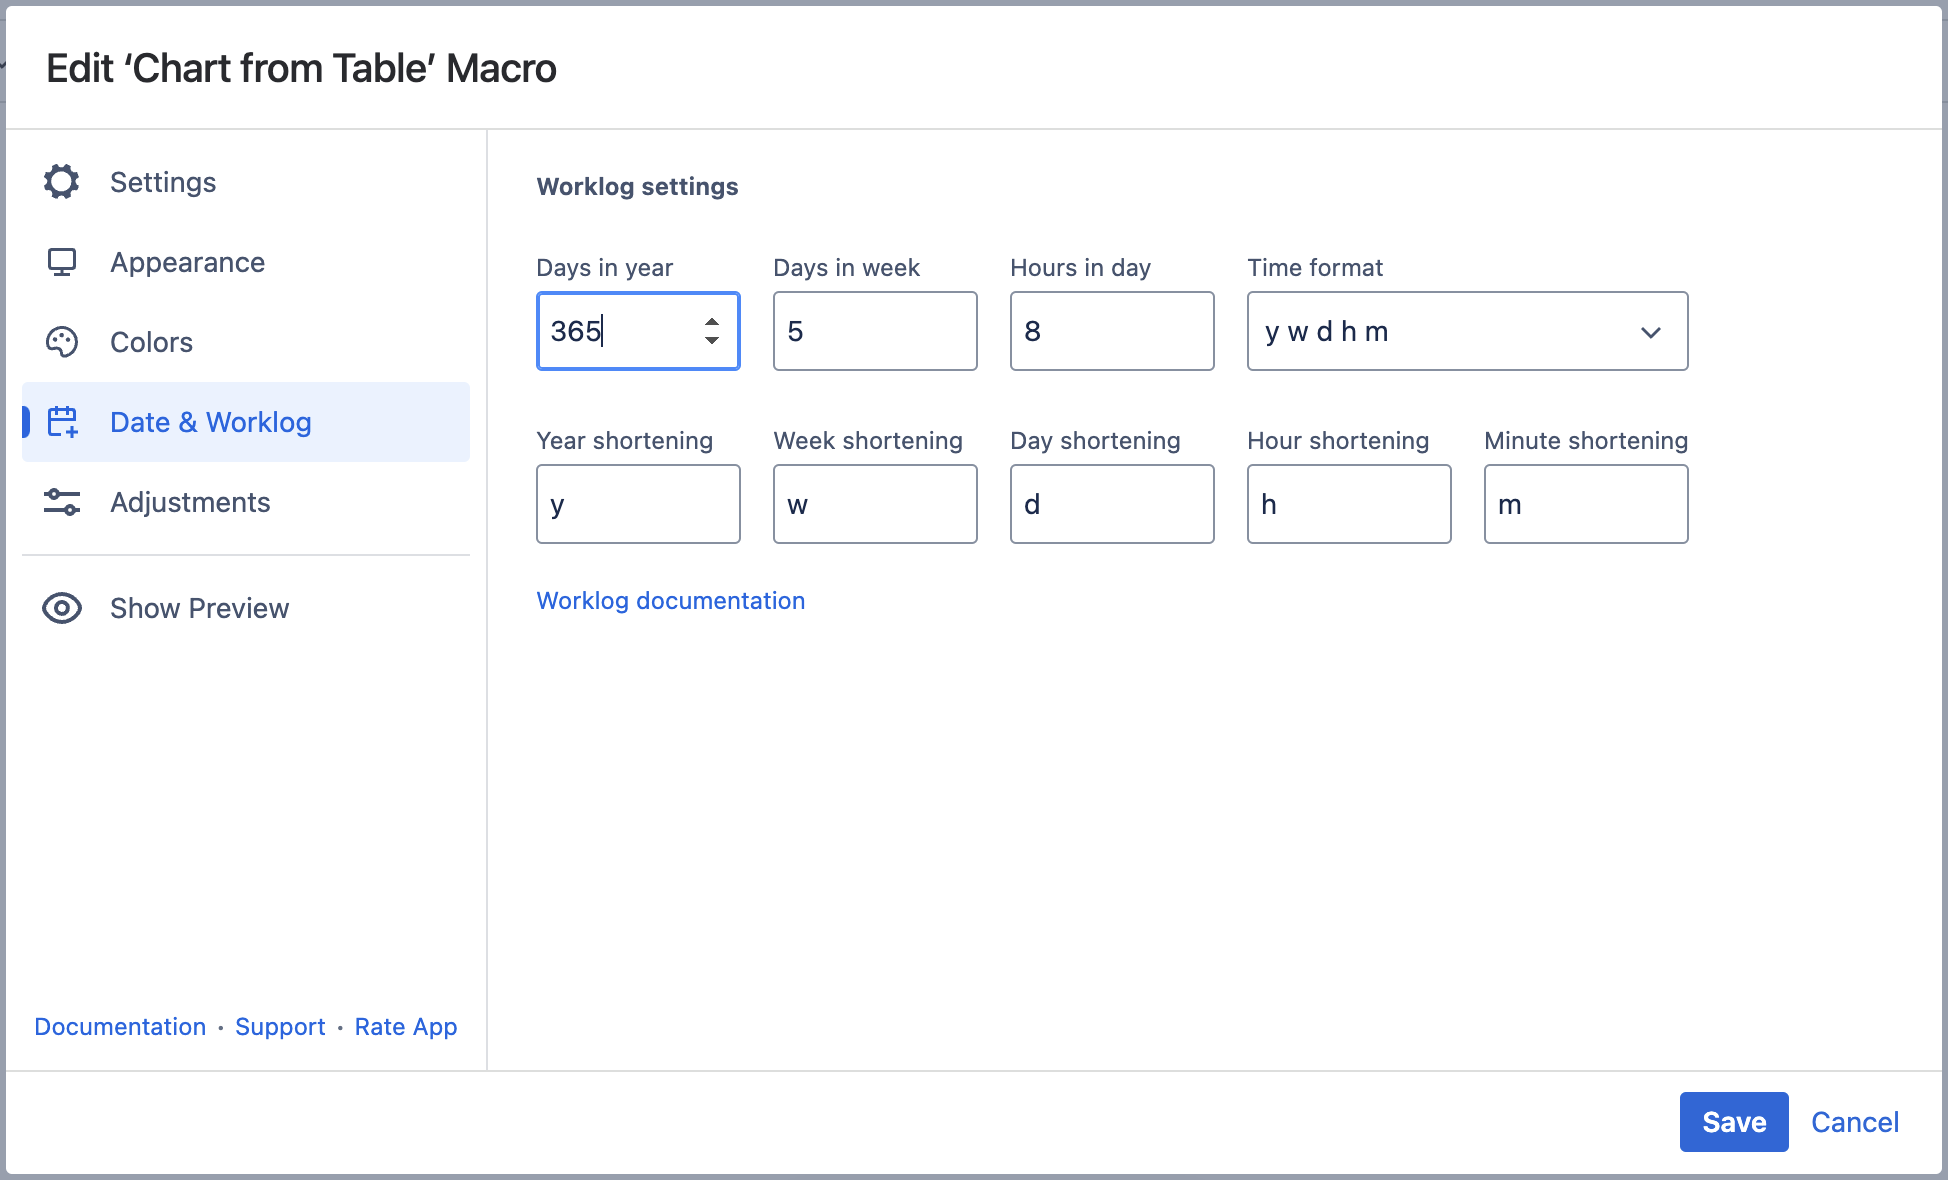
Date & Worklog Tab
Set the worklog settings
- Switch the page to the edit mode.
- Select the macro and click Edit .
- Locate the Worklog settings option.
- Define the worklog parameters, as follows:
- Days in year - enter the number of days in a year.
- Days in week - enter the number of business days in a week.
- Hours in day - enter the number of working hours in one business day.
- Time format - select the used time format in worklog values.
- Year shortening - enter the shortening for the year time unit if you use any language different from English.
- Week shortening - enter the shortening for the week time unit if you use any language different from English.
- Day shortening - enter the shortening for the day time unit if you use any language different from English.
- Hour shortening - enter the shortening for the hour time unit if you use any language different from English.
- Minute shortening - enter the shortening for the minute time unit if you use any language different from English.
- Save the macro and the page.
Appearance Tab
Set the height and width of the chart
- Switch the page to the edit mode.
- Select the macro and click Edit.
- Switch to the Appearance tab.
- Locate the Height and Width fields.
- Enter the appropriate dimensions of the chart.
Save the macro and the page.
To set the Height and Width of the chart in the page view mode:
- Hover over the chart controls on the right of the table.
- Locate the Height and Width fields.
- Enter the appropriate dimensions of the chart.
- To save the modifications in the macro body, click the cogwheel icon and select Save changes.
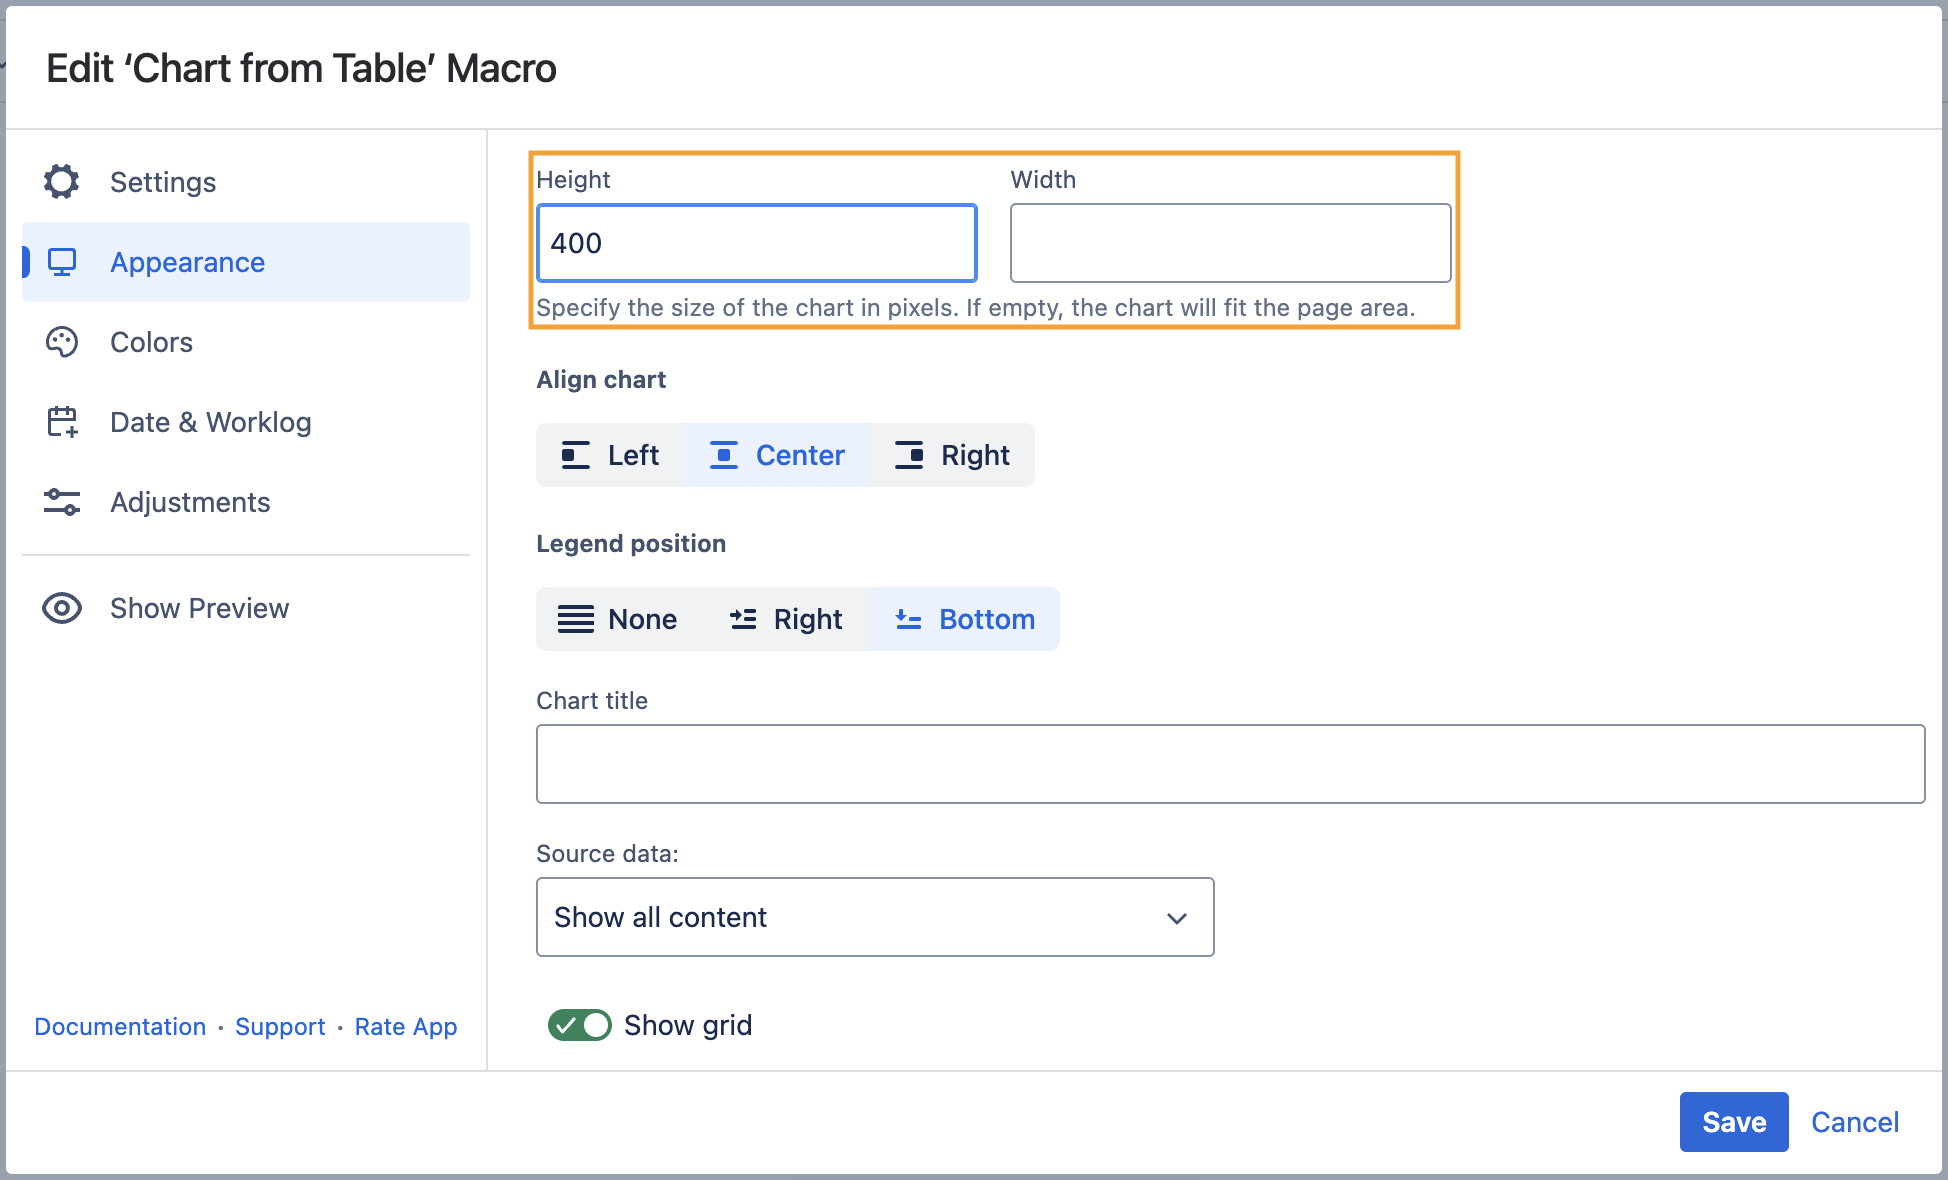
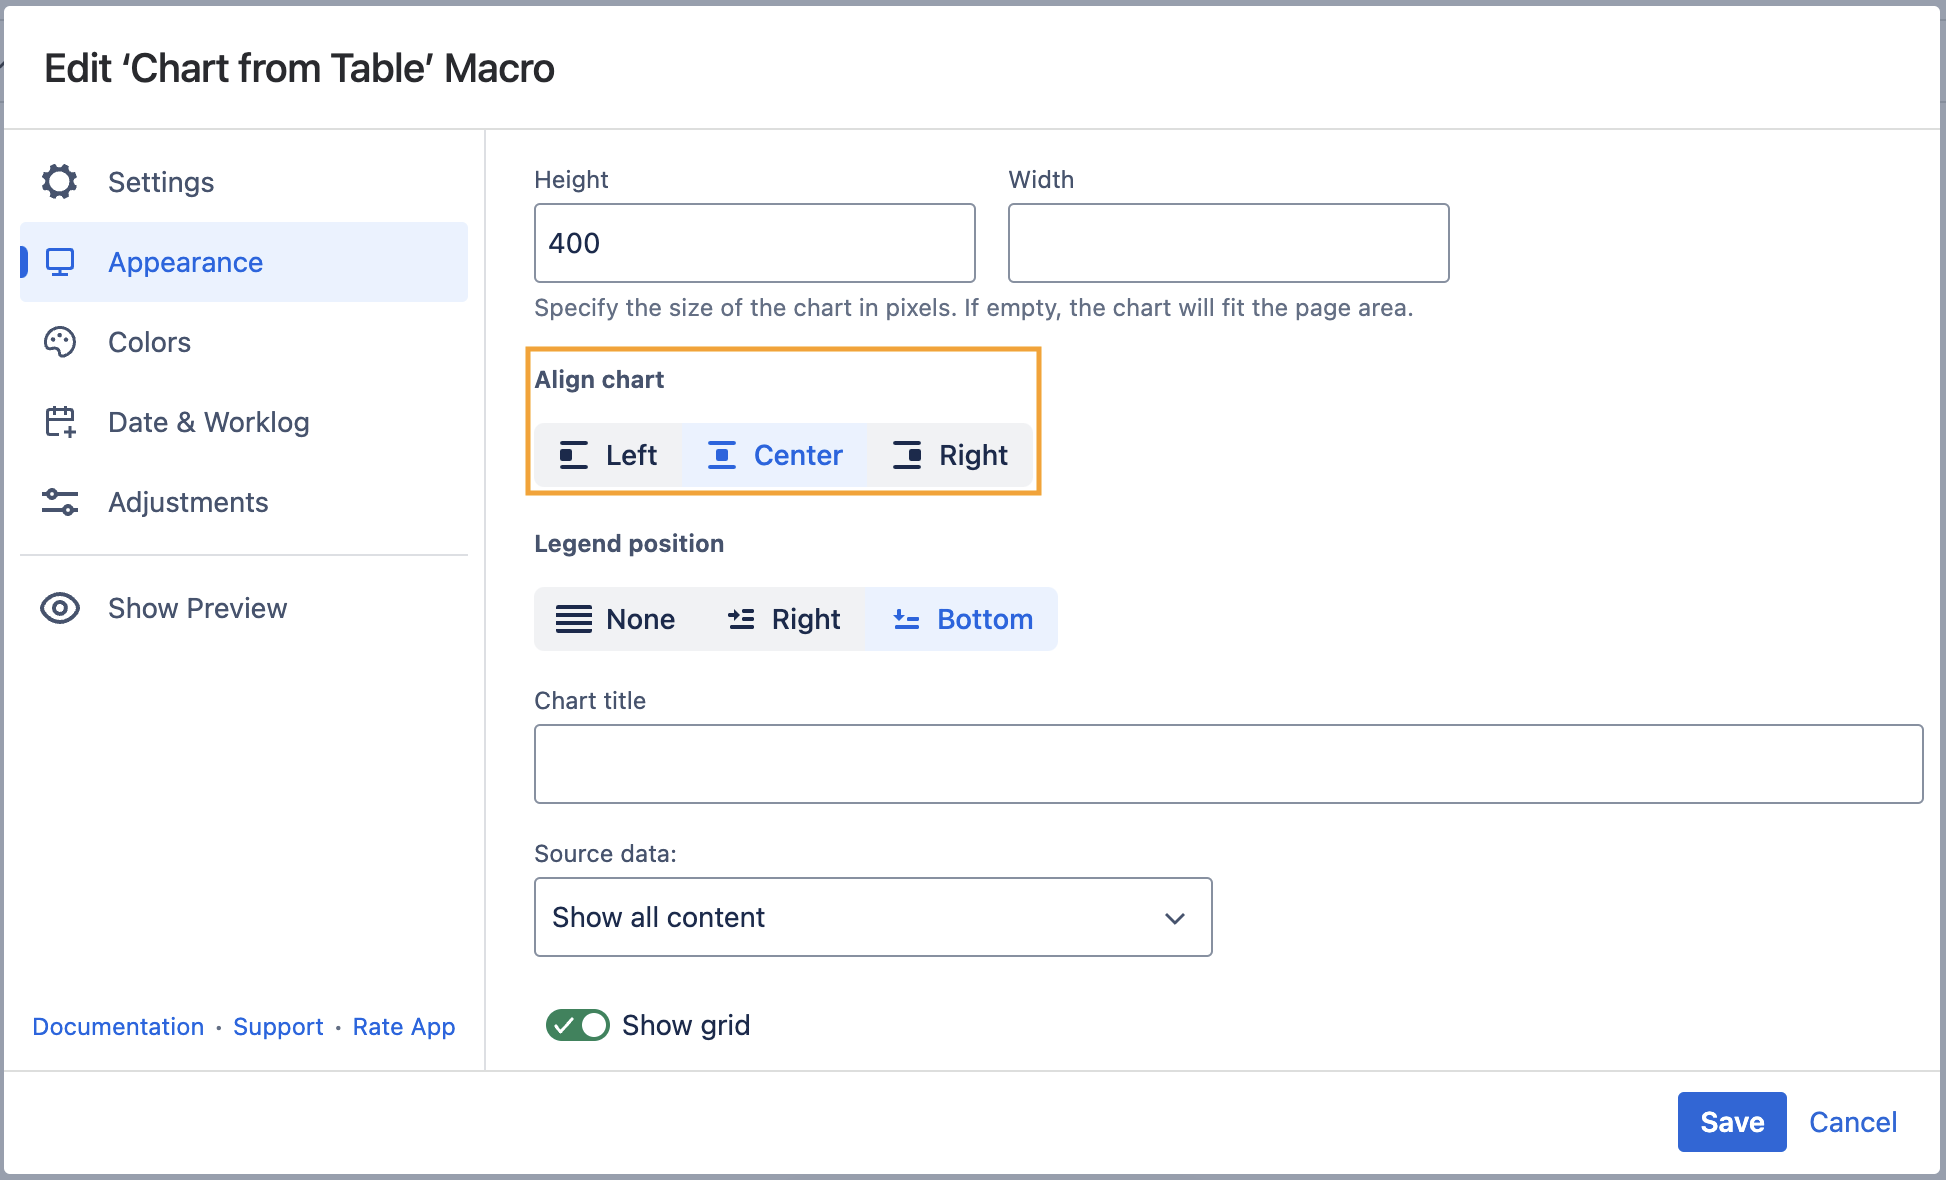
Align chart
- Switch the page to the edit mode.
- Select the macro and click Edit.
- Switch to the Appearance tab.
- Locate the Align chart option.
- Select the appropriate chart alignment, as follows:
- Left
- Center
- Right
- Save the macro and the page.
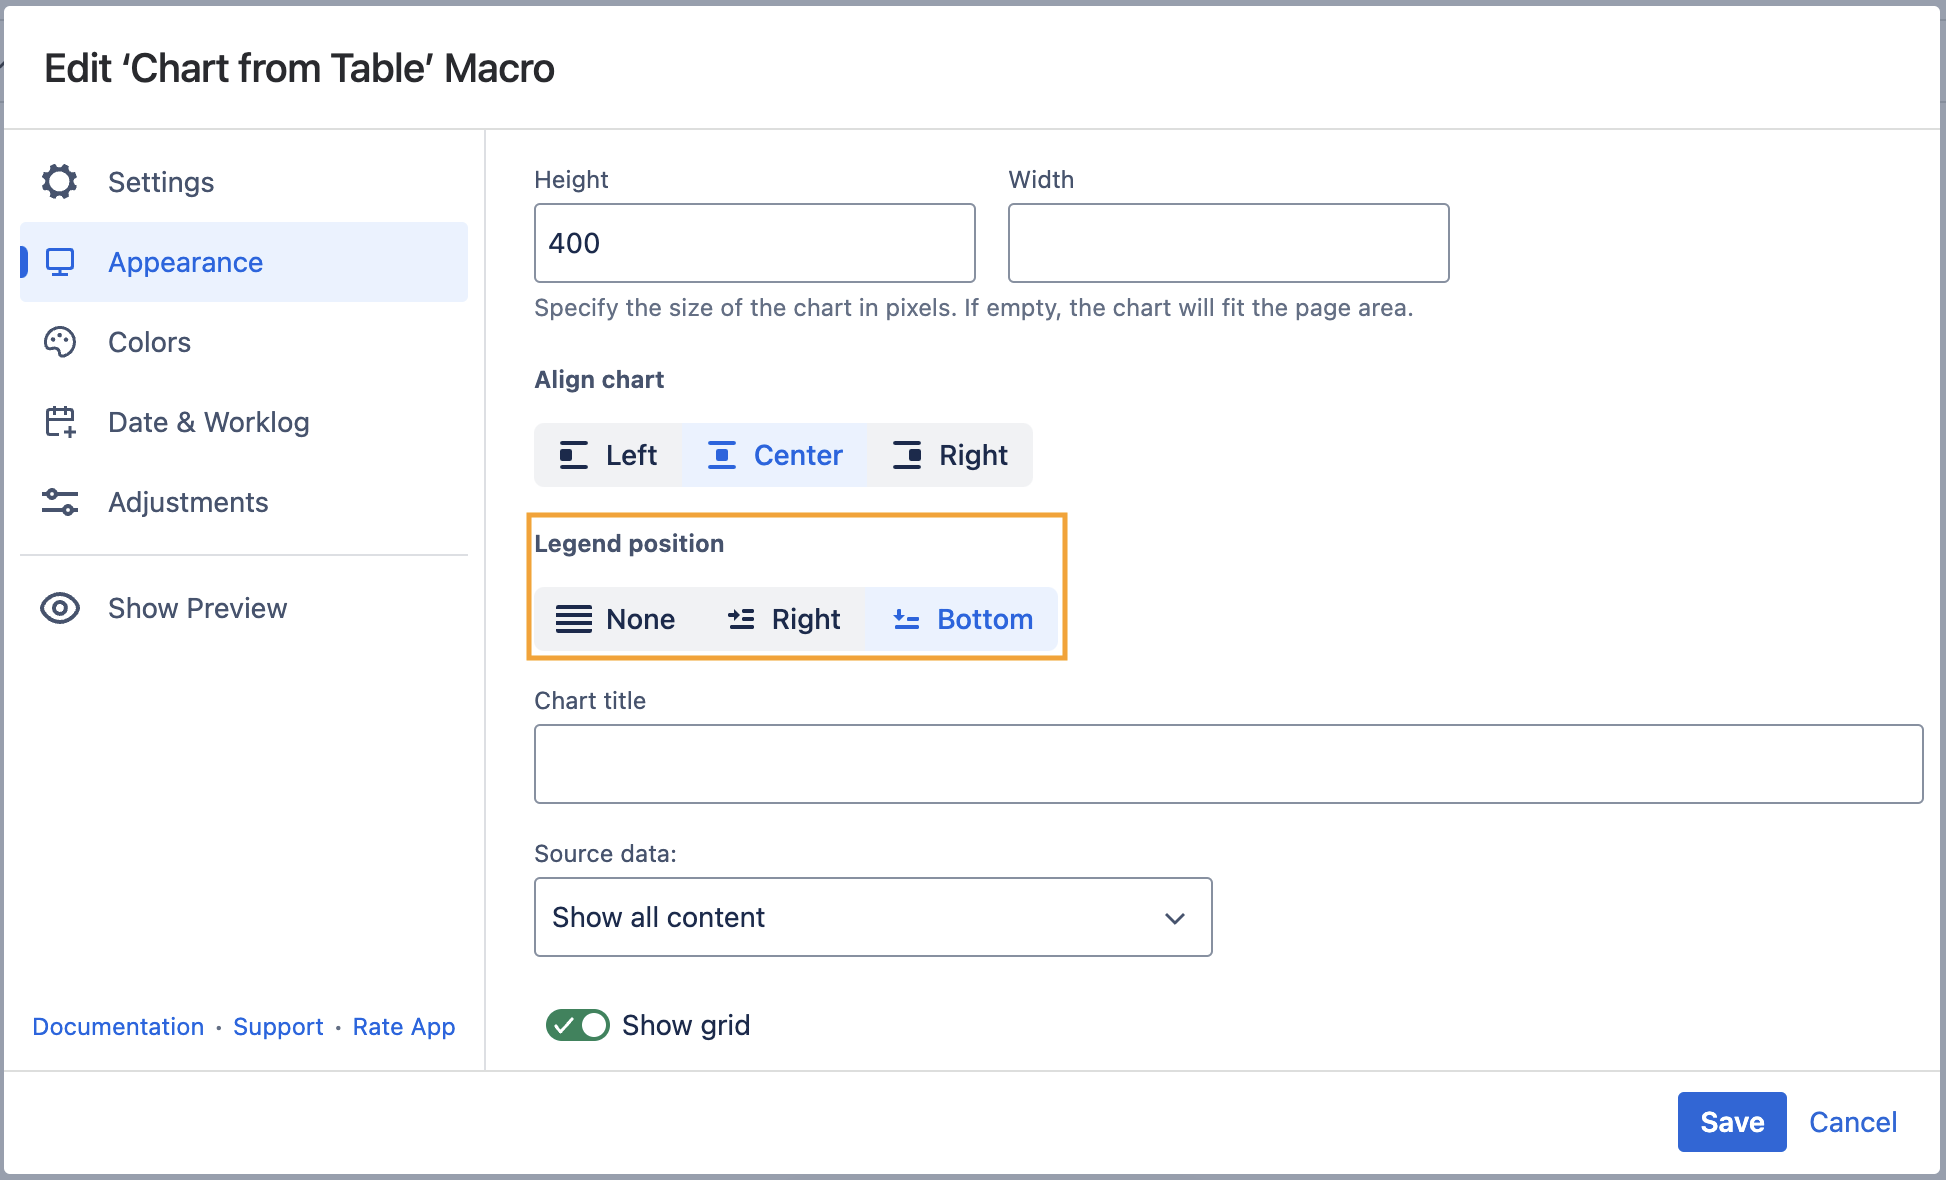
Set the legend position
- Switch the page to the edit mode.
- Select the macro and click Edit.
- Switch to the Appearance tab.
- Locate the Legend Position option.
- Select the appropriate legend position, as follows:
- None
- Right
- Bottom
- Save the macro and the page.
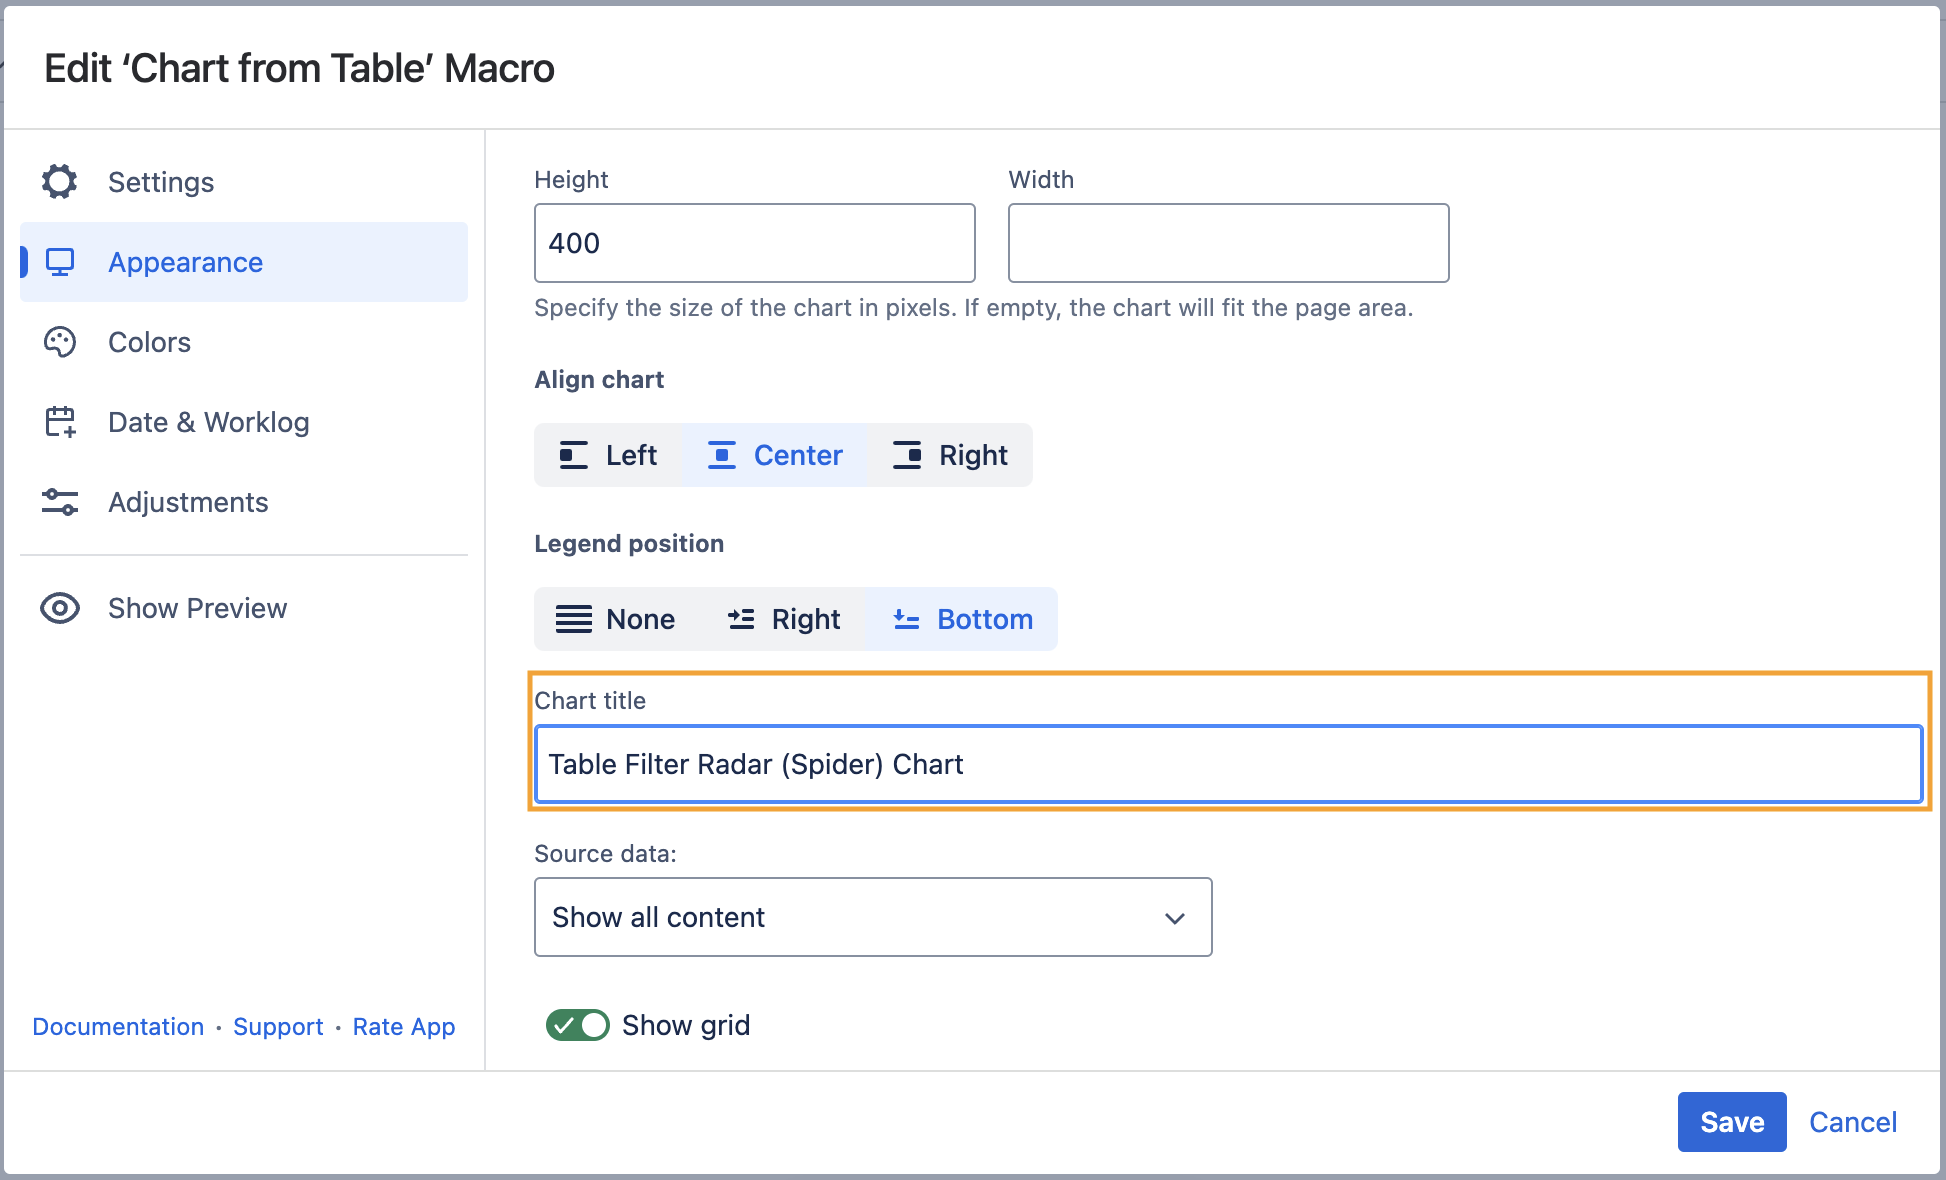
Set the chart title
- Switch the page to the edit mode.
- Select the macro and click Edit.
- Switch to the Appearance tab.
- Locate the Chart title option and enter the title.
- Save the macro and the page.
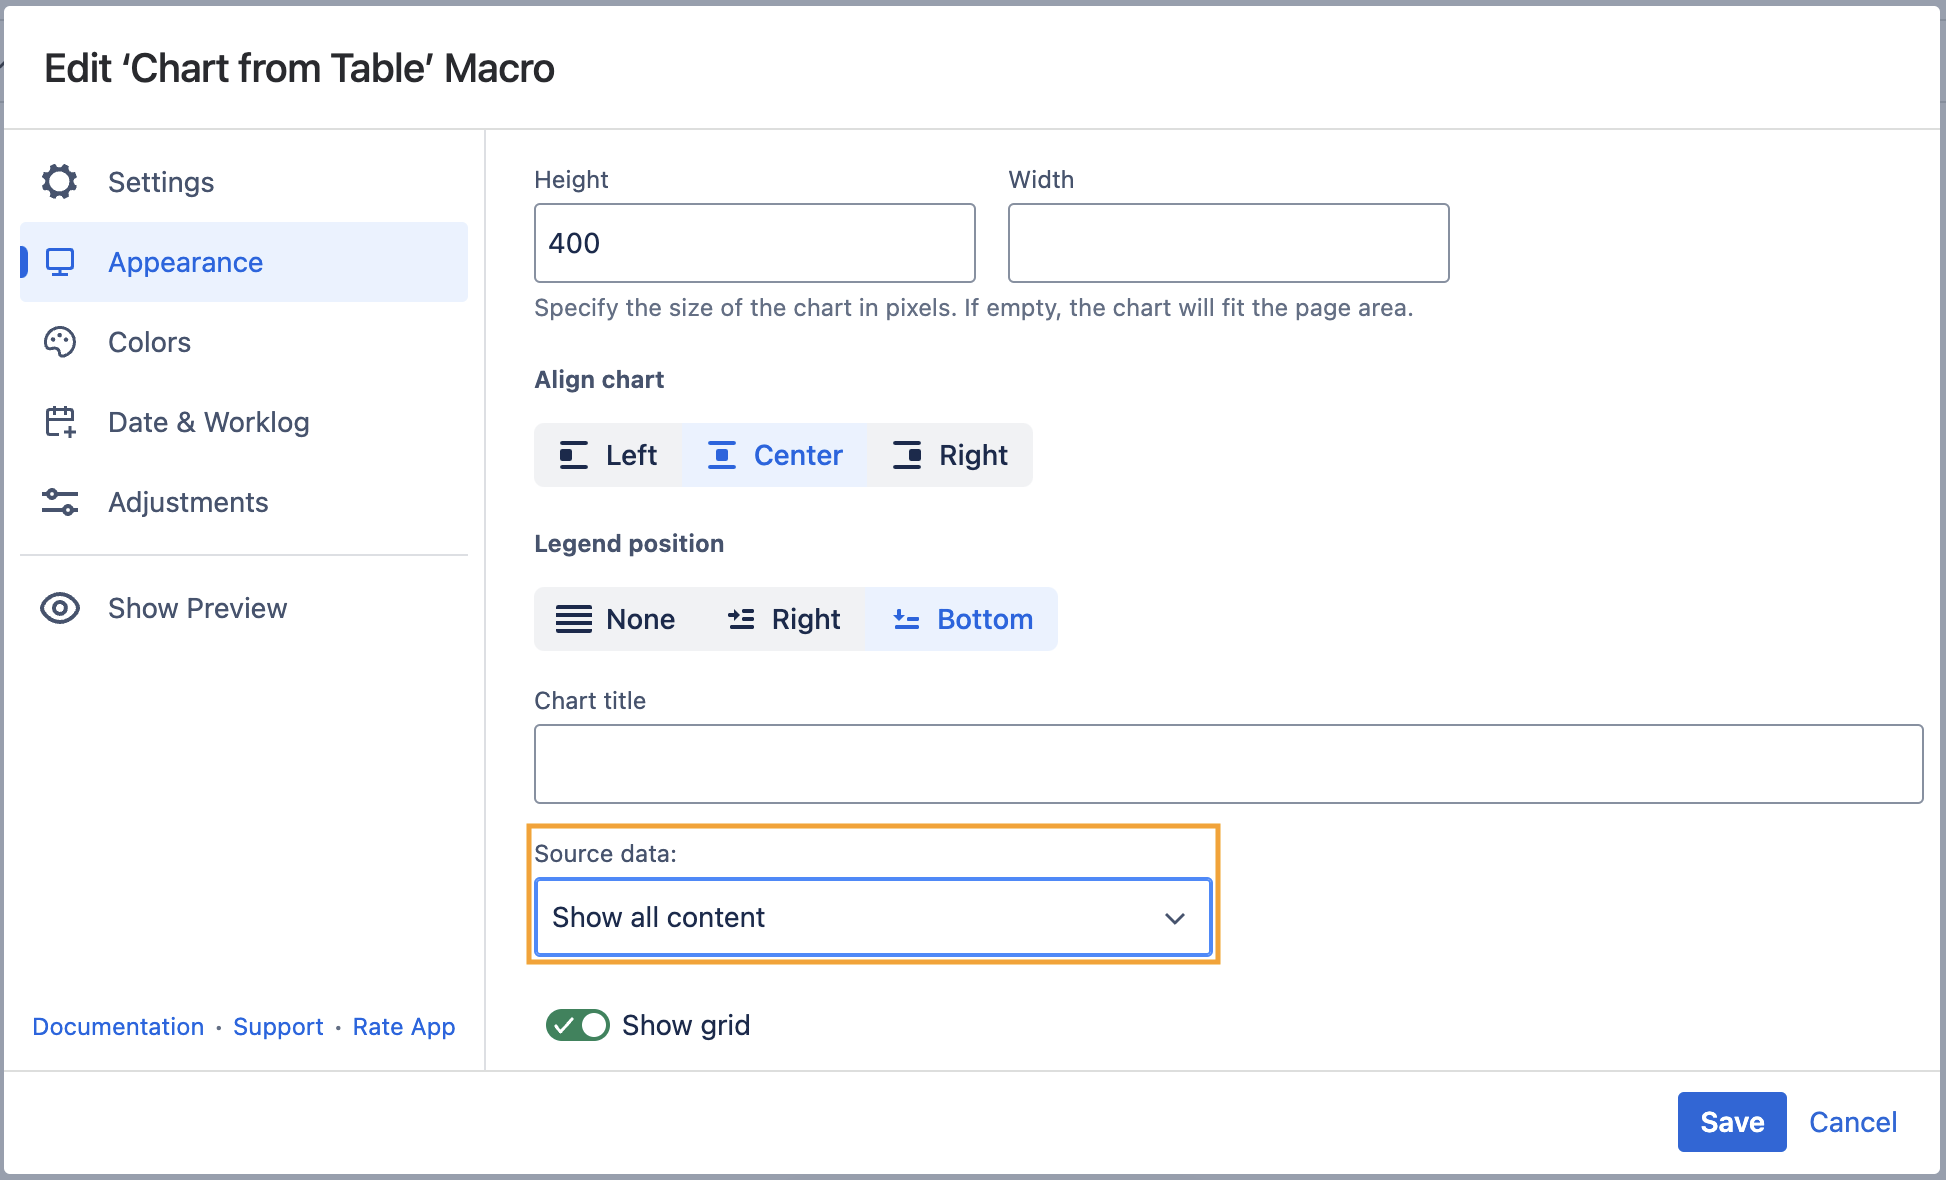
Show/Hide source data
- Switch the page to the edit mode.
- Select the macro and click Edit.
- Switch to the Appearance tab.
- Locate the Source data option and select the appropriate option, as follows:
- Show all content
- Hide tables
- Hide all content
- Save the macro and the page.
To show/hide source data in the page view mode:
- Hover over the chart controls on the right of the table.
- Click the cogwheel icon, select the Show source content, Hide source content (Hide tables, Hide all content) option.
- To save the modifications in the macro body, click the cogwheel icon and select Save changes.
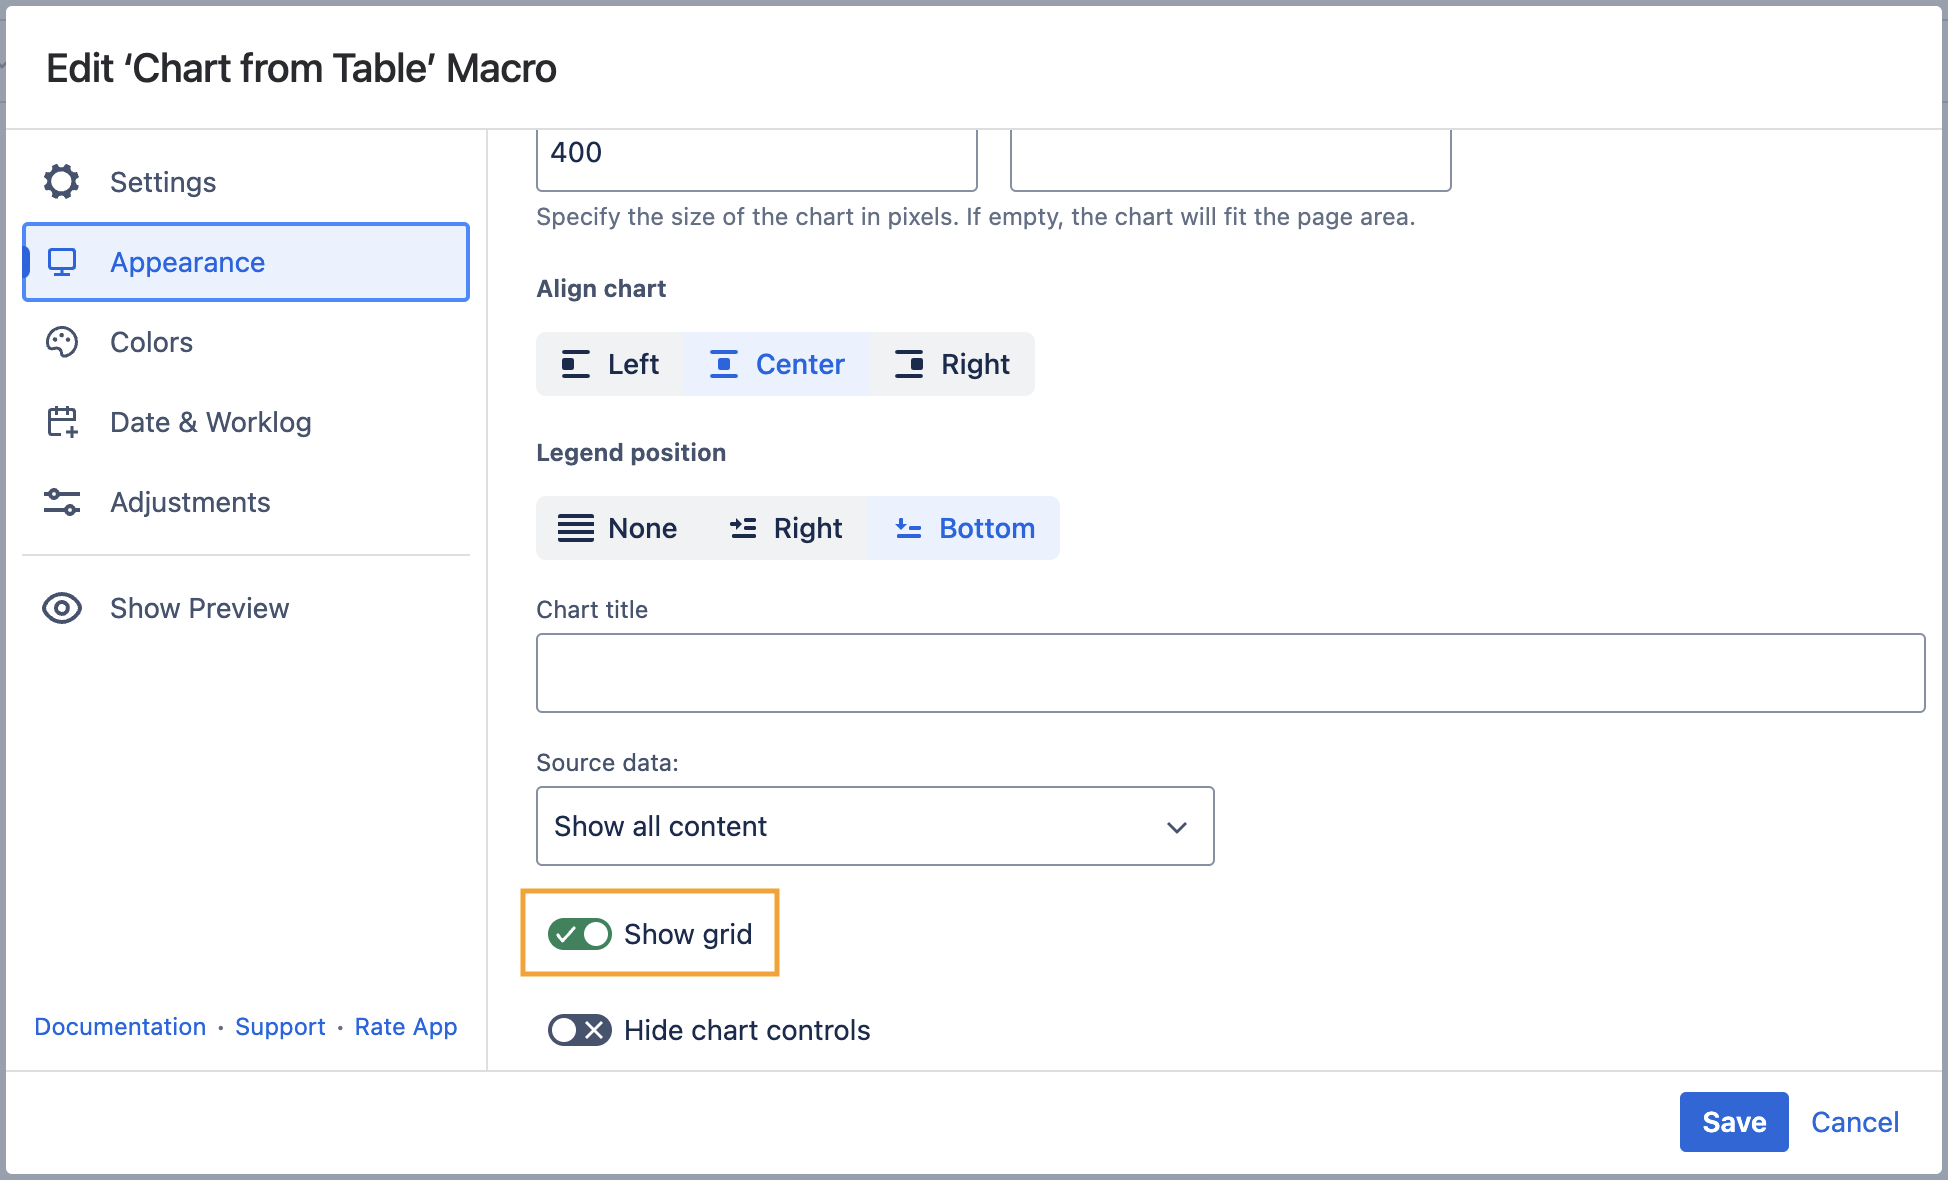
Show grid
- Switch the page to the edit mode.
- Select the macro and click Edit.
- Switch to the Appearance tab.
- Locate and enable the Show grid option.
- Save the macro and the page.
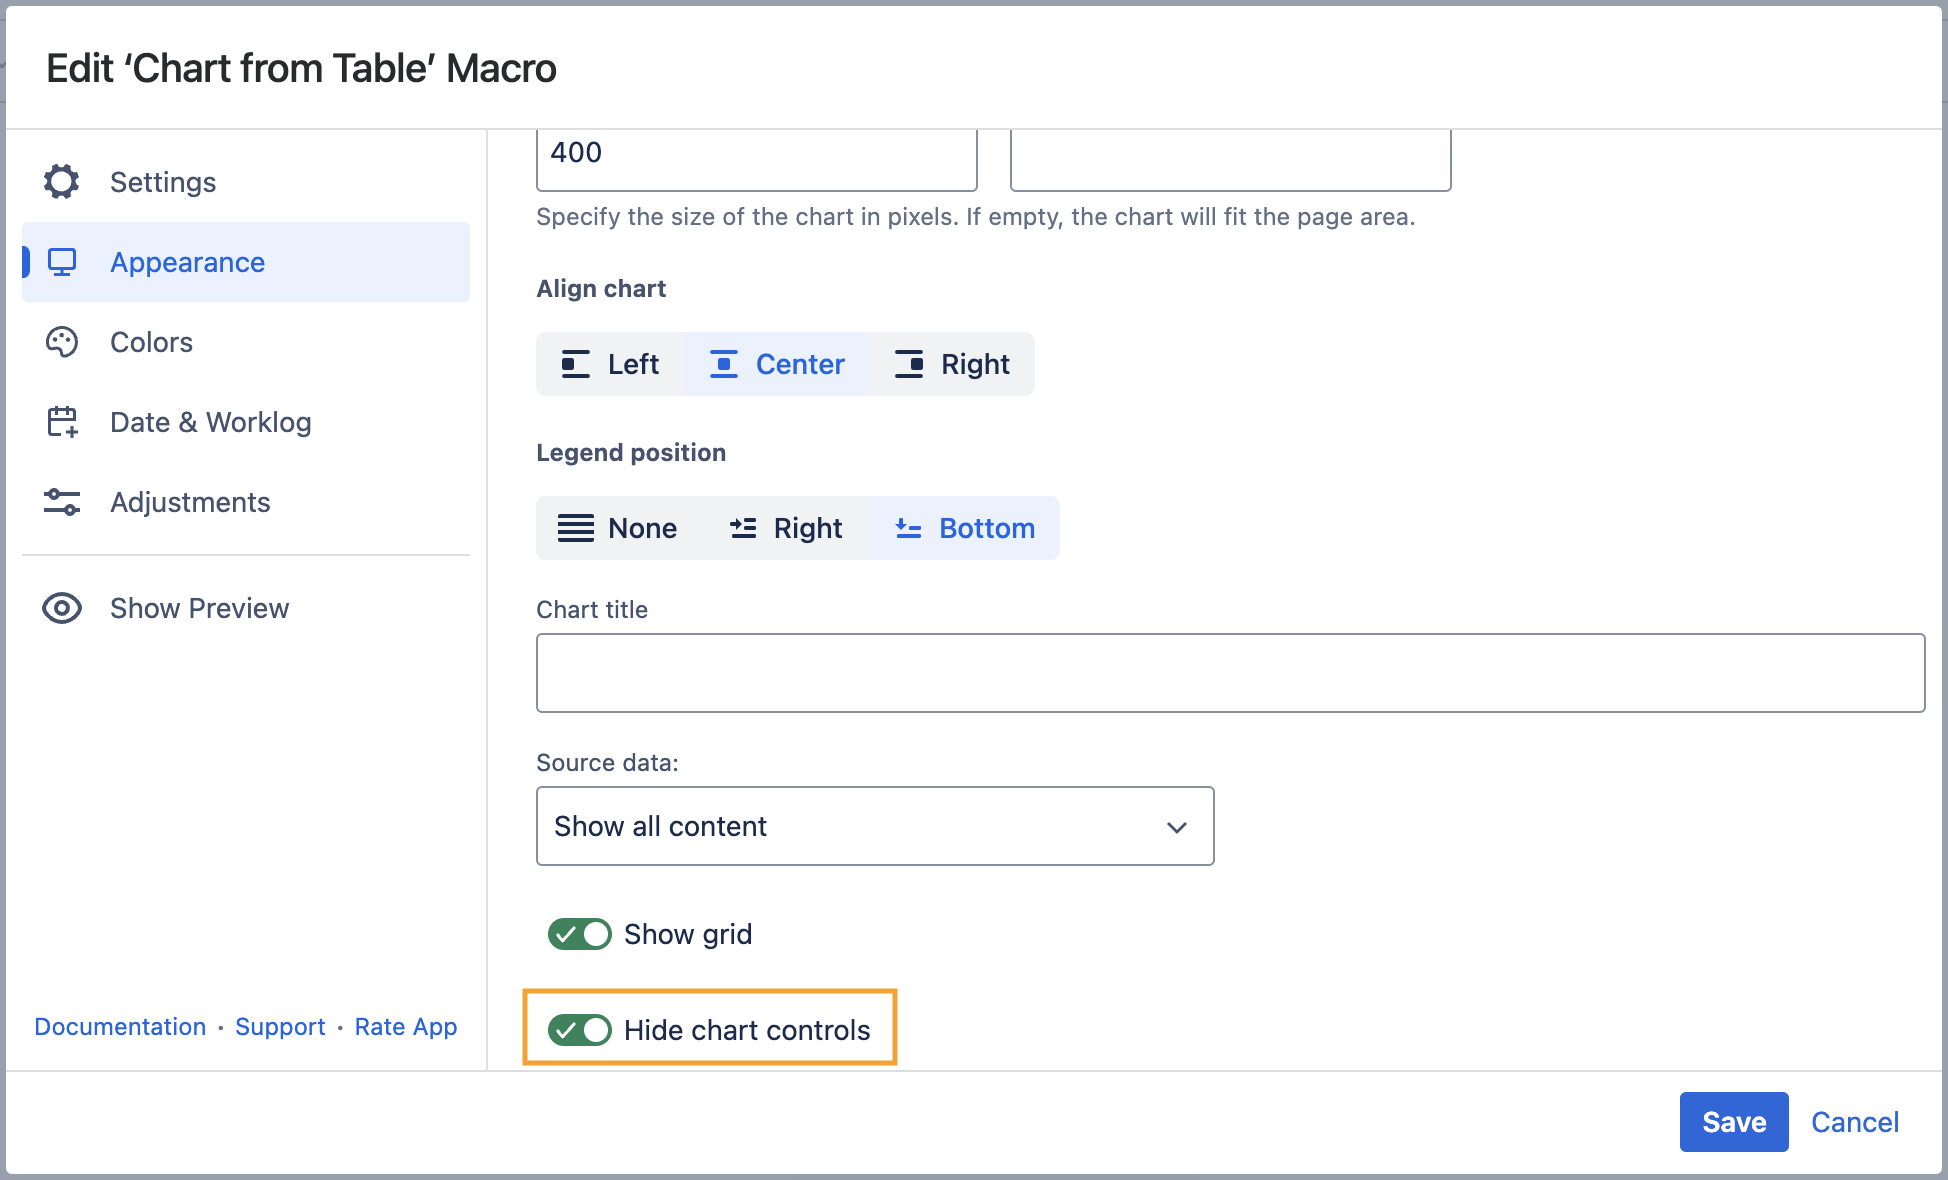
Hide chart controls
- Switch the page to the edit mode.
- Select the macro and click Edit.
- Switch to the Appearance tab.
- Locate and enable the Hide chart controls option.
- Save the macro and the page.
Colors Tab
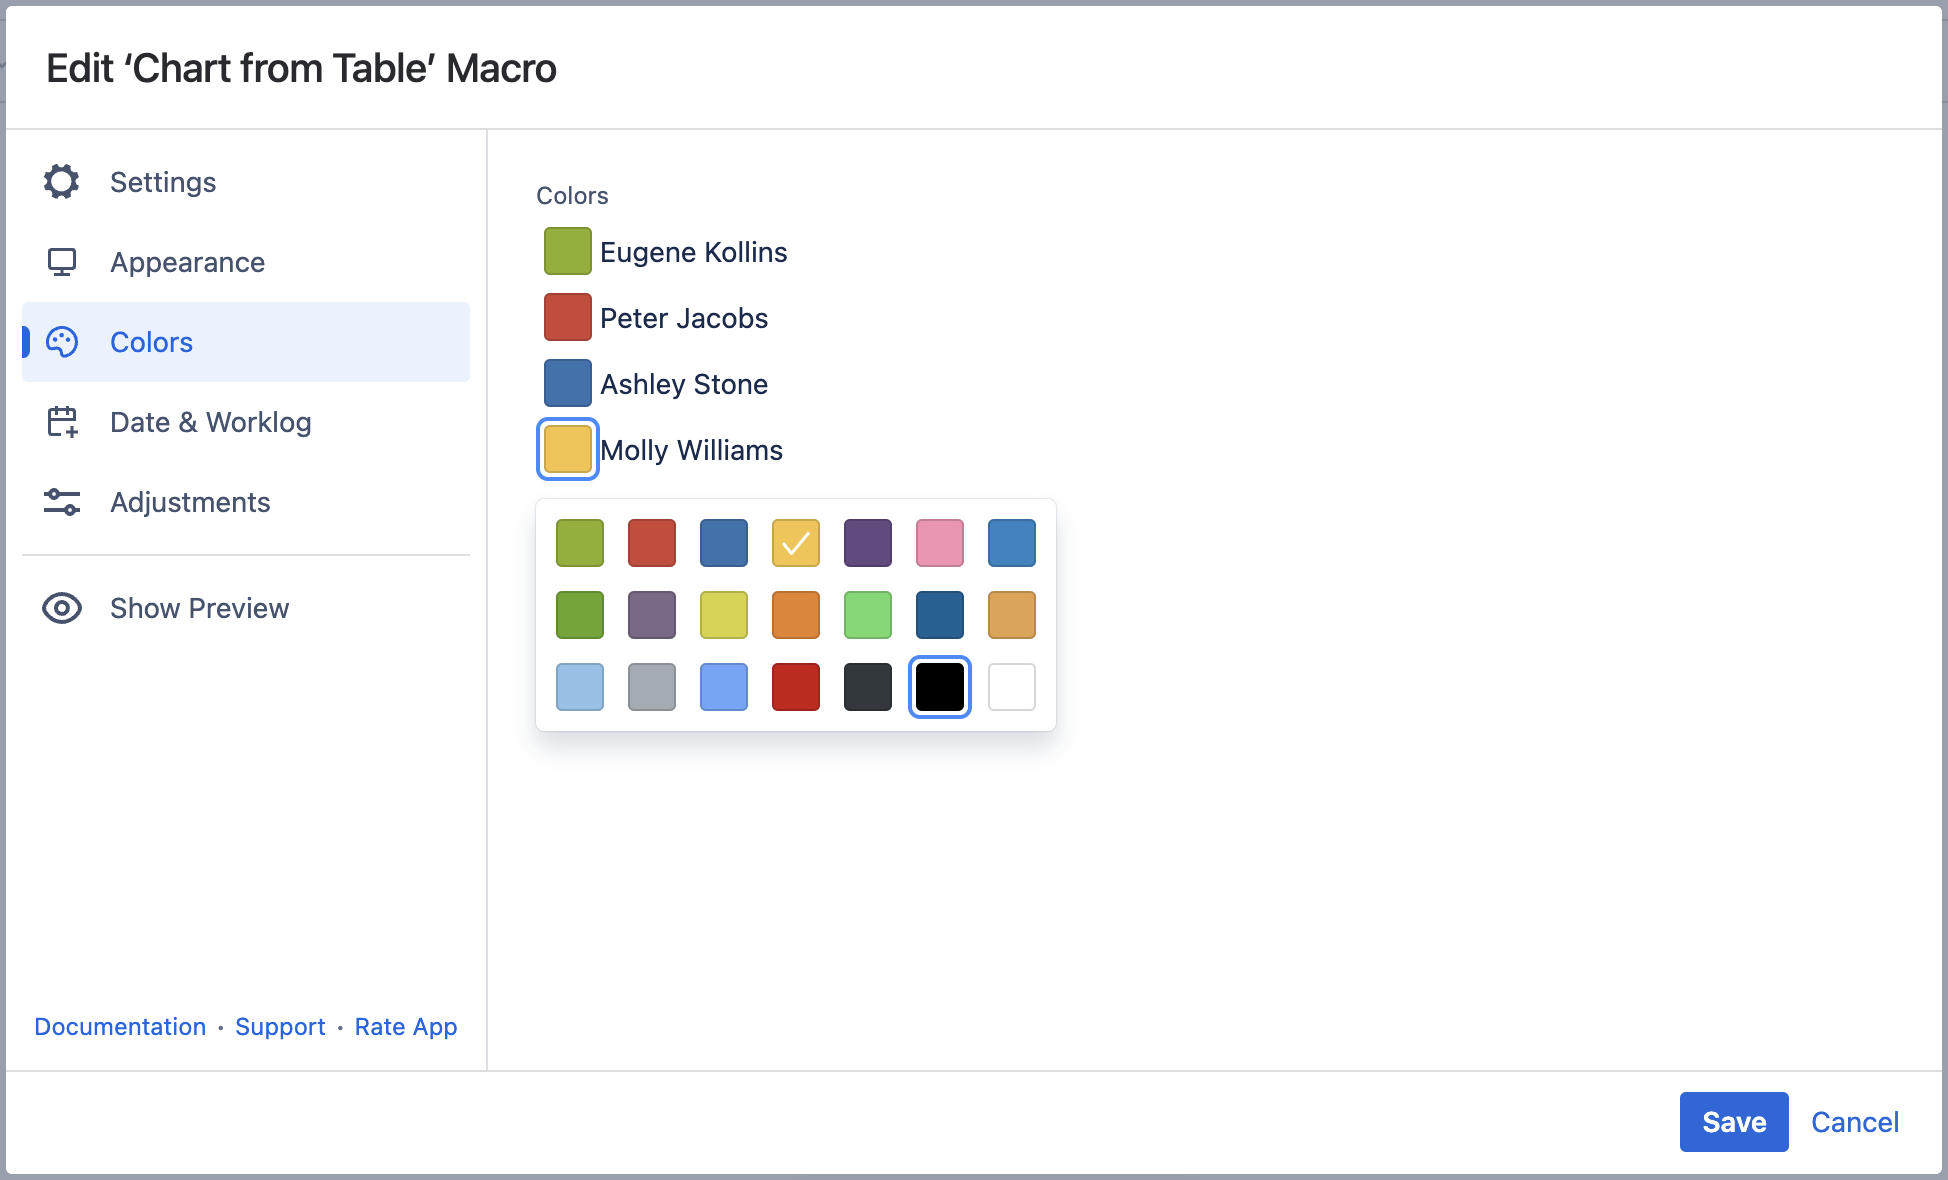
Set colors
- Switch the page to the edit mode.
- Select the macro and click Edit.
- Switch to the Colors tab.
- Select the appropriate colors for each label.
- Save the macro and the page.
To set the colors in the page view mode:
- Hover over the chart controls on the right of the table.
- Click the cogwheel icon, locate the Select colors option. After selecting colors click Save. The chart will be automatically regenerated.
- To save the modifications in the macro body, click the cogwheel icon and select Save changes.
Preview Option
While working in the edit mode, use the Show/hide preview option to adjust the required settings before saving the macro and publishing the page.