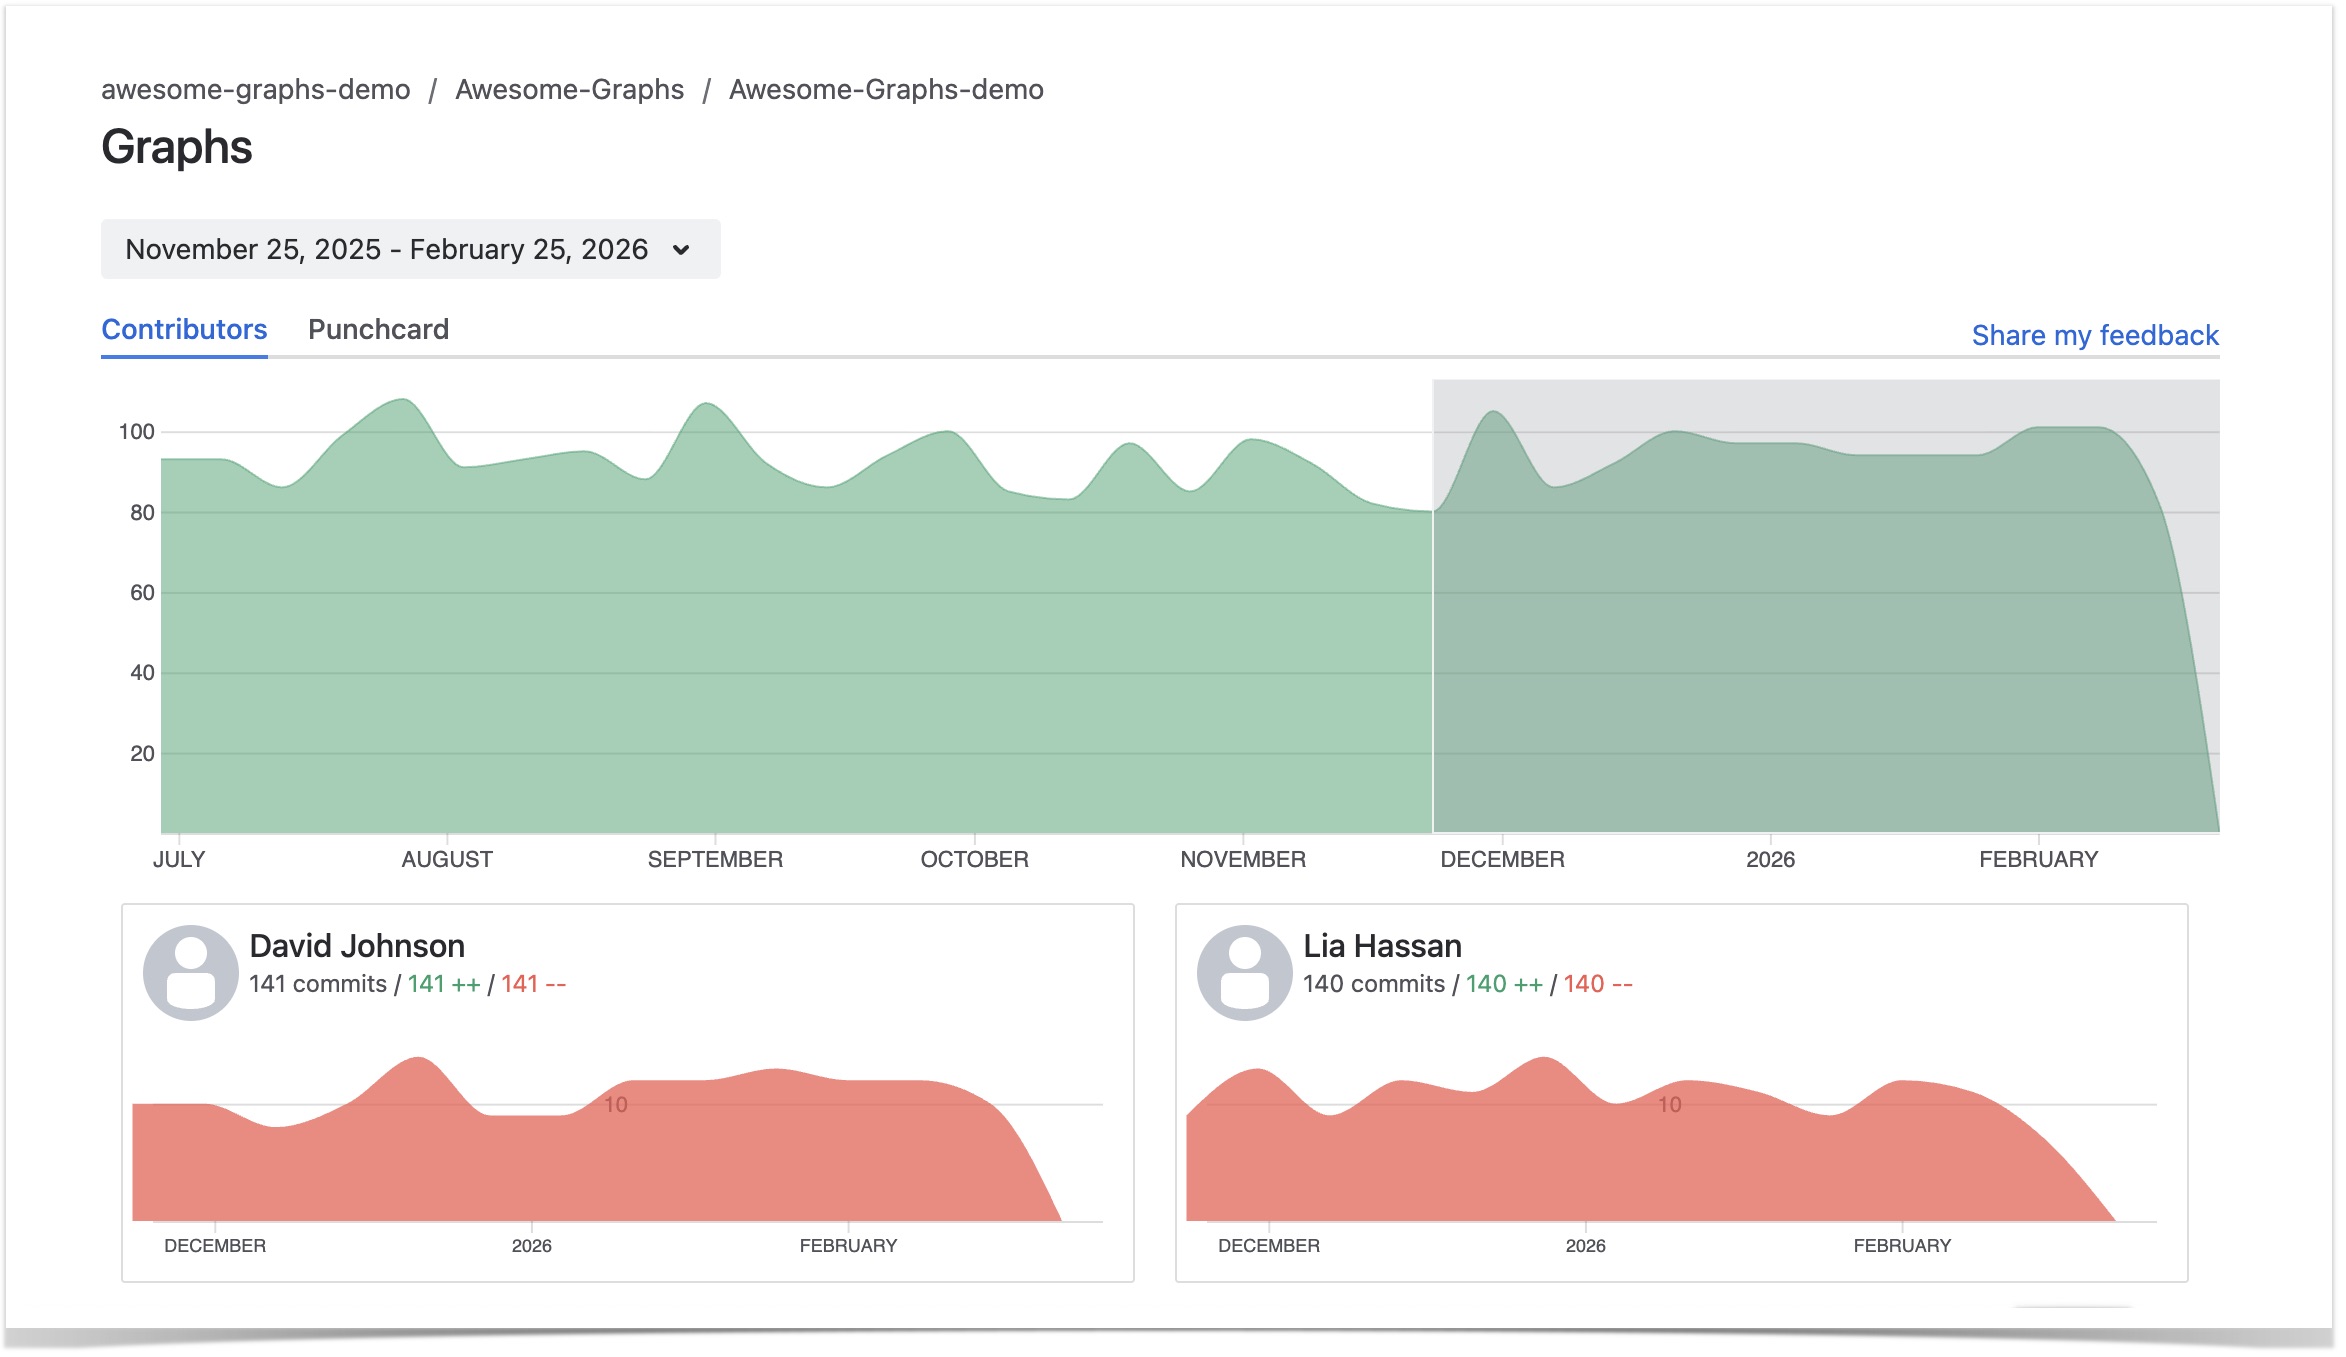
In the Contributors tab of the Graphs page, you can analyze trends and compare the input from different people in terms of commits and lines of code. The data displayed includes:
- Summary Graph representing the number of total contributions (commits/additions/deletions) made to the repository over a specific period grouped by day/week/month.
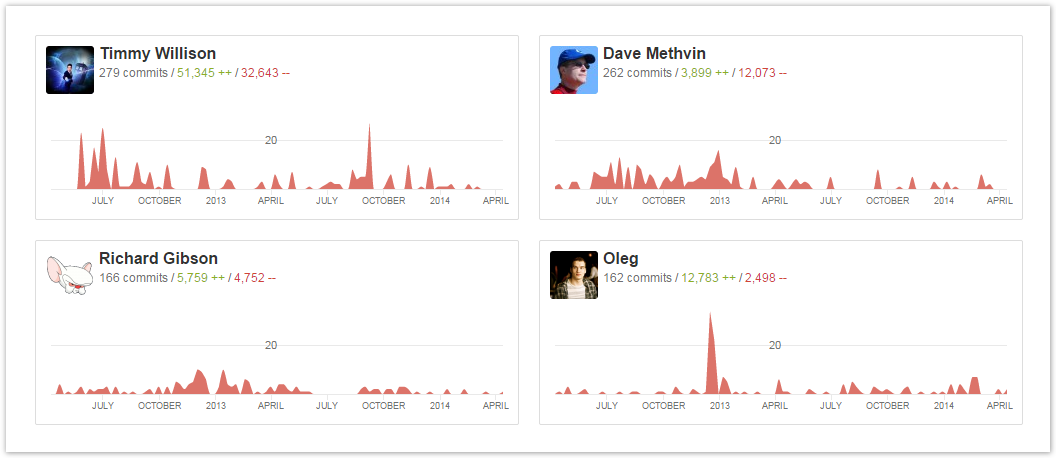
- Contributors cards with their:
- personal contribution graphs (small graphs below the summary graph) representing their individual contributions filtered according to the current summary graph settings (contribution type, time span, or by day/week/month)
- total of commits
- total of lines of code added
- total of lines of code deleted by a contributor
In order to prevent exhaustion of the rate-limits during the initial indexing, the lines of code statistics are disabled by default. If you would like to see lines of code, please follow the instructions.
Below on the page, you'll find:
- instructions on how to view the Contributors graph for workspaces, projects and repositories
- a detailed description of all elements
- an overview of the filtering capabilities
For easier navigation, use the Table of Contents at the top-right of the page.
How to generate the Contributors graph
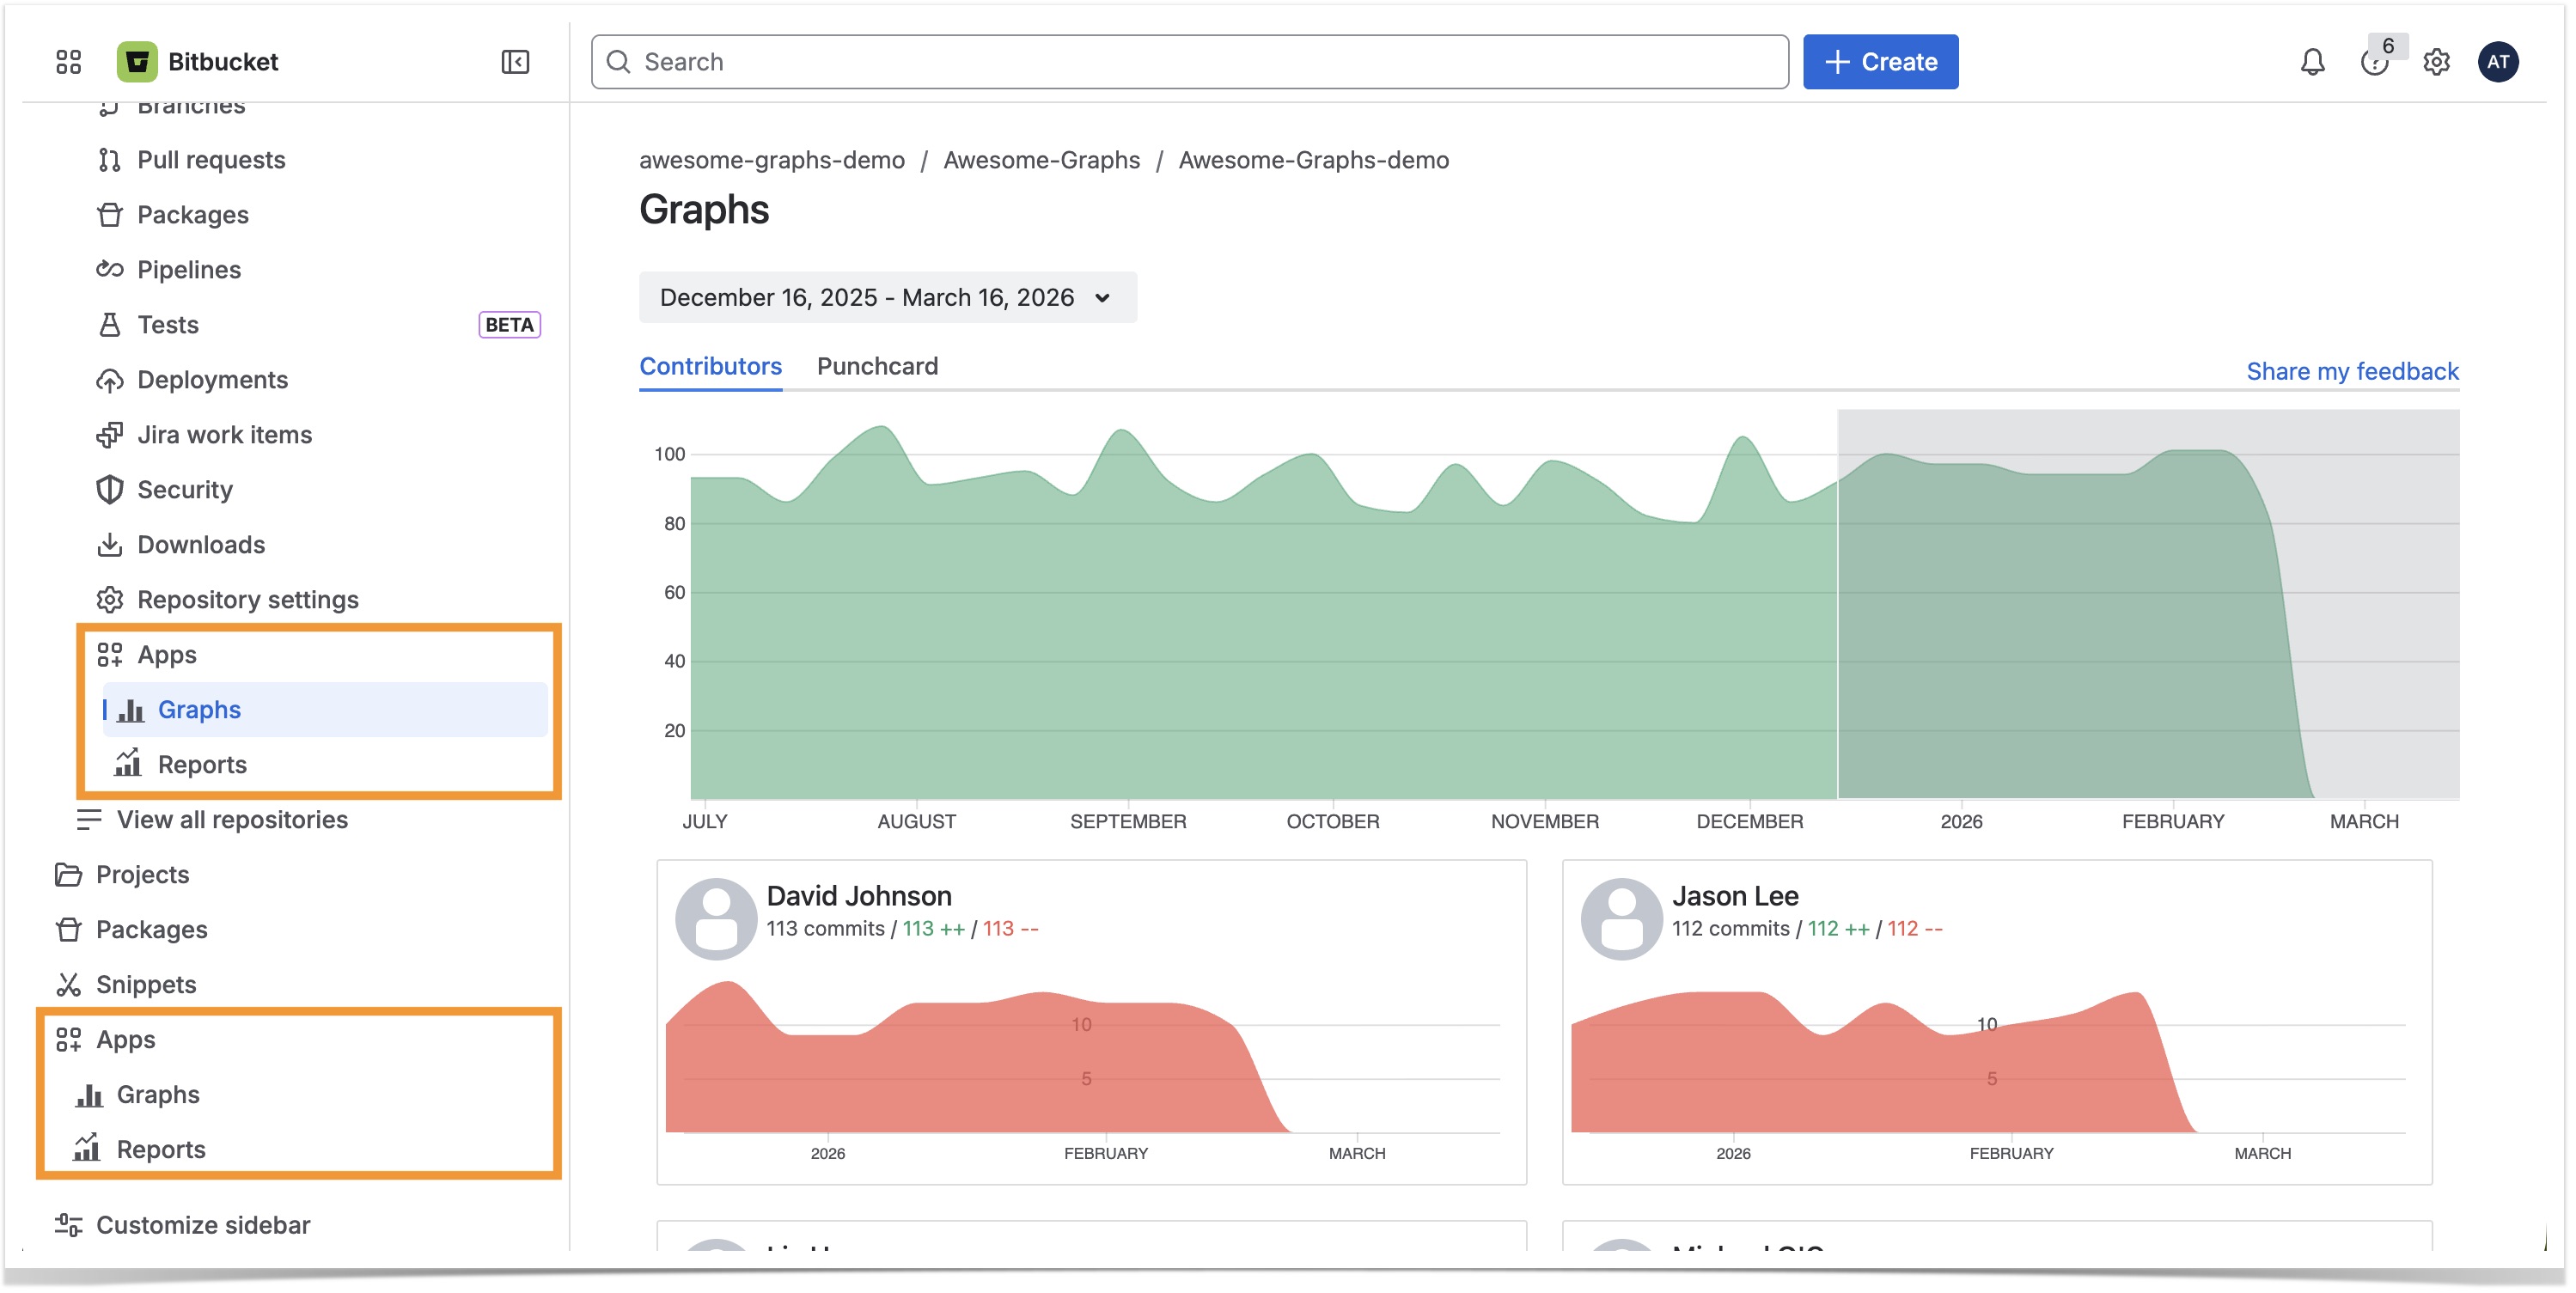
Repository
To view Contributors on the repository level:
- Navigate to the repository of your choice.
- Click on the Graphs icon in the left-hand sidebar, located under Apps.
- Choose Contributors.
Workspace and Project
To view Contributors on workspace/project level:
- In the left sidebar, click the Graphs icon under Apps.
- Choose Contributors.
Currently, lines of code data is available on the repository level only.
To view data for specific projects within your workspace:
- Navigate to the Graphs section.
- Select the Contributors tab on the Graphs page.
- Locate the Projects selector positioned above the graph display area.
- Click on the dropdown menu to open the list of available projects.
- Select one or more projects from the list.
- You can select a single project to focus on its individual data.
- Or select multiple projects to compare data across them.
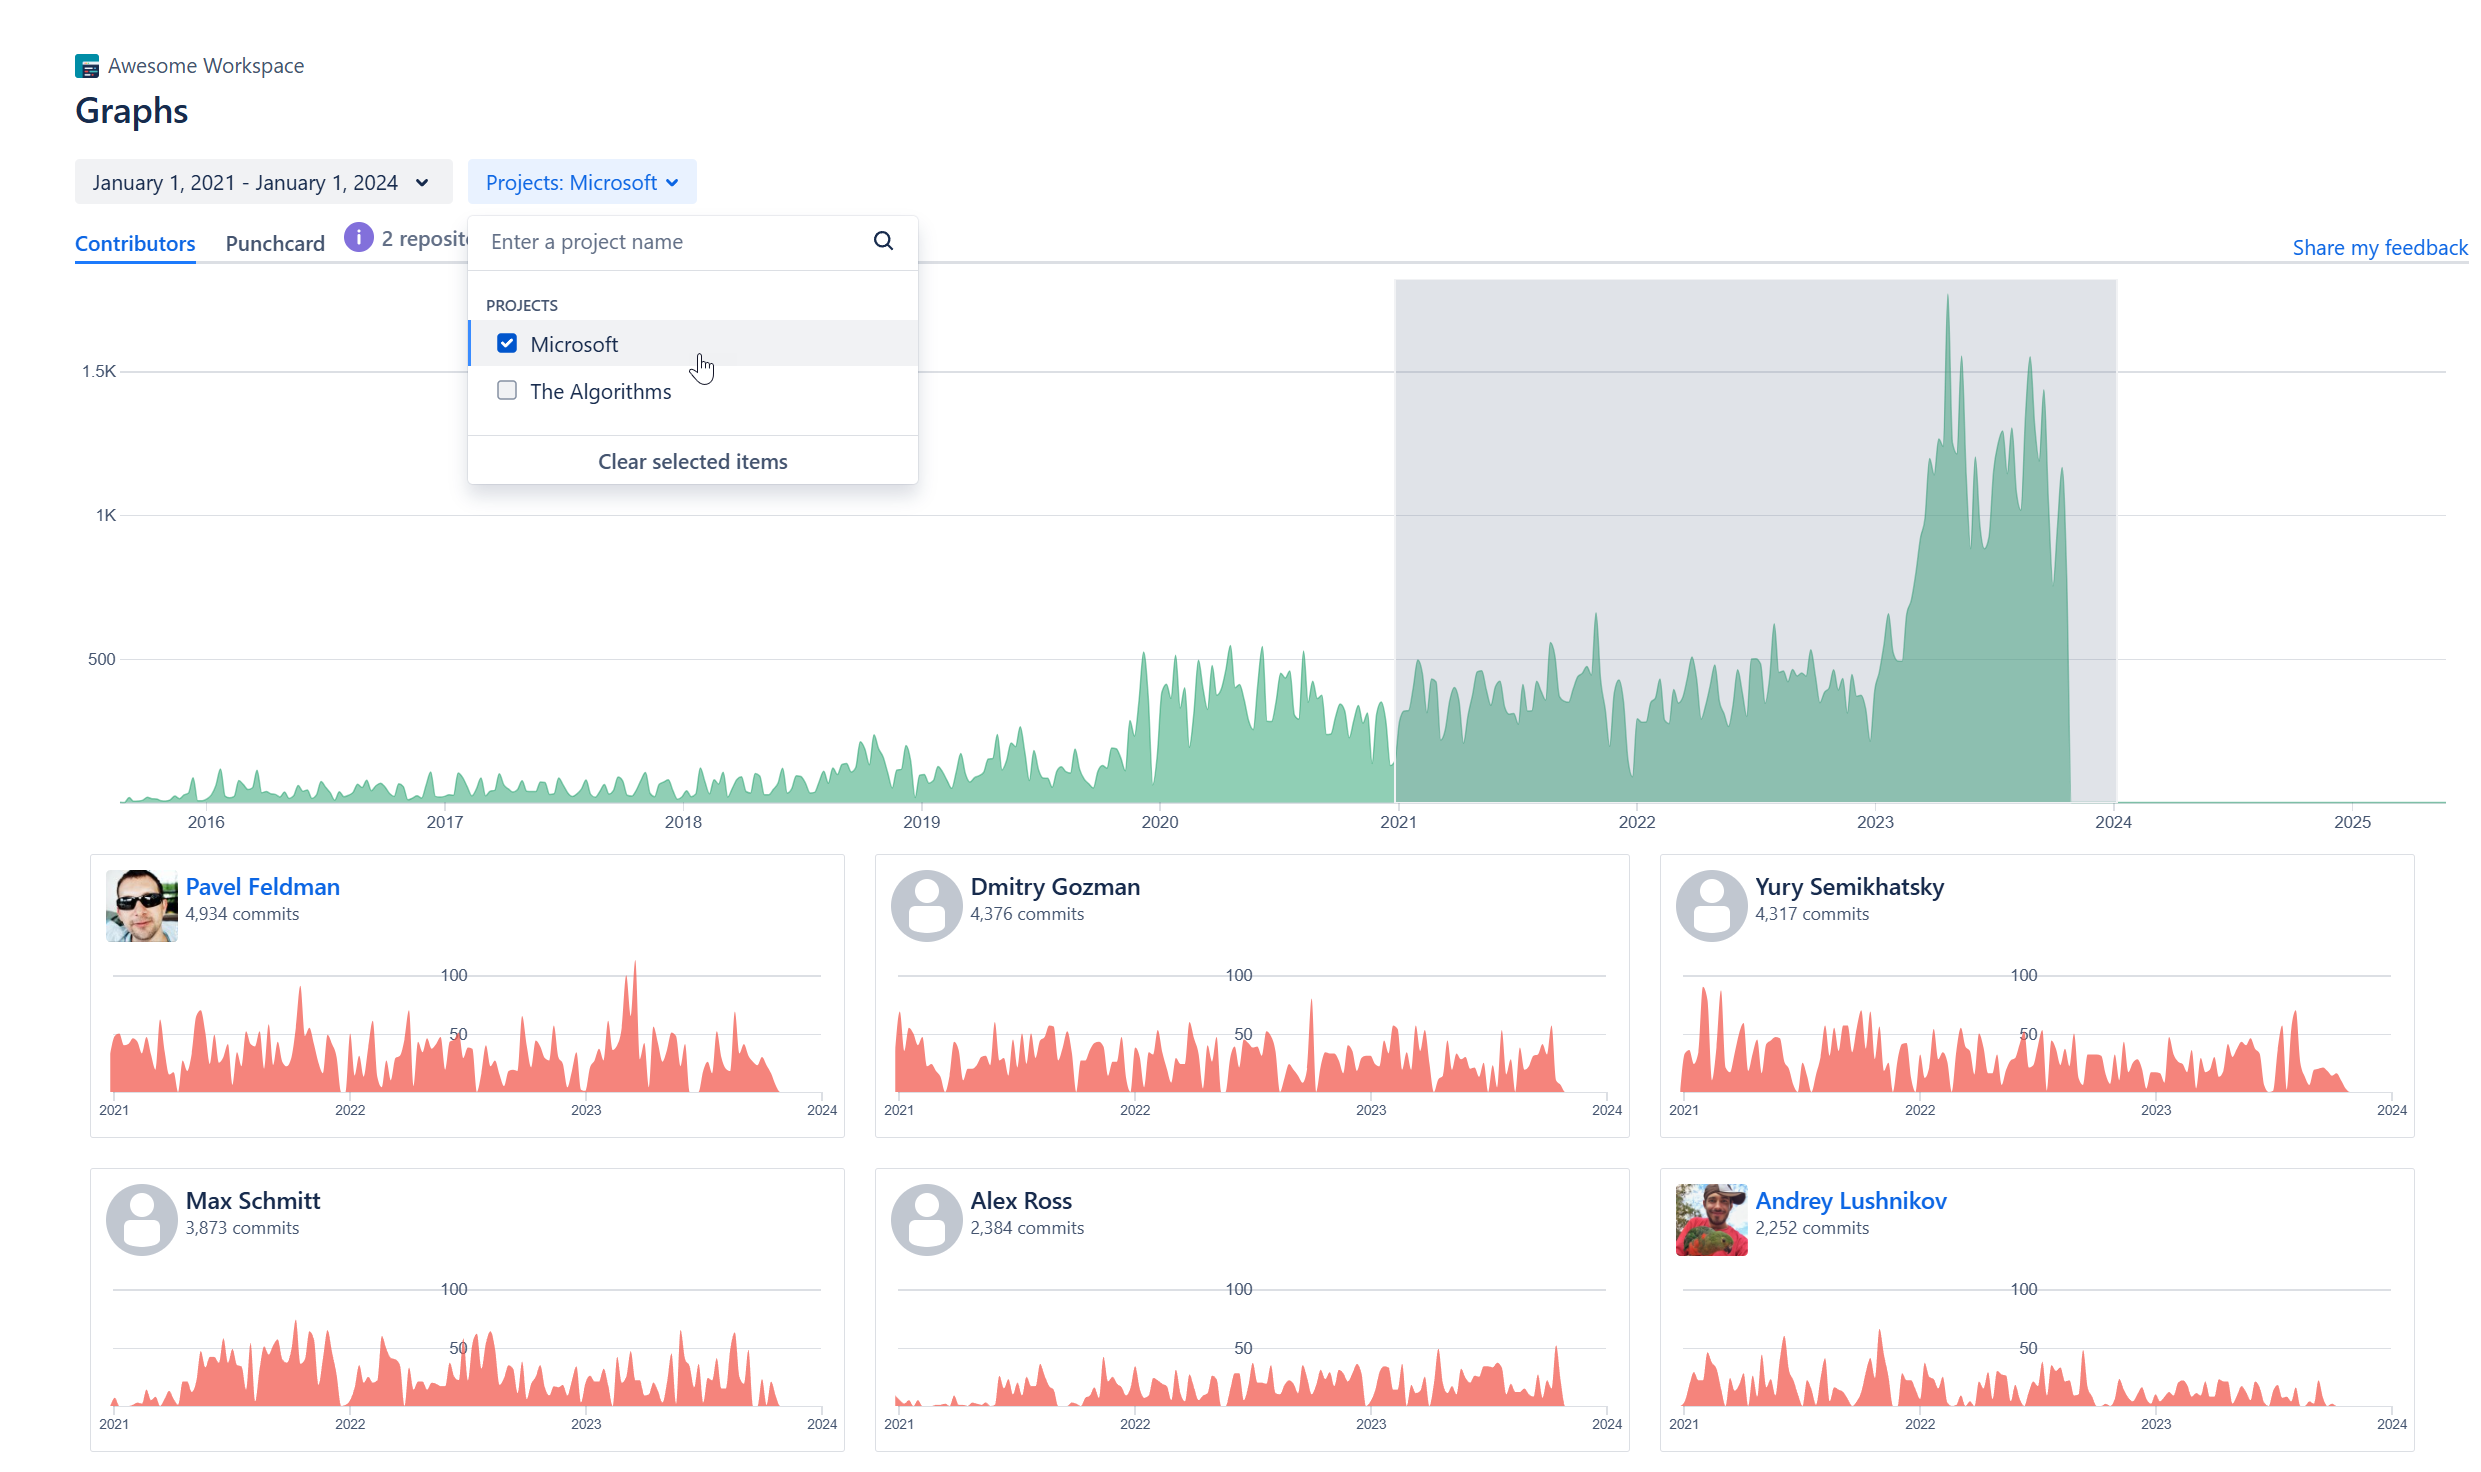
Once selected, the chart will automatically update to reflect the data for the chosen projects.
You can track the changes made to the codebase over time in the Summary Graph and find the top contributors quickly using the Contributors cards.
Summary Graph
Summary Graph displays the number of total contributions in terms of commits, lines of code added, and deleted in a workspace, a project, or a repository over a specific period.
Contributors List
The contributors are ordered by the number of commits they made in the repository, project, or workspace.
Here, contributors' names can be text or links. If it's text, that means that the contributor is not a Bitbucket user.
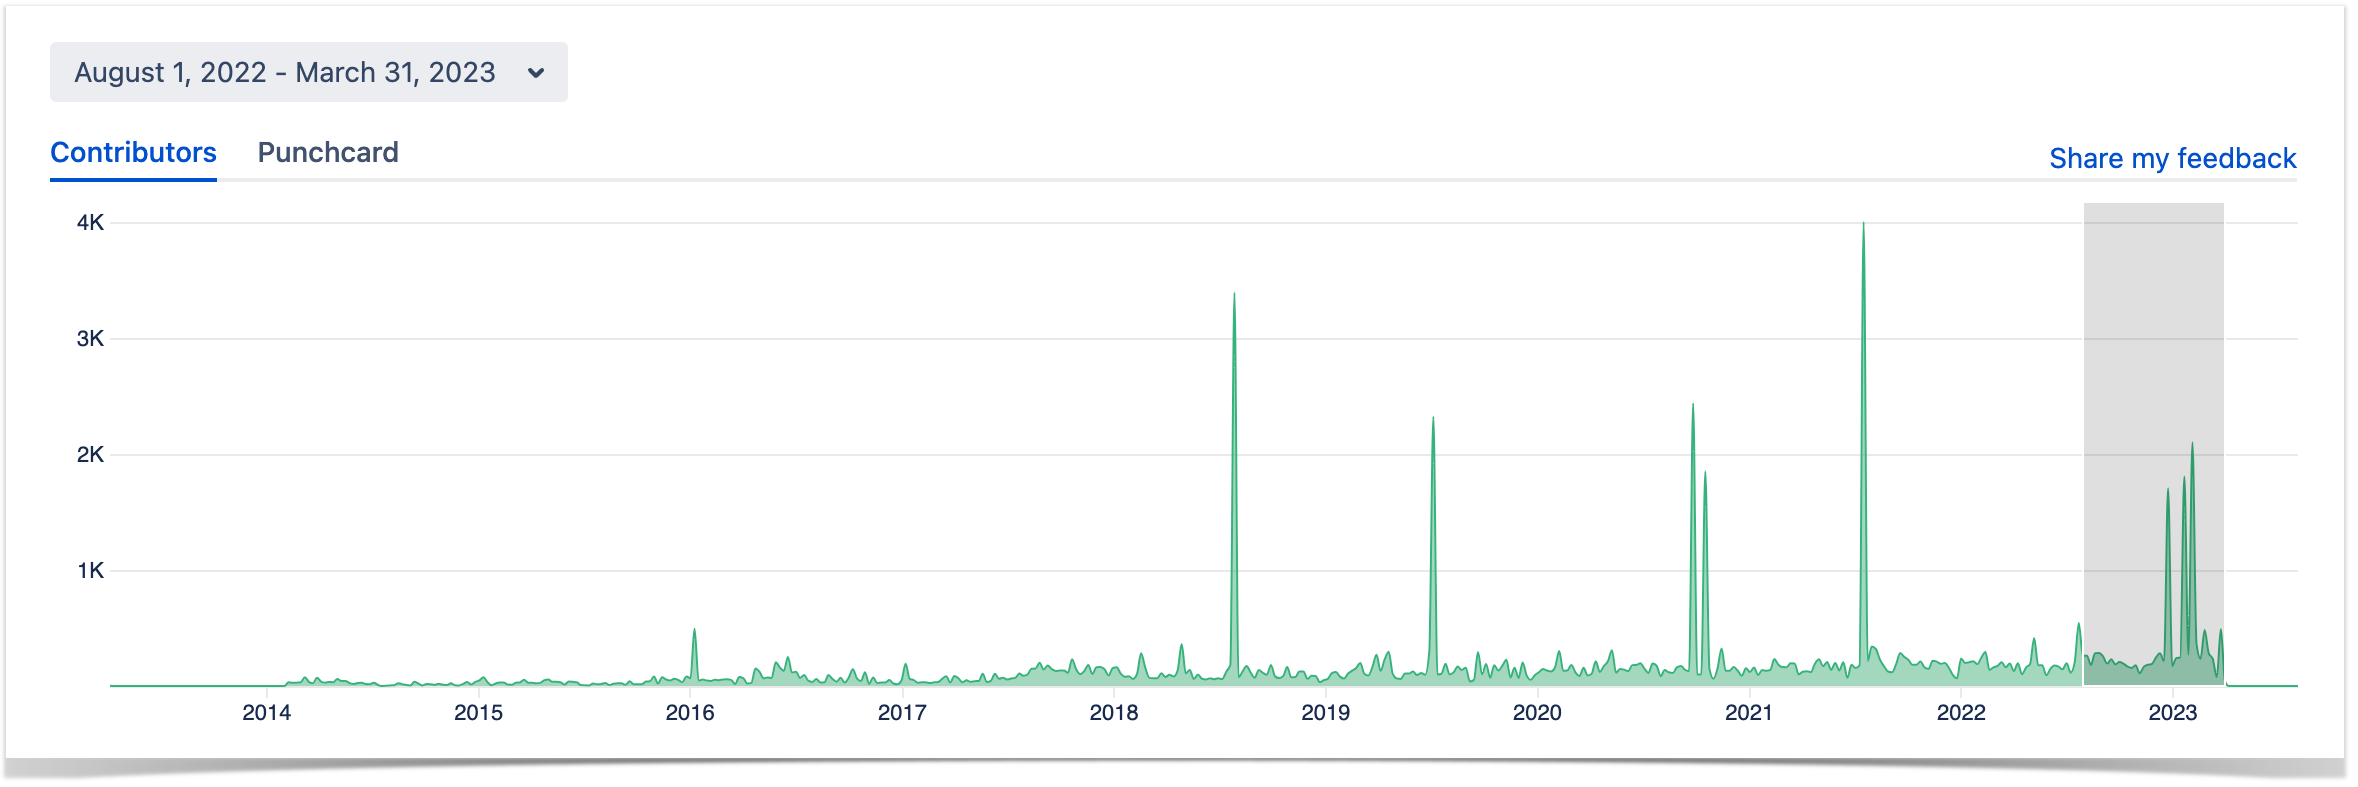
Filtering the displayed data
You can filter all the information displayed in the Contributors tab by the time period.
To select a custom time period, use the filter located above the graph.