The Awesome Graphs for Bitbucket app provides you with a set of commit graphs and reports to analyze activity in your workspace, projects and individual repositories. Here's the list of commits graphs and reports available at the moment:
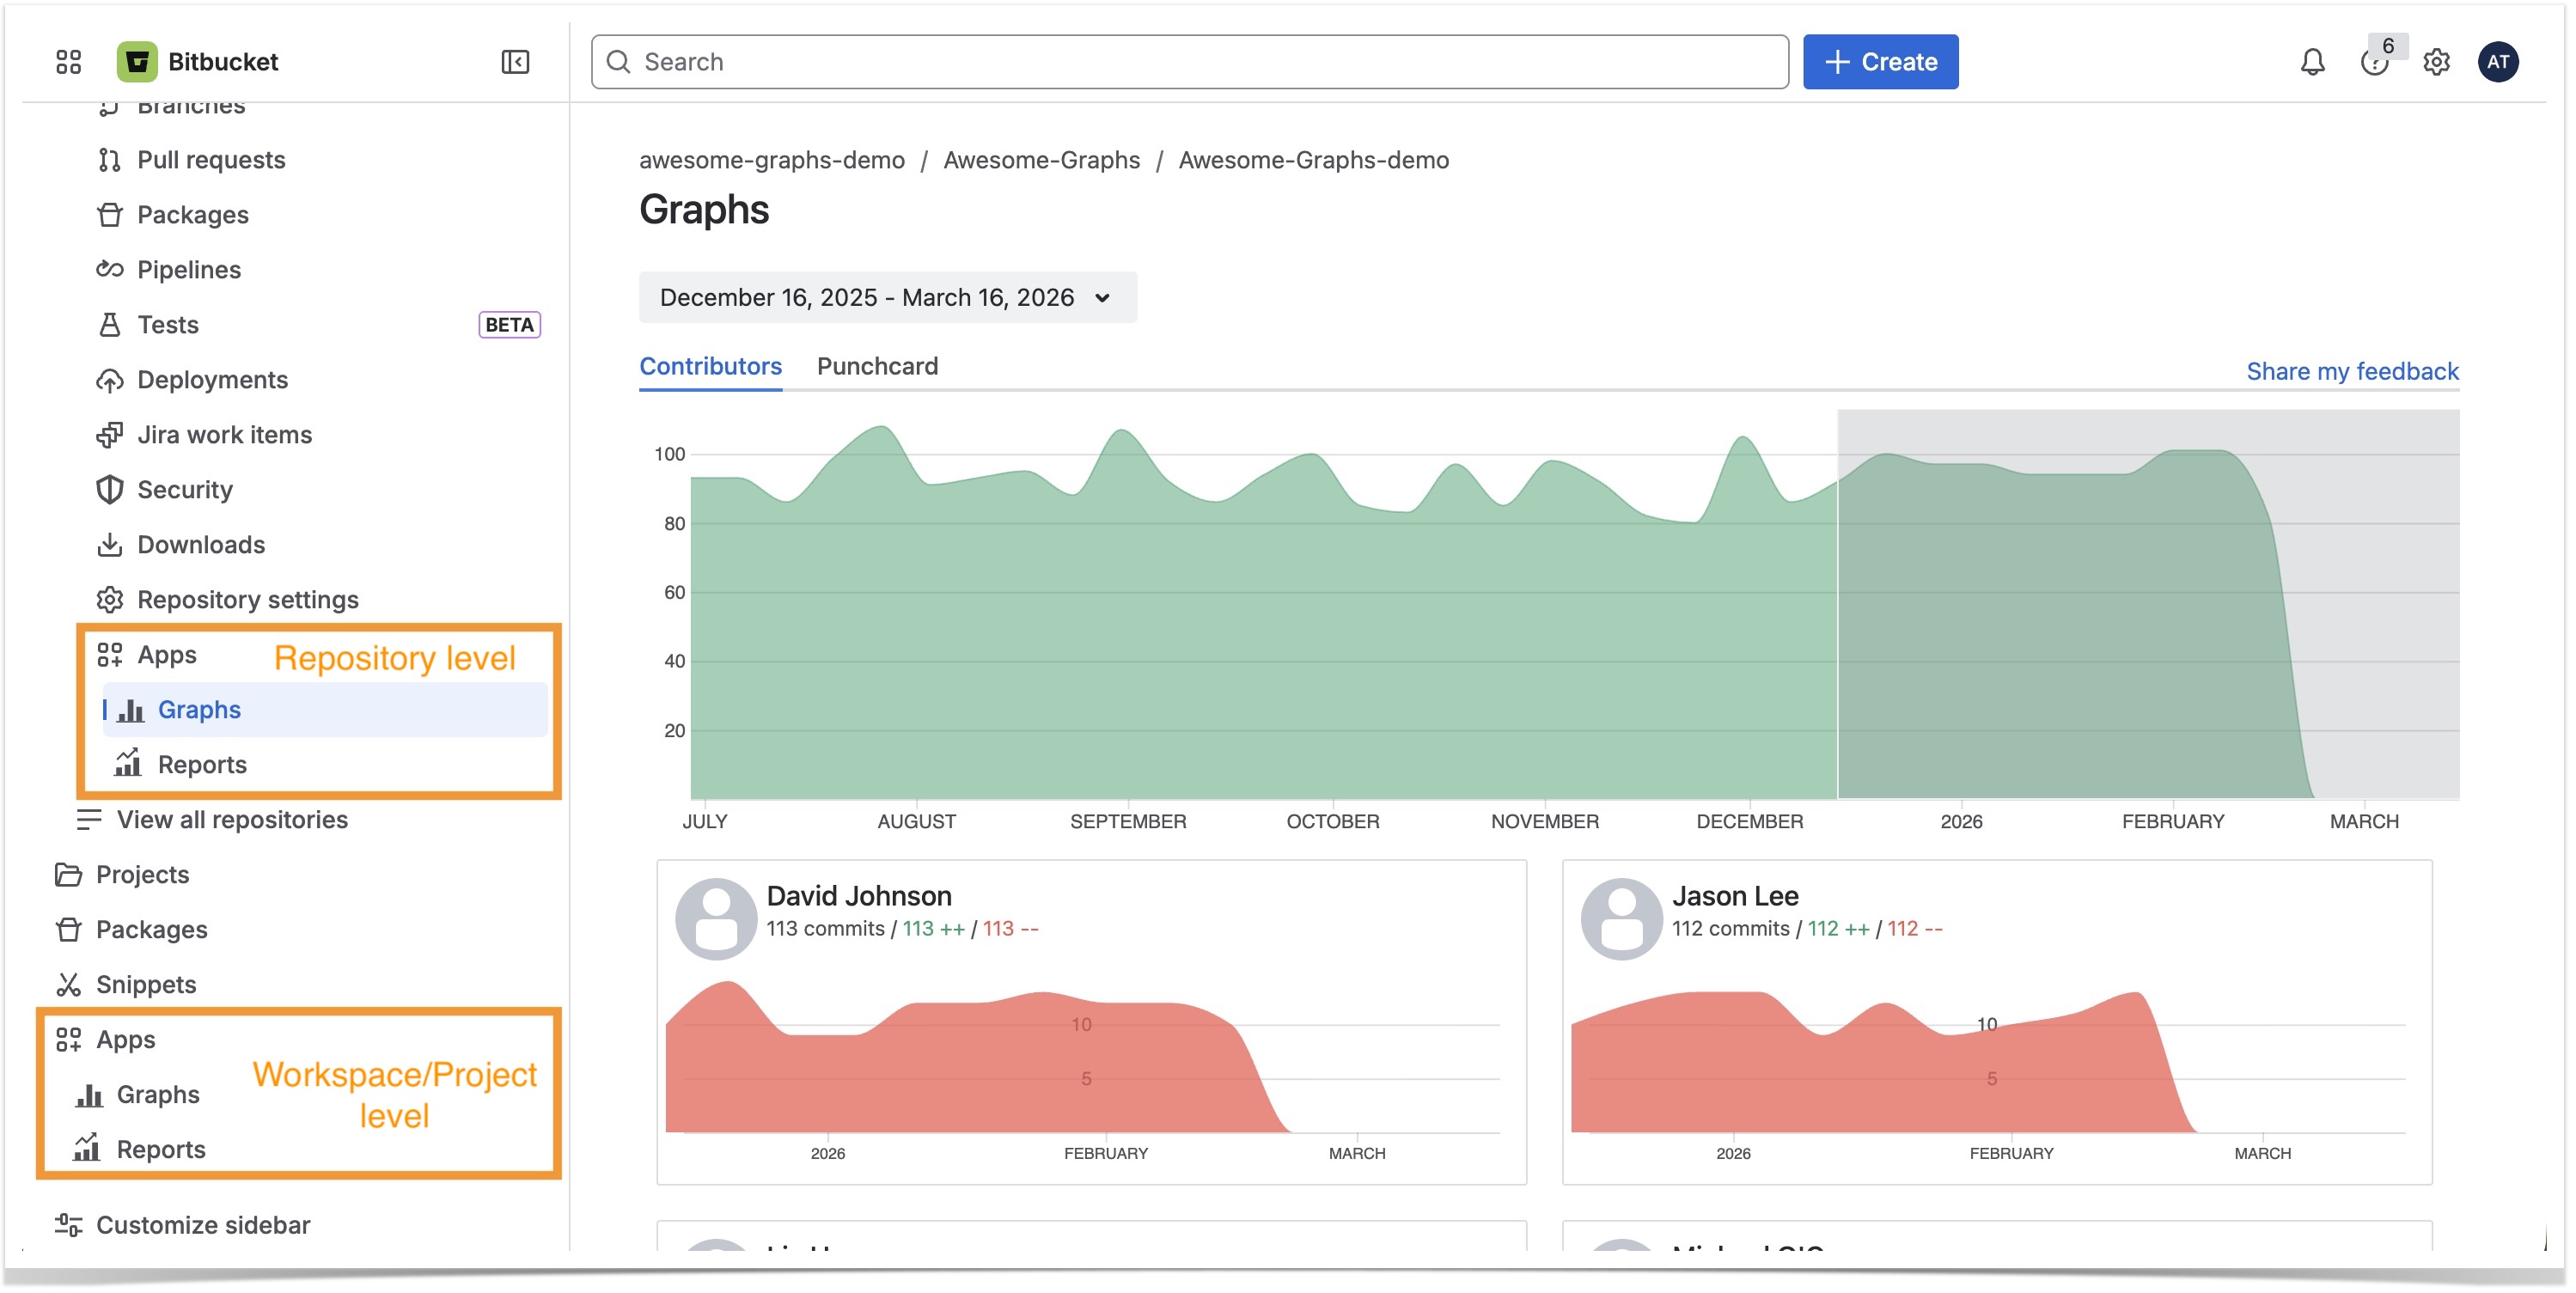
To access the graphs and reports, you need to go to the workspace or repository in Bitbucket you'd like to examine and click on the Graphs or Reports icons in the left-hand navigation bar under Apps.
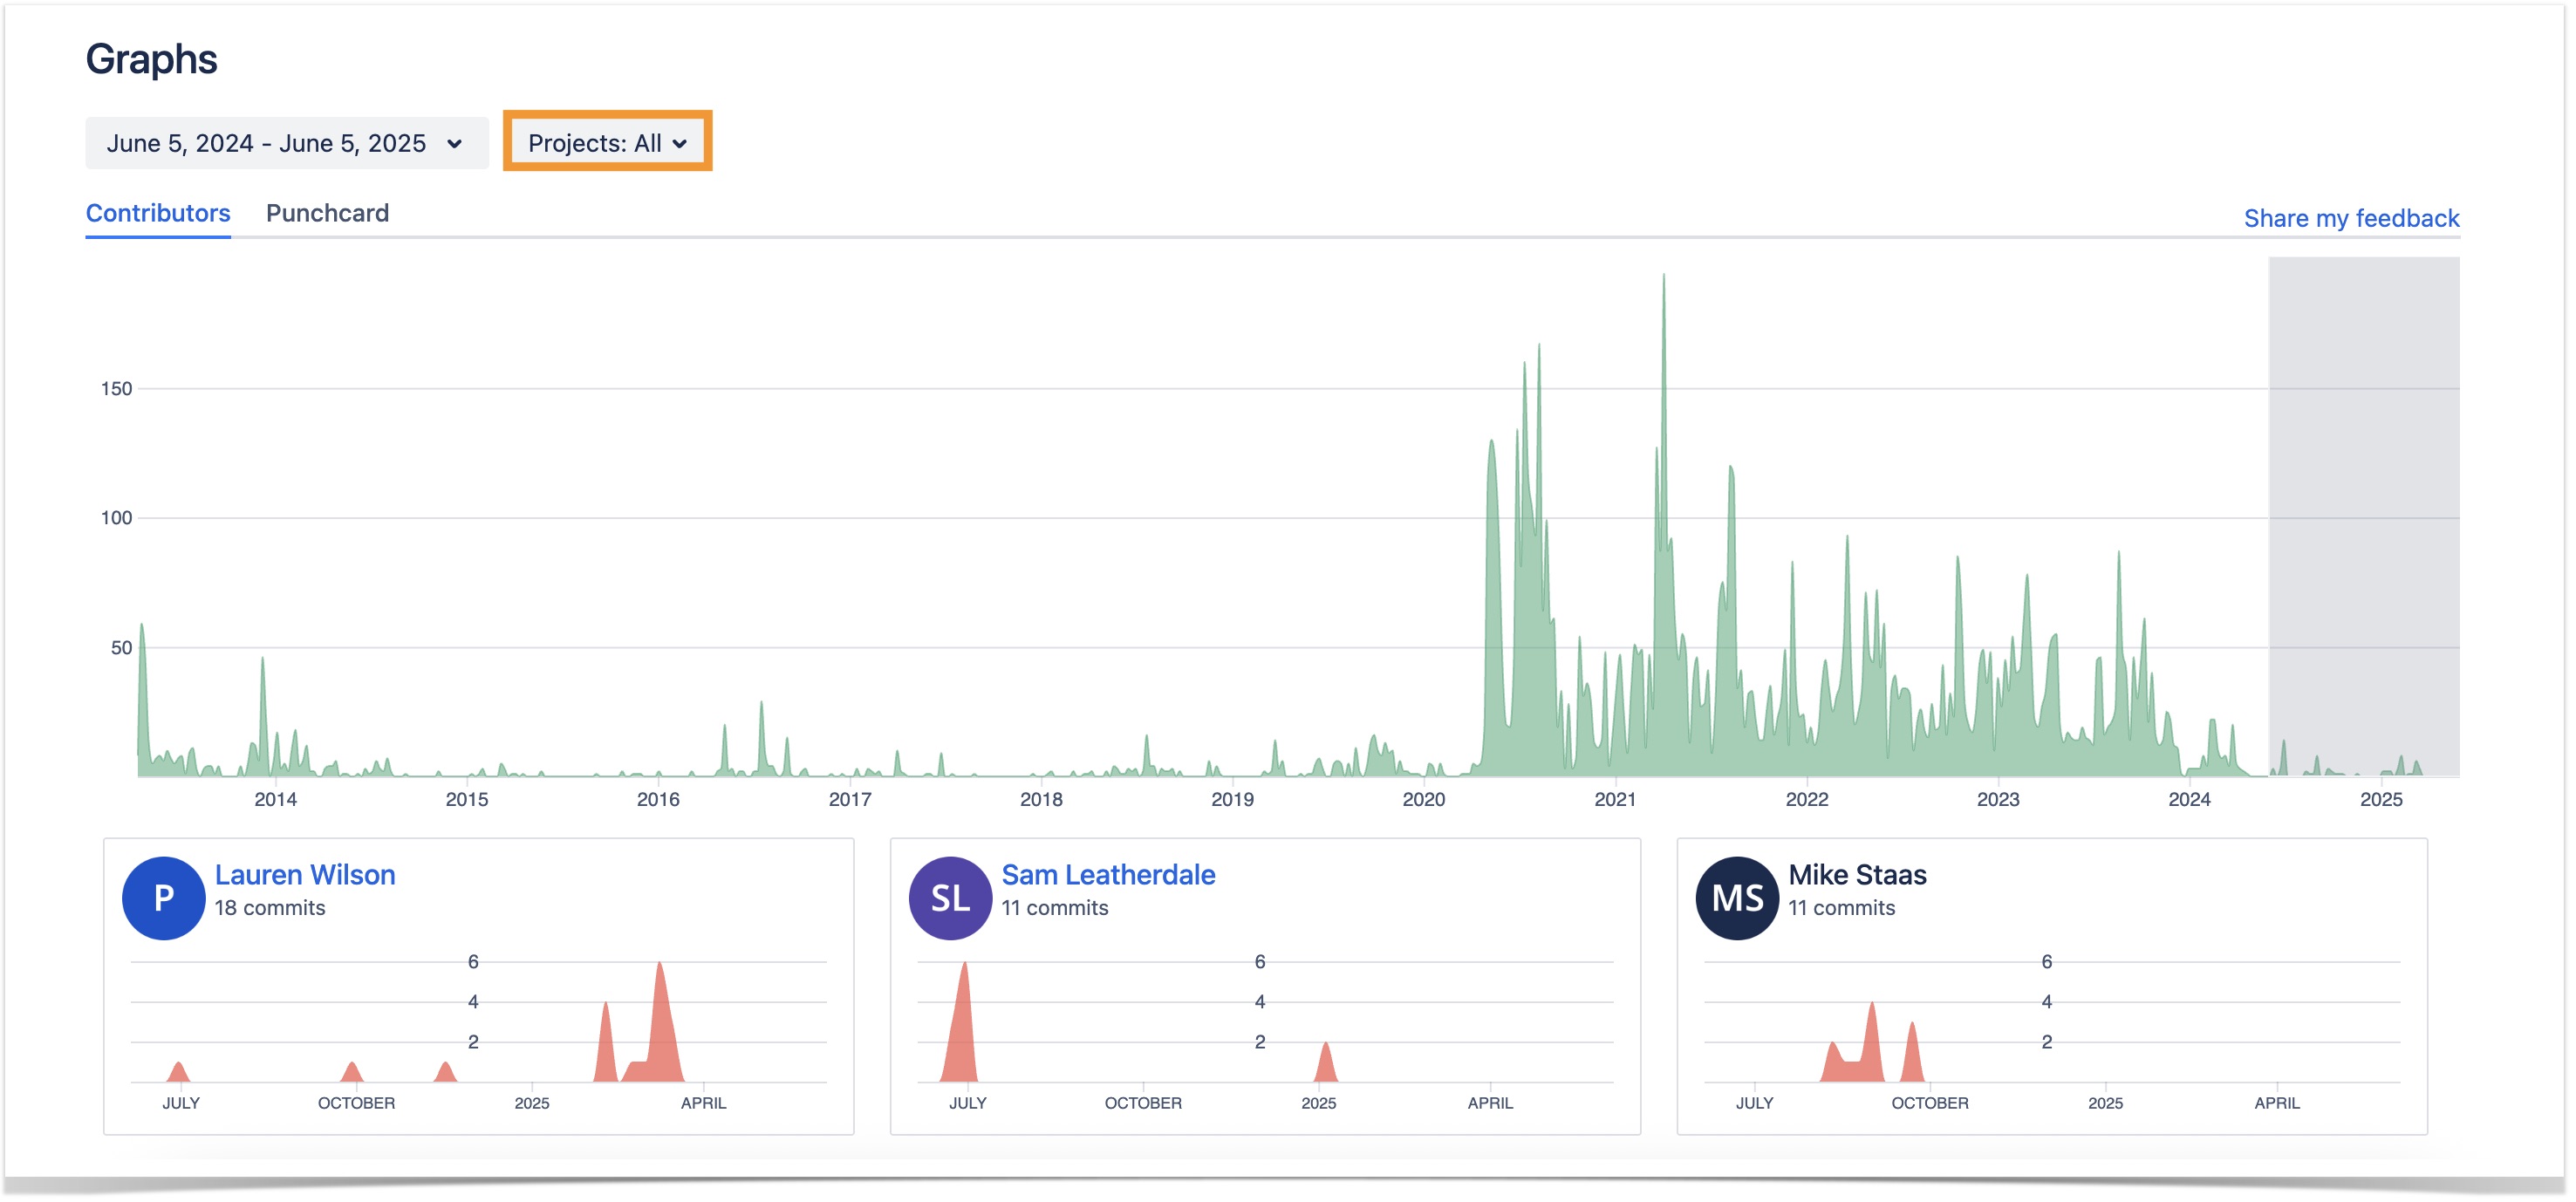
How to view Graphs for projects
To view data for specific projects within your workspace:
Navigate to the Graphs section in the header.
Locate the Projects selector positioned above the graph display area.
Click on the dropdown menu to open the list of available projects.
Select one or more projects from the list.
You can select a single project to focus on its individual data.
Or select multiple projects to compare data across them.
Once selected, the chart will automatically update to reflect the data for the chosen projects.
Cookie Notice
This website uses cookies for analytics, personalization and advertising. By continuing to browse, you agree to our use of cookies. Learn more