Top Committers Report allows you to see the dynamics of commit activity of a contributor over a specified time period and analyze how contributions of different developers vary.
Below on the page, you'll find:
- instructions on how to generate the Top Committers Report.
- a detailed description of all elements.
For easier navigation, use the Table of Contents at the top-right of the page.
How to generate the Top Committers Report
Repository
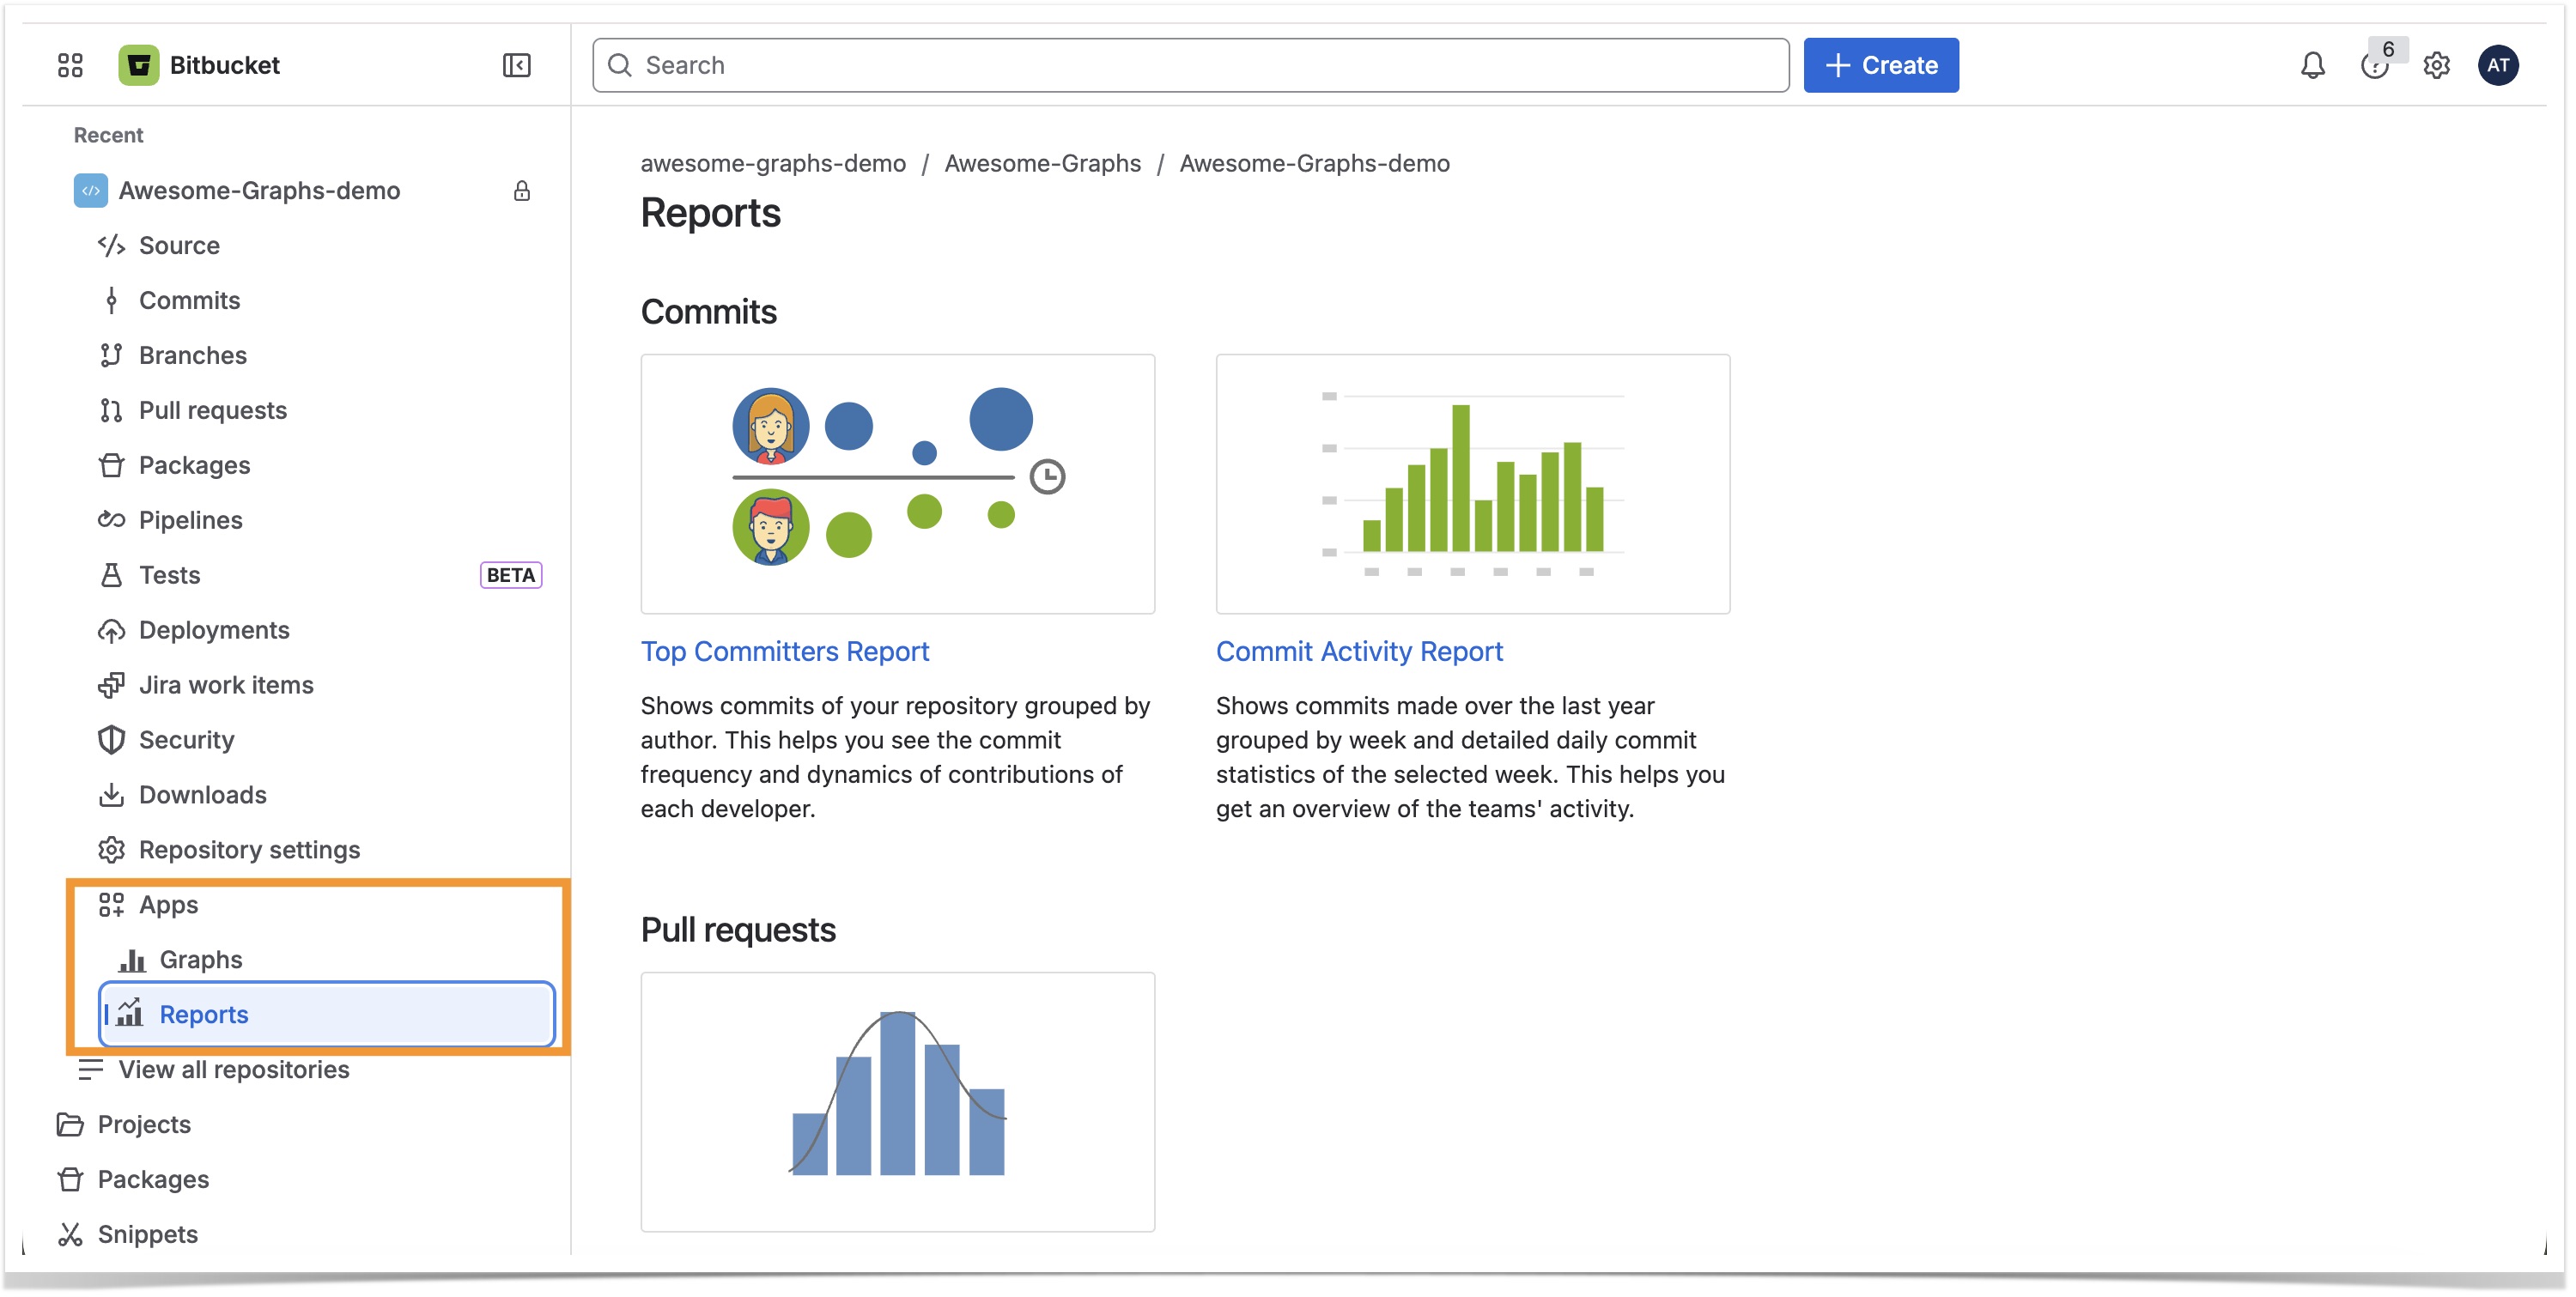
To view Top Committers Report on the repository level:
- Navigate to the repository of your choice.
- Click on the Reports icon in the left-hand sidebar, located under Apps.
- Choose Top Committers Report.
Workspace and Project
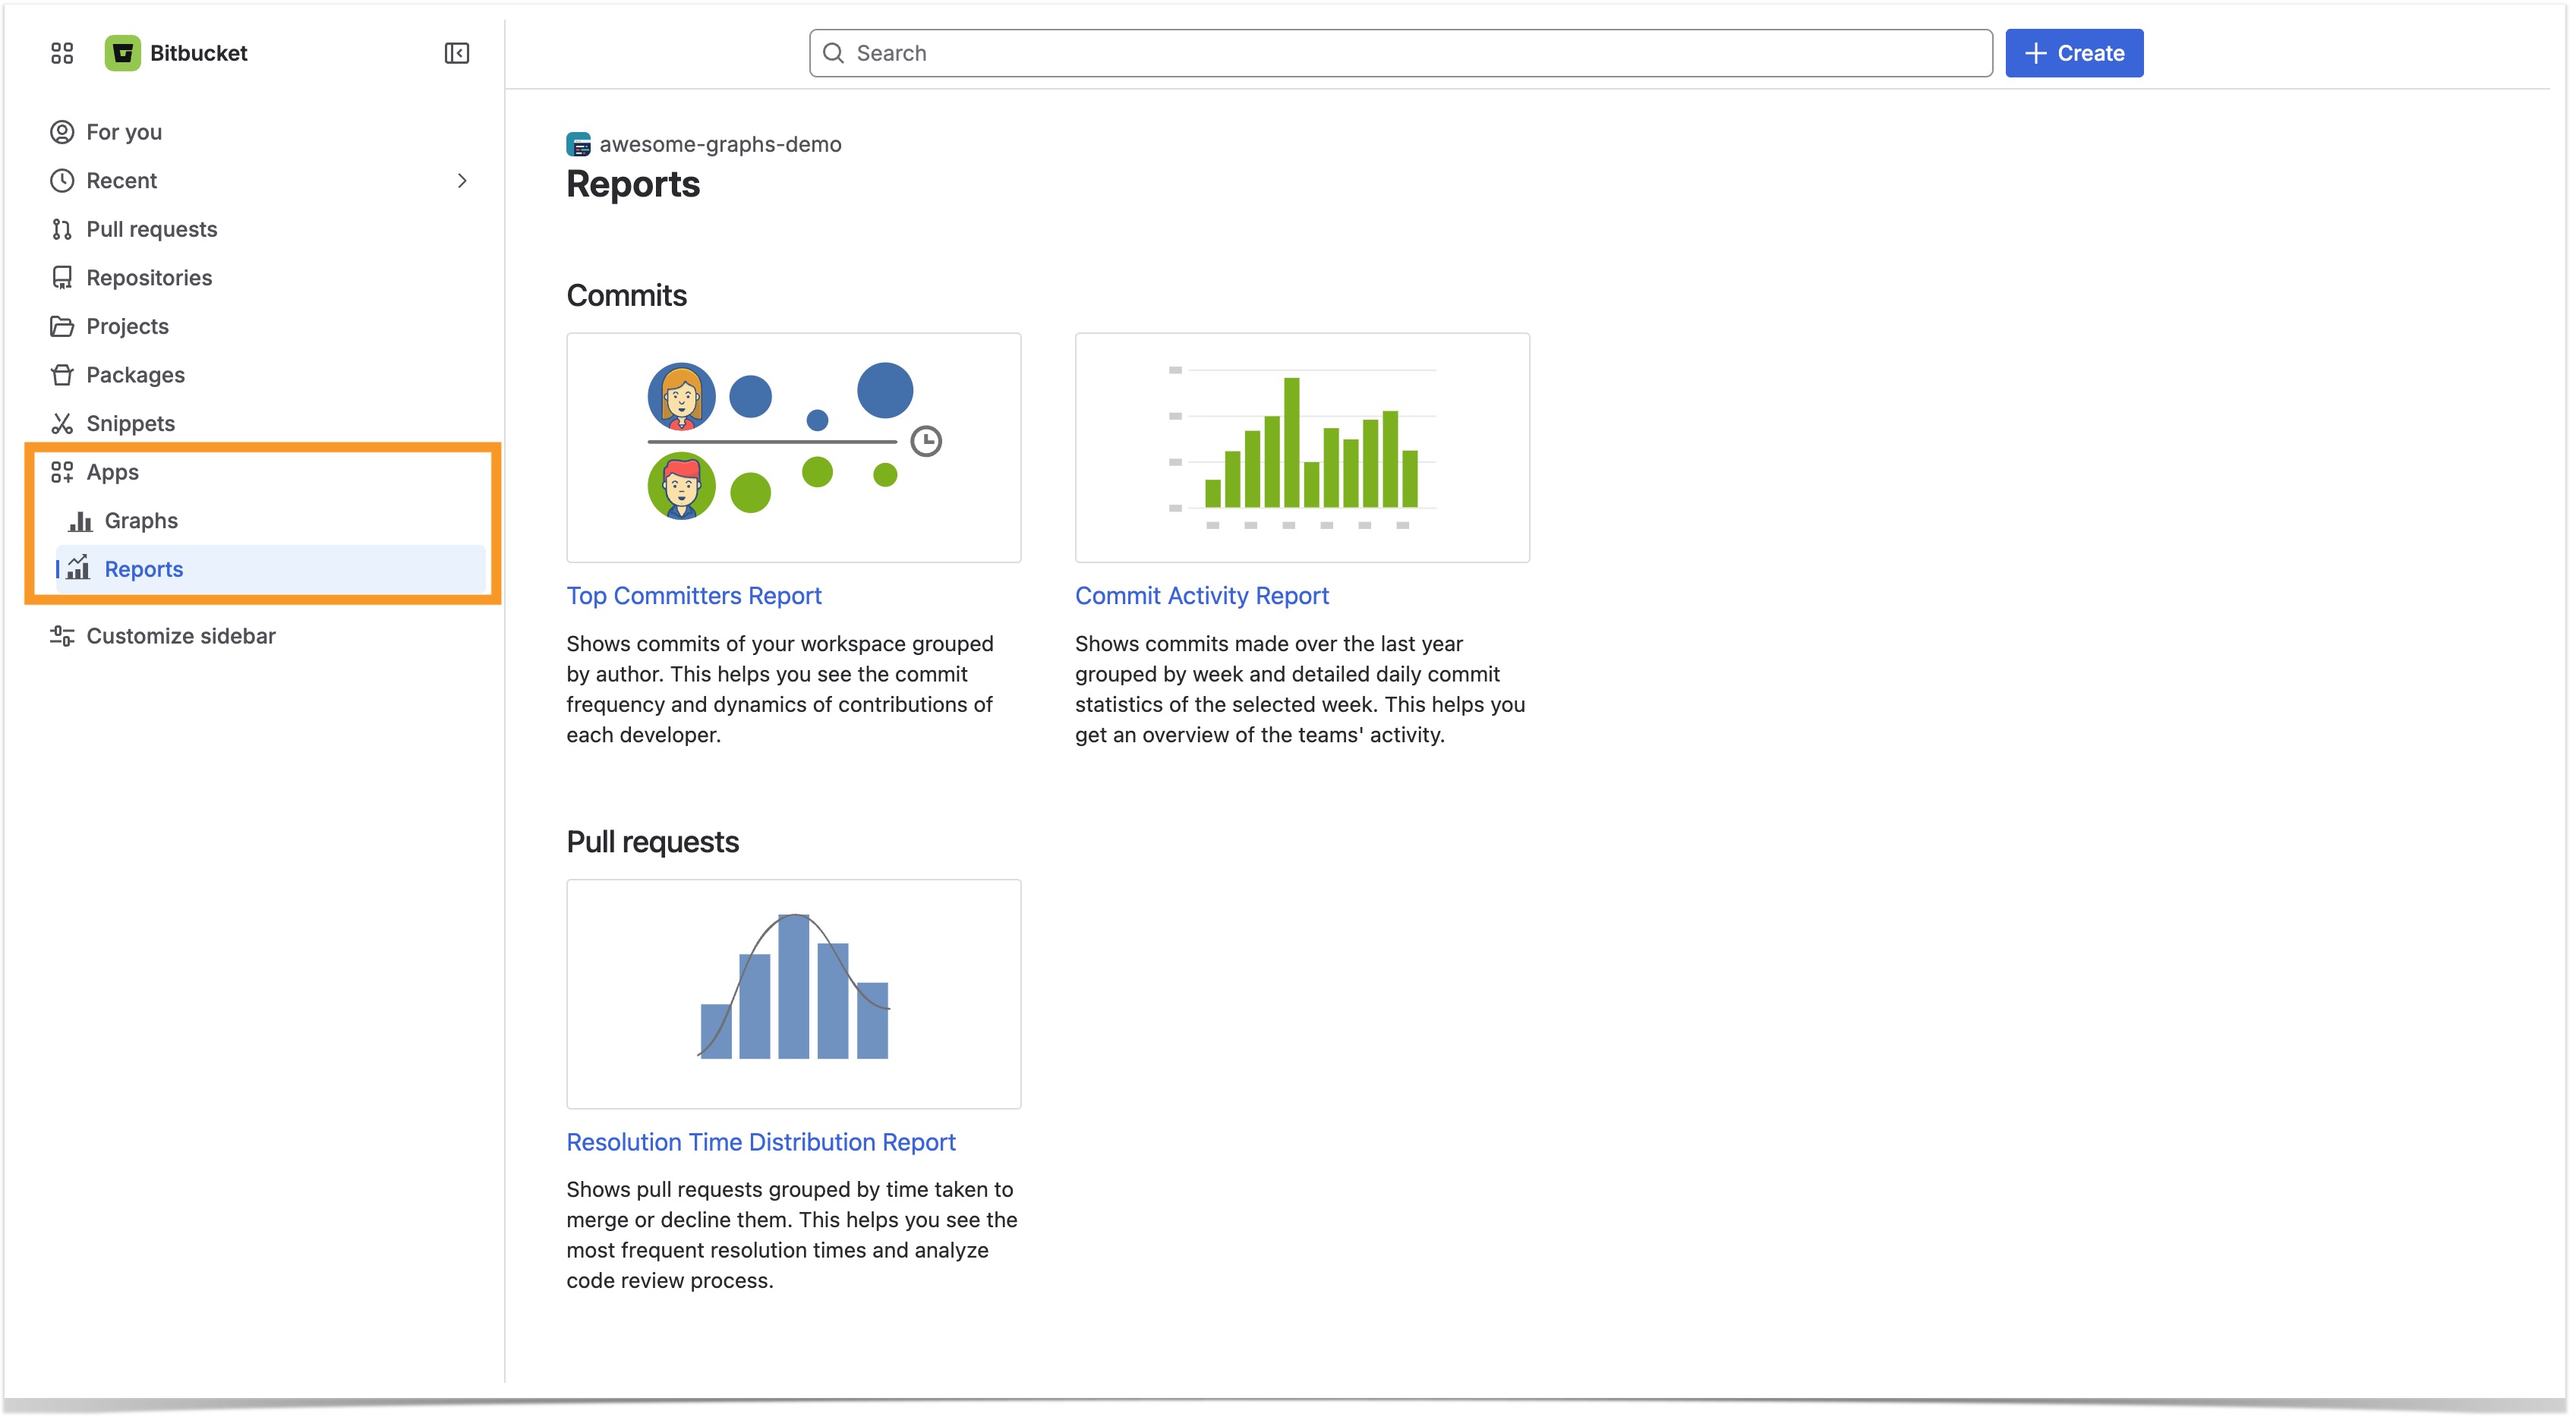
To view Top Committers Report on workspace/project level:
- In the left sidebar, click the Reports icon under Apps.
- Choose Top Committers Report.
To generate reports for specific projects, you need to make your selection on the Reports Configuration page:
Select Top Committers Report.
- In the Projects section on the Configuration page, select one or more projects you want to include in the report.
Click Next.
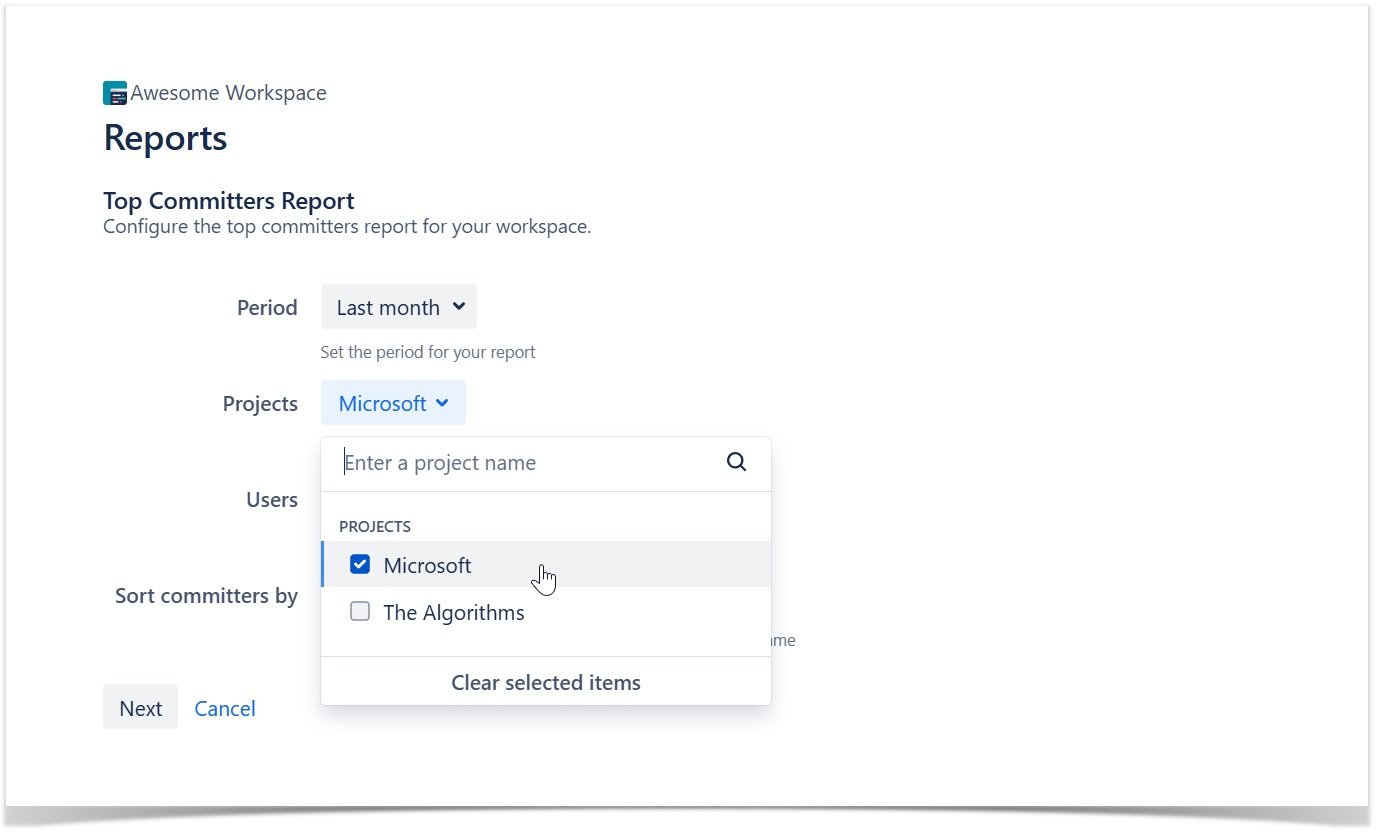
The report will then be generated based on the selected projects, allowing you to focus on the most relevant data for your needs.
Analyze the dynamics of contributions
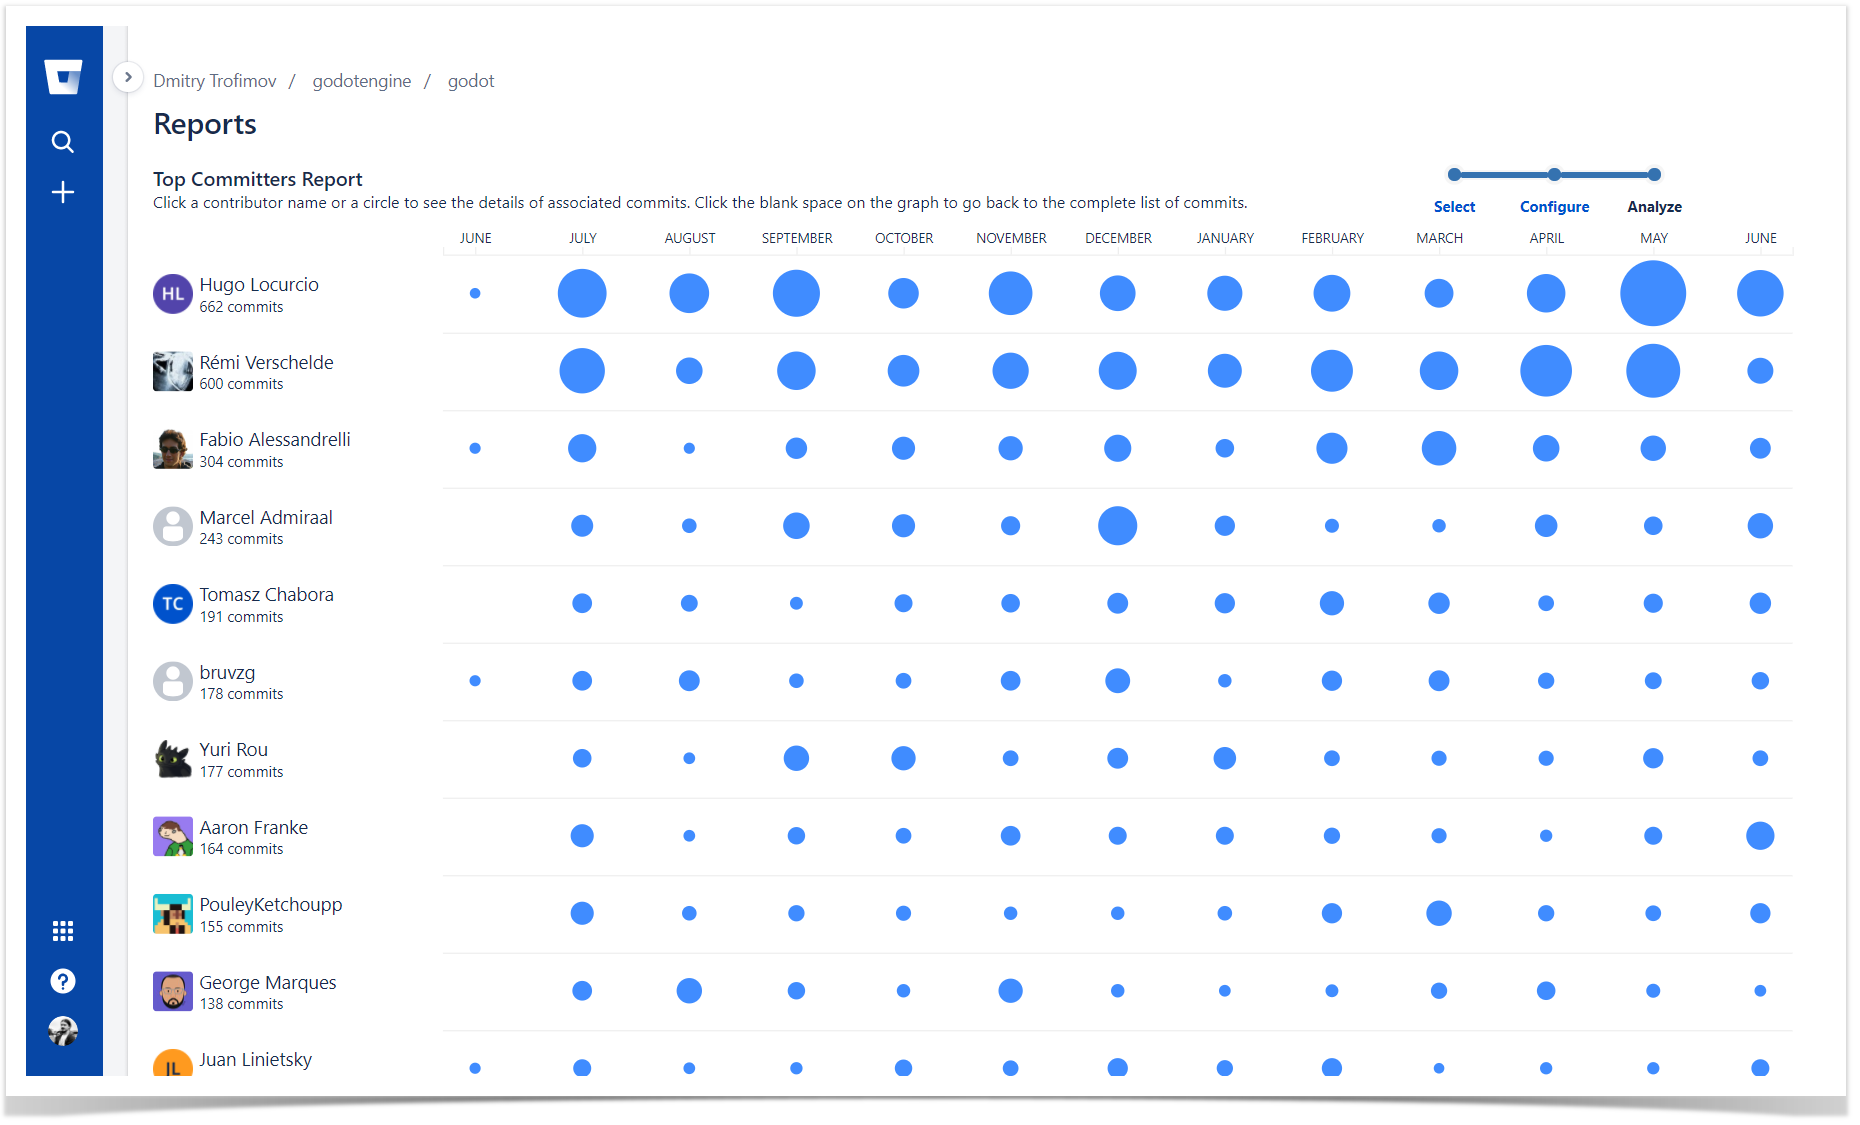
Top Committers Report shows a bubble chart with commit statistics of selected contributors presented in a summarized way. A circle can represent a day, a week, a month, a quarter, or a year depending on the length of a chosen time span.
The bigger a circle is the more commits were made. By taking a look at circles associated with a particular developer you can easily see the dynamics of their commit activity. And if you compare circles of several people you can analyze the contributions each of them made.
Below the graph, there's an Activity stream with commit details.
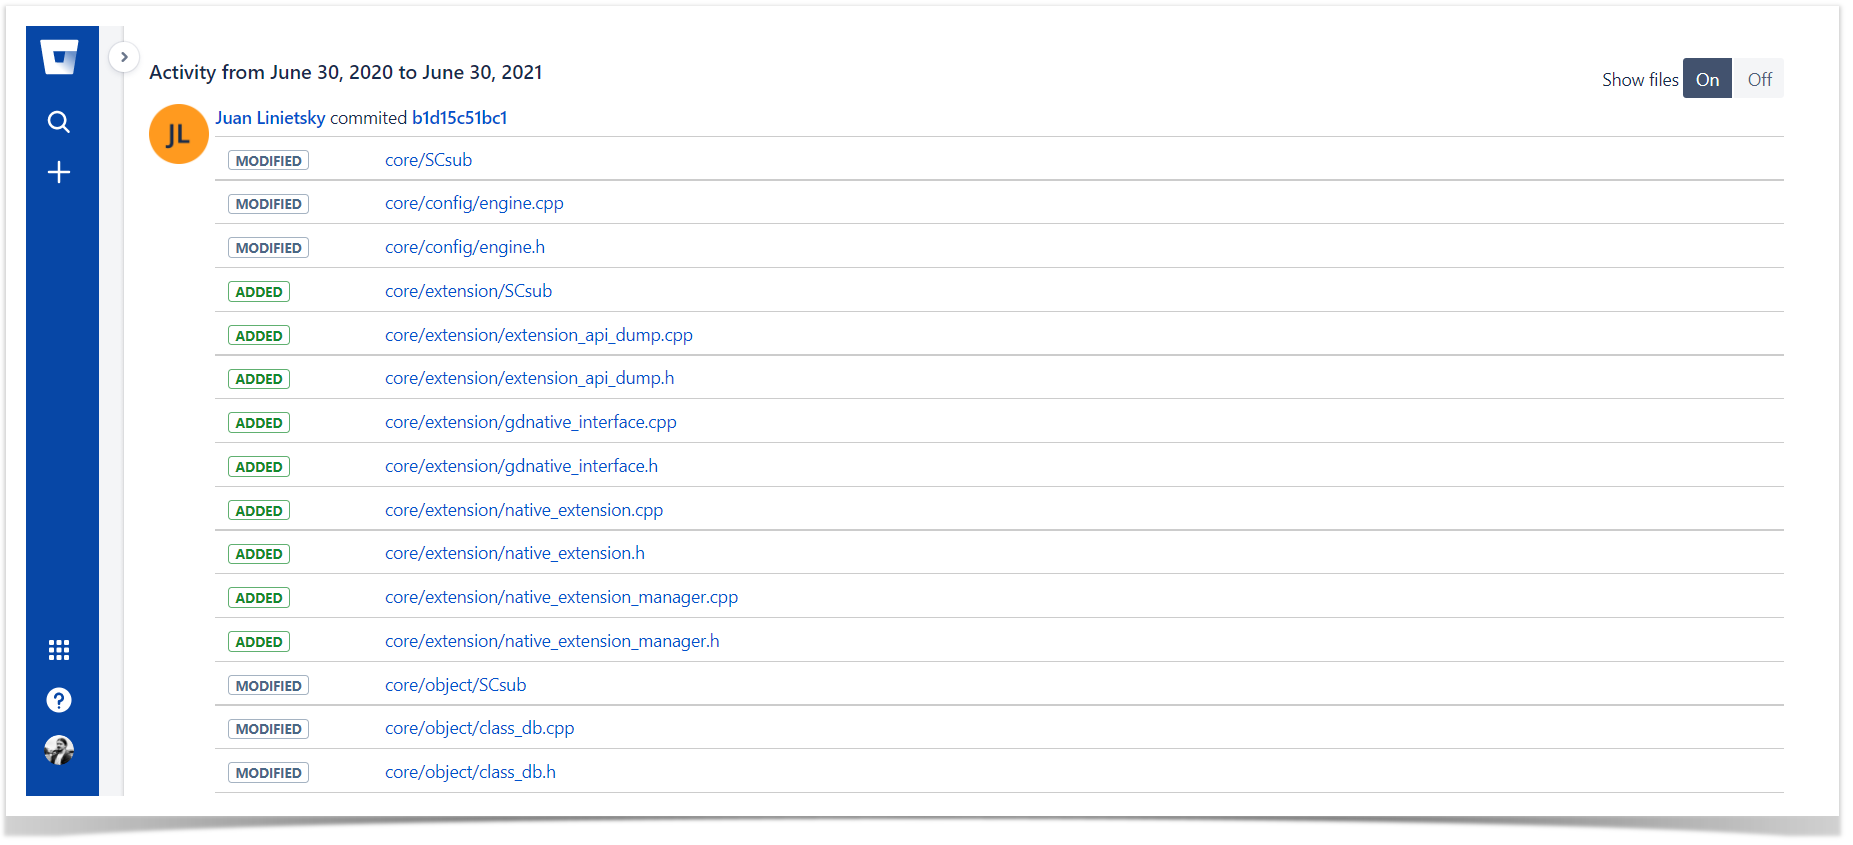
When you hover over a circle, a contributor name, or a time period (above or below the graph), you can see the number of commits associated with that circle, person, or time period. And when you click a circle, a contributor name, or a time period, the Activity stream gets updated and displays the details of those commits.