The Cycle Time Report displays the average time it takes to resolve pull requests, enabling you to evaluate the entire software development process from beginning to end.

By using this report, you can:
- Objectively determine if the development process is becoming faster or slower.
- Examine the phases of the cycle and identify areas that need attention.
- Analyze the correlation of specific metrics with Cycle Time.
- Compare rates within your organization or across the industry.
Below on the page, you'll learn:
- how to view Cycle Time Report for projects and repositories
- how to configure the report
- how to read the report
For easier navigation, use the Table of Contents at the top-right of the page.
How to view Cycle Time Report
Cycle Time Report is available both on the project and repository levels. To view Cycle Time Report:
- Navigate to the project or repository of your choice.
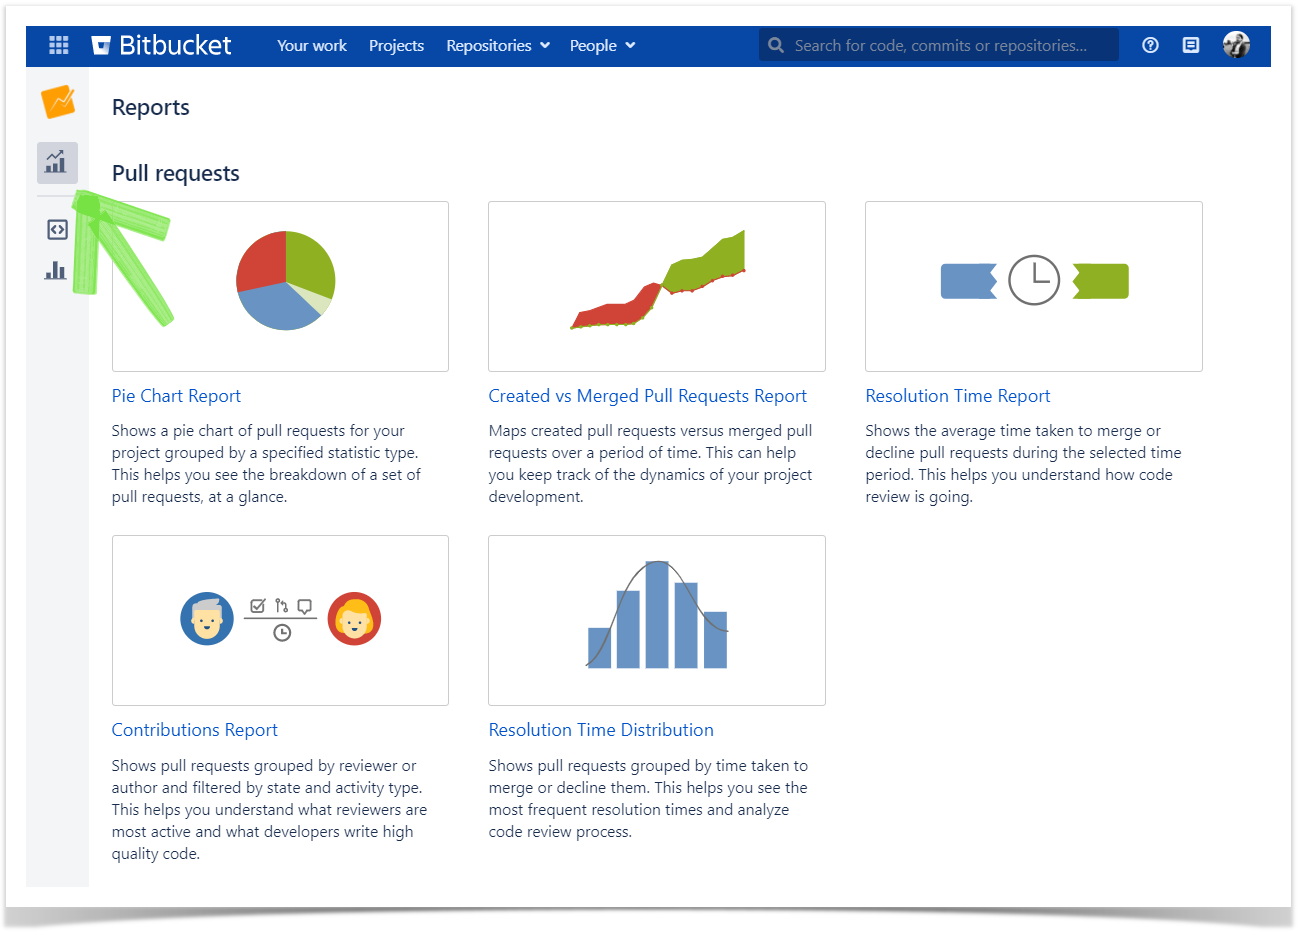
- Click on the Reports icon in the left-hand sidebar.
- Choose Cycle Time Report in the Pull Requests section.

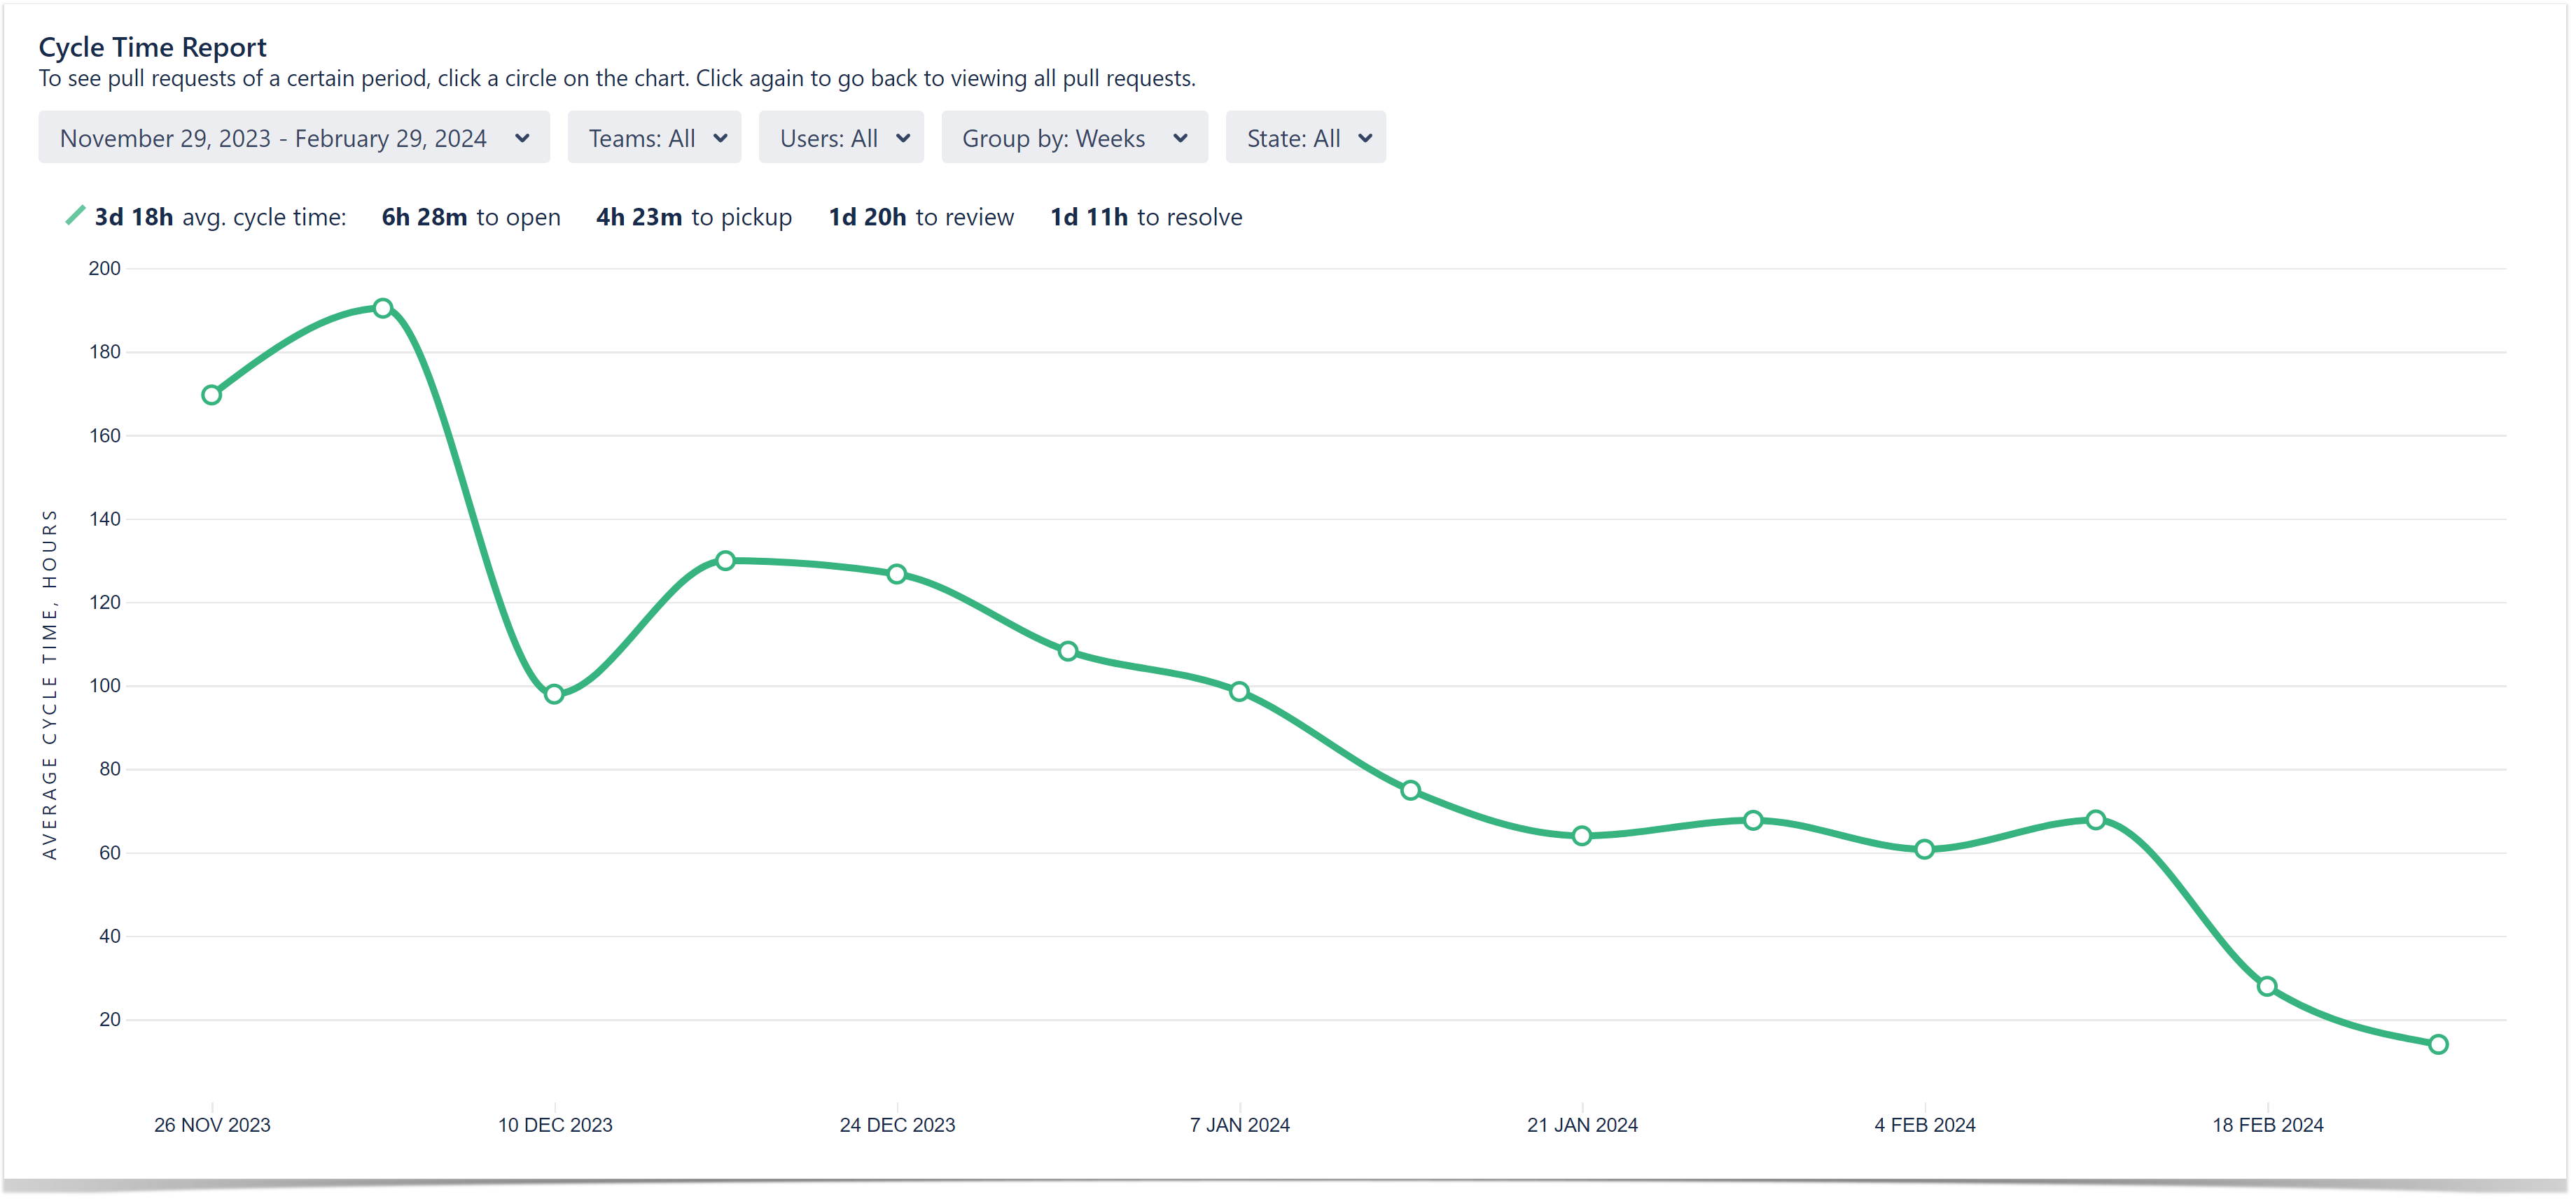
- In the Period dropdown menu, choose the time frame. The report will display all merged and/or declined pull requests opened within that time frame.
- If you want to view the report for a specific team or user, select their name using the Teams and Users dropdown menus, respectively. You can learn more about teams here.
- In the Group by section, choose a unit of time to group the pull requests by.
- Use the State filter to refine the report by including only pull requests in a particular state.

How to read Cycle Time Report
The report is made up of the cycle time line chart and the list of pull requests.
Please note that we define Cycle Time as the time between the developer’s first commit and the time it’s resolved and calculate it this way for merged and declined pull requests.
Cycle time line chart
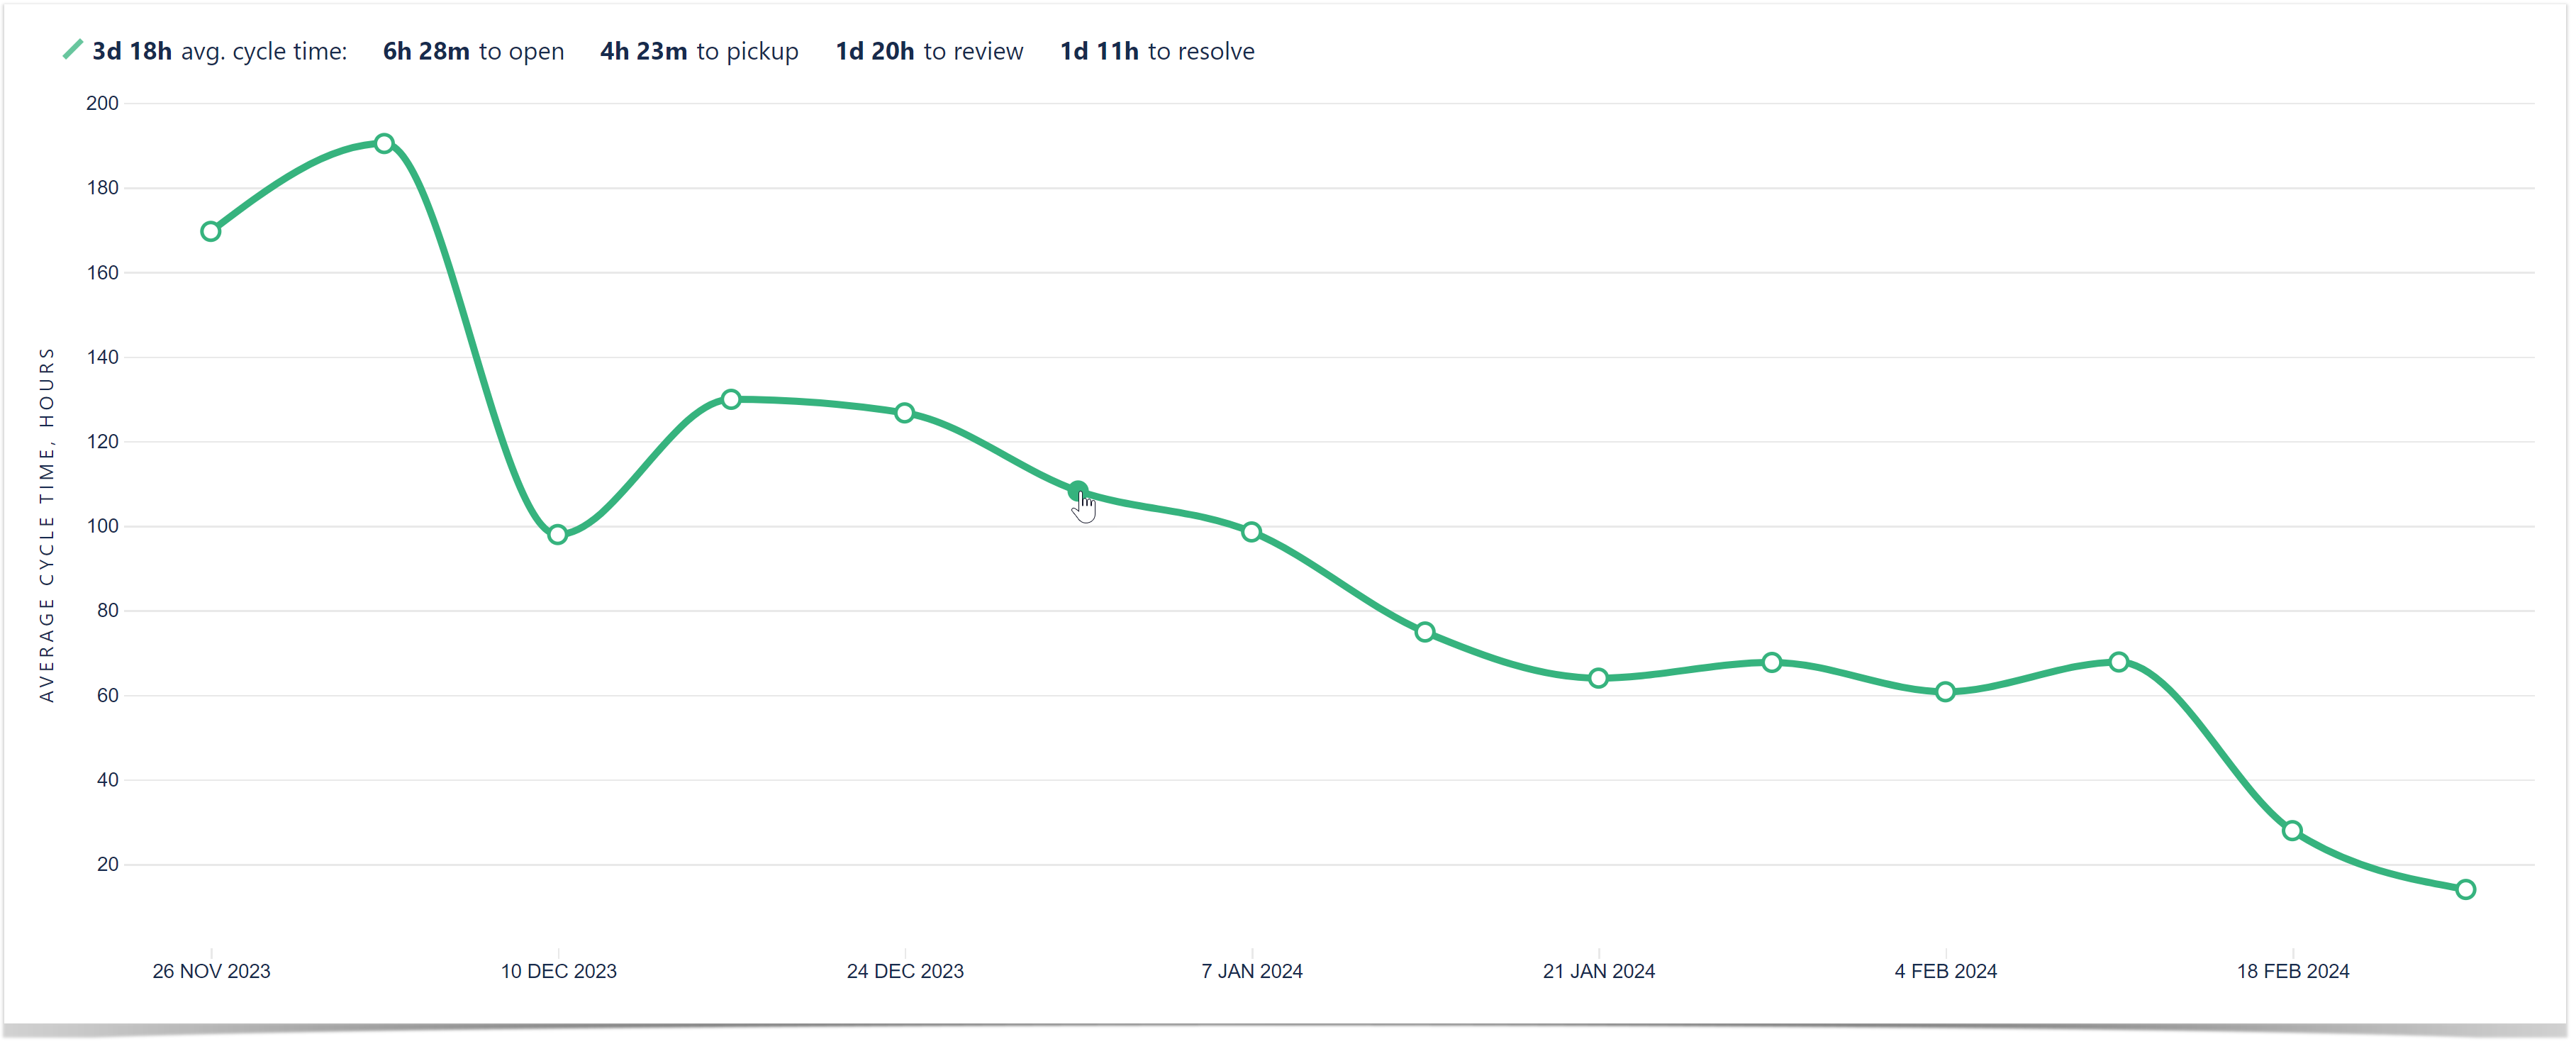
The chart shows how the average cycle time changes over time by connecting data points (units selected in the Group by menu) with a line.

Above the chart, there is a summary panel that displays the average cycle time for the chosen period and breaks down the average time by stages.

The definition of the phases is as follows:
- Time to Open: Time from first commit until a pull request is created
- Pickup Time: Time from when the pull request is created until the review begins (marked by the first submitted non-author comment)
- Review Time: Time from the start of the review until the pull request is approved by all reviewers
- Time to Resolve: Time from the pull request approval until it is merged or declined
Please note that the time a pull request spent in the draft state is included in the corresponding phase time and the overall cycle time.
List of pull requests
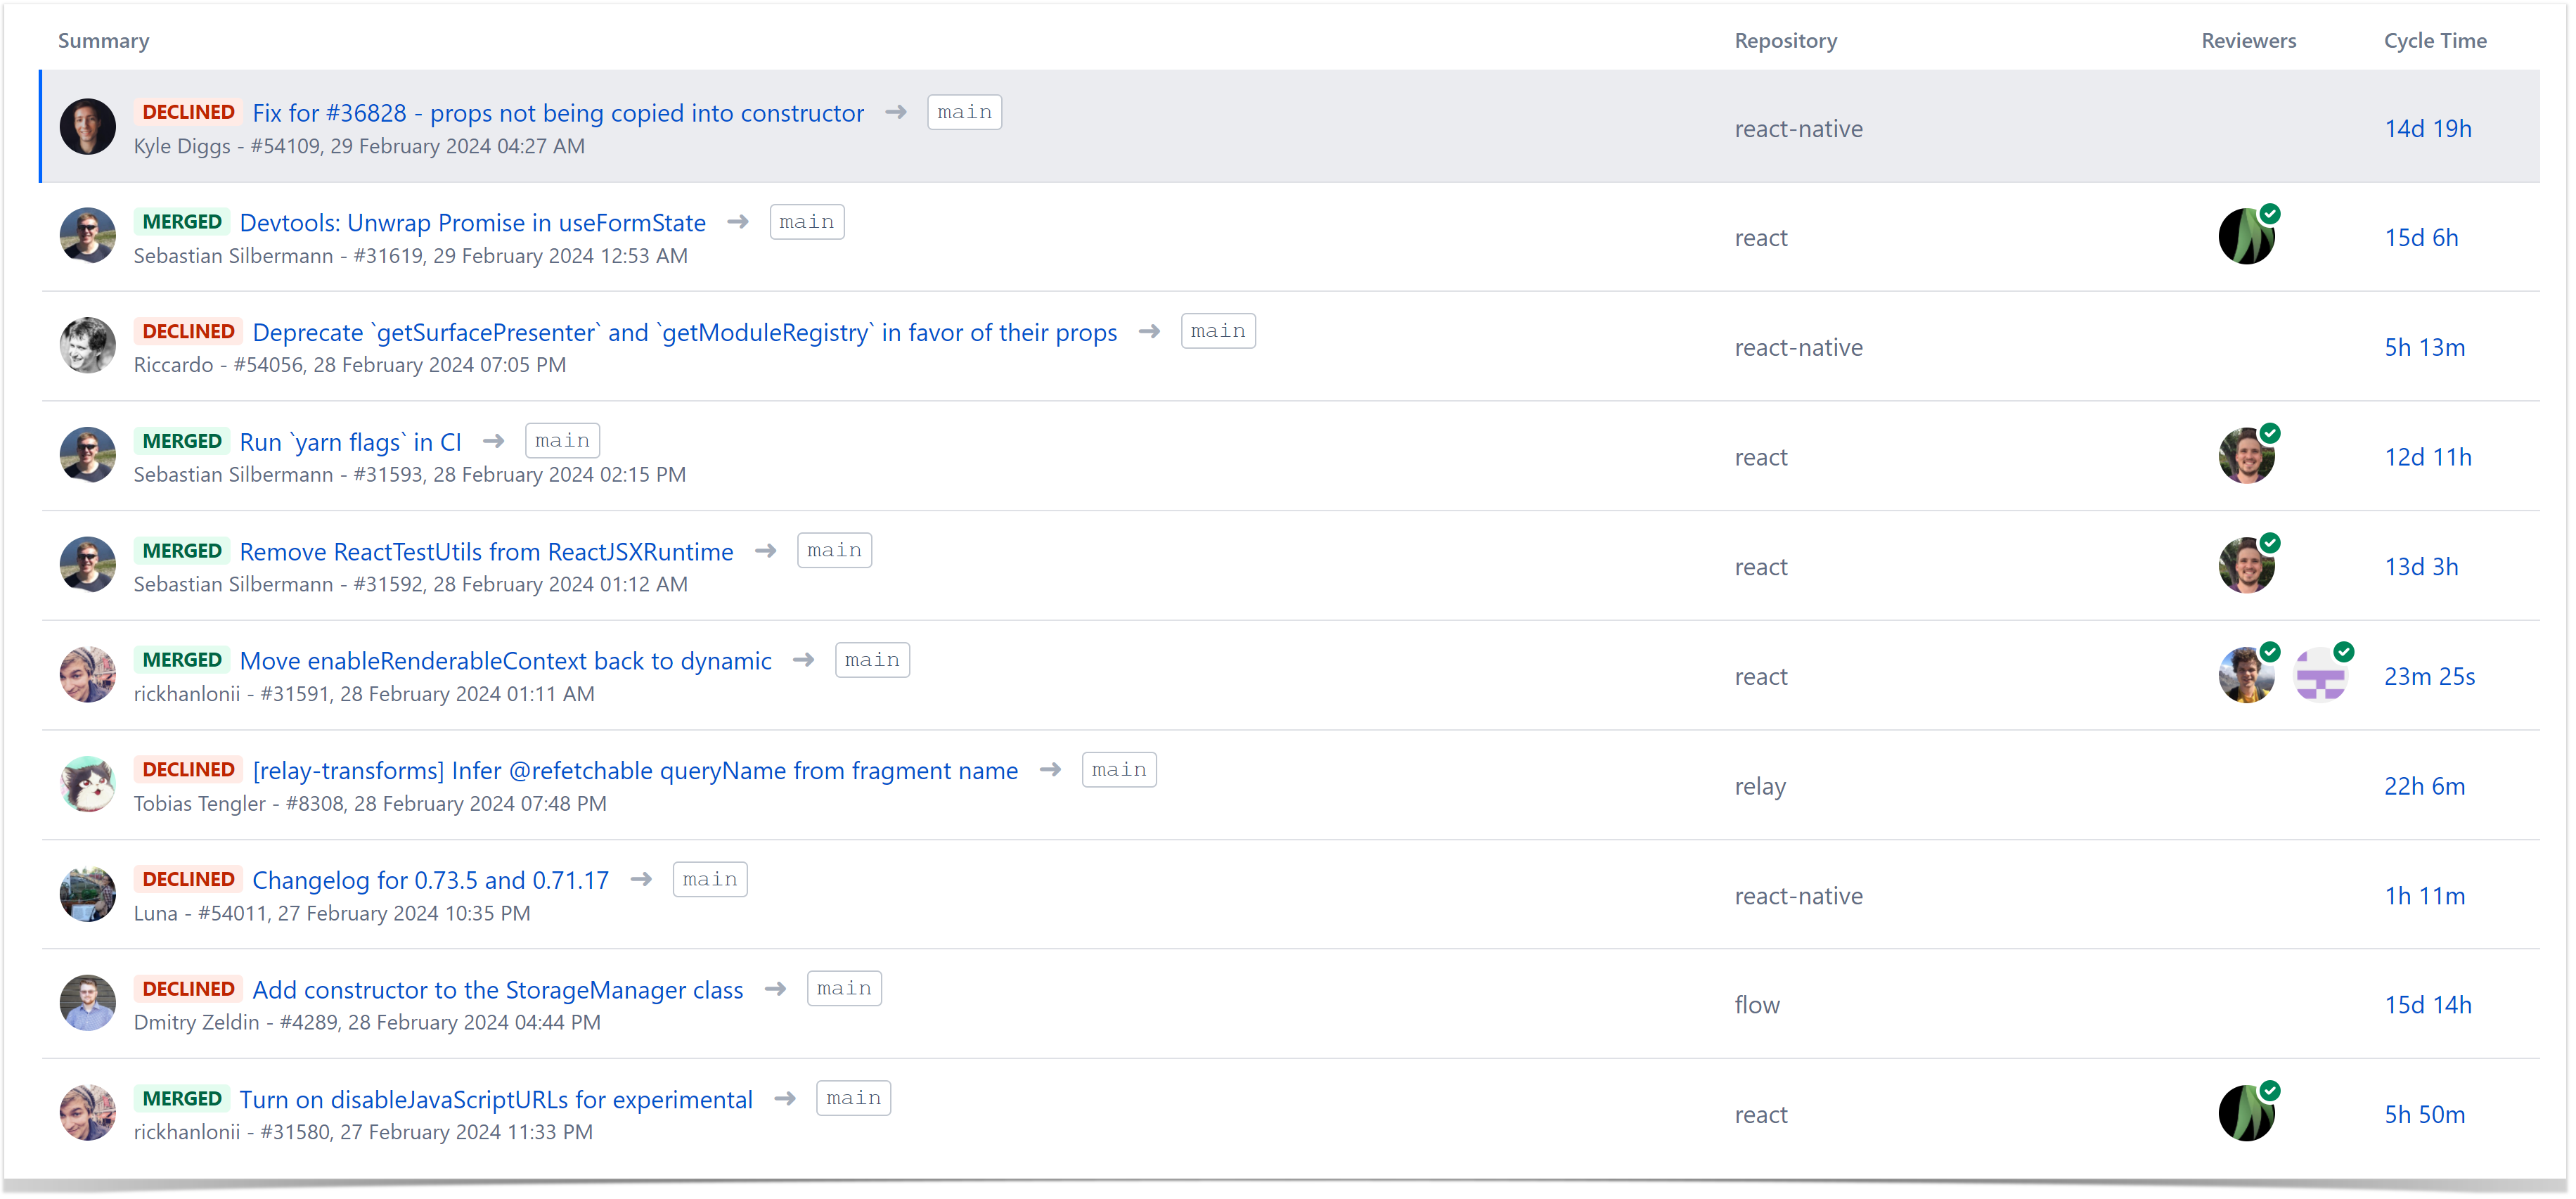
Below the chart, you can see the list of pull requests included in the report with their cycle time. If you select a point on the line in the chart, the list will update to show corresponding pull requests.

Click on a value in the Cycle Time column against a particular pull request to see the breakdown of the cycle time and analyze each phase of the cycle.

If you'd like Awesome Graphs to include other pull requests reports, please, let us know.