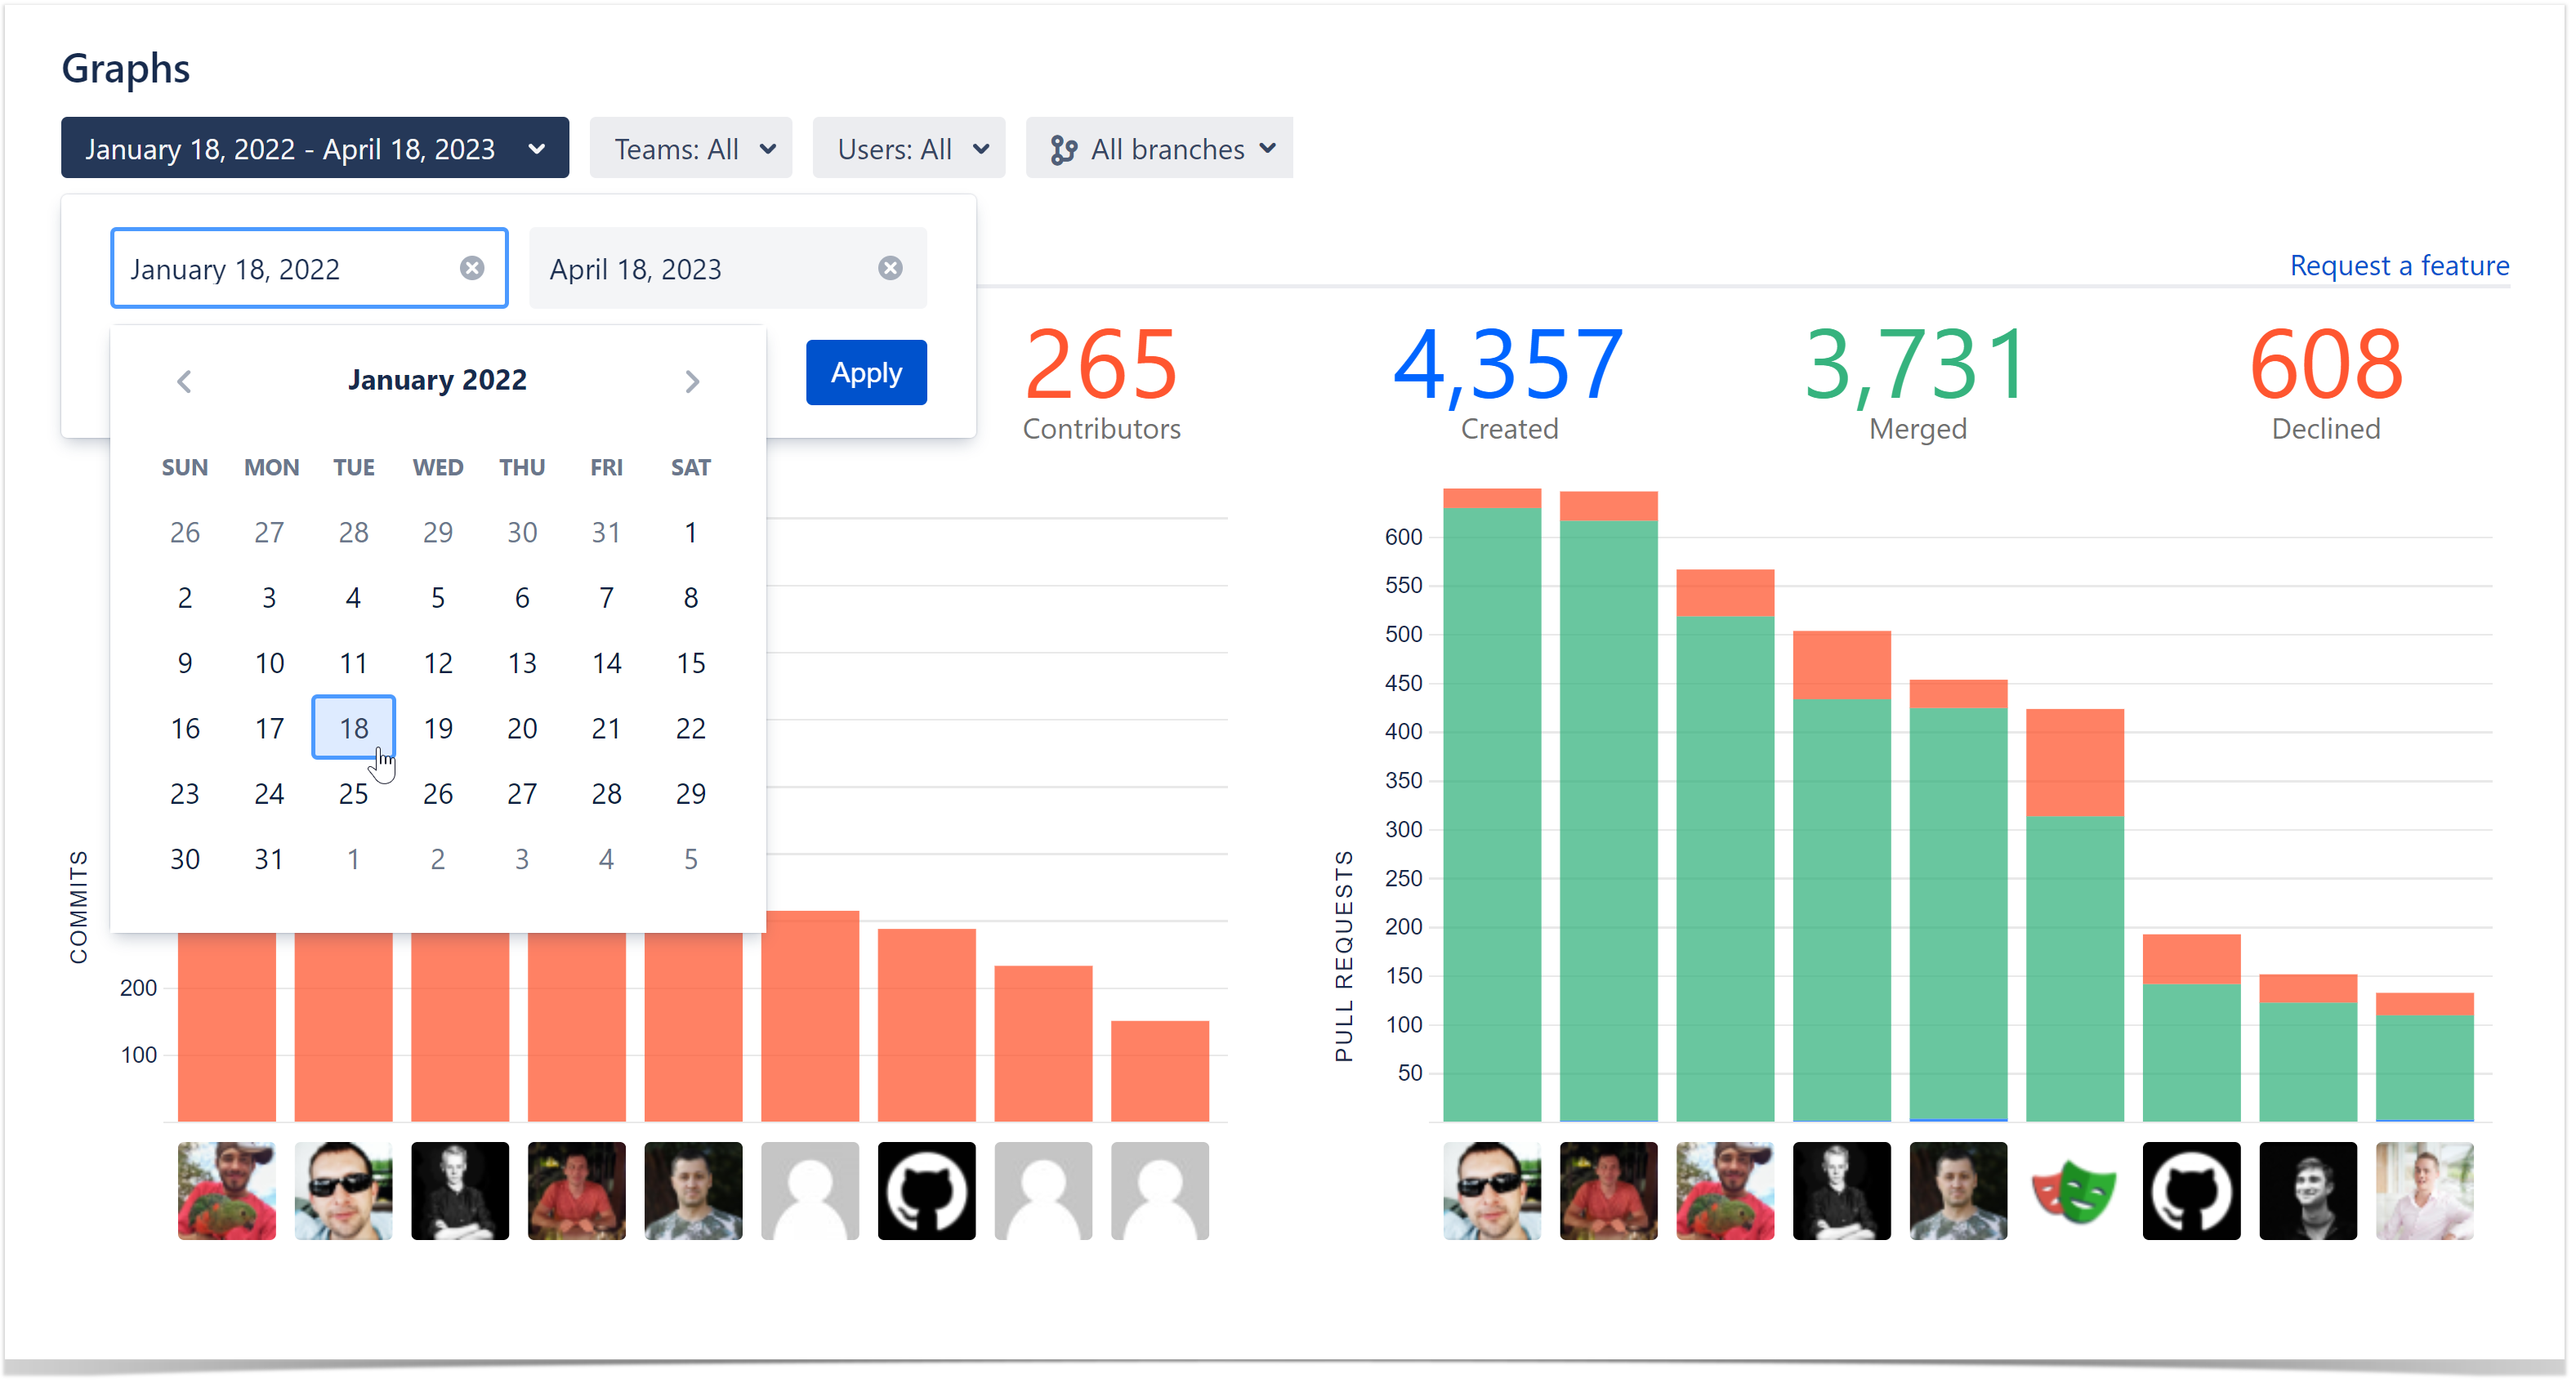
In this version of the app, we've reimagined user experience, interface, and, in particular, the date filtering on the Graphs page to create a universal filtering panel that applies to all Graphs at the same time, allowing you to set the filtering criteria once and analyze the data from different perspectives going from one graph to another. The updated date filter also made it possible to choose a custom period of any length for Graphs where it wasn't available.
To achieve this, we've had to rework and make changes to the UX of some Graphs: