Page tree


Managing Dynamic Charts from Table Data

The Table Filter and Charts for Confluence app allows you to visualize your table data and create dynamic charts on the fly while viewing Confluence pages. You can select the column containing labels and set one or multiple columns containing number values used for chart creation. Additionally, you can select the appropriate chart or graph type ( pie, donut, bubble pie, column, bar, Gantt, line, area, time line, time area and other). Optionally, you can configure your chart according to your use case.

Starting from version 3.0.0 Table Filter add-on allows you to generate charts based on values from your data tables. The add-on supports the following types of charts:

Chart Parameters

These parameters determine the procedure of chart generation on Confluence page.

ParameterDefaultCompatible withDescription
Labels ColumnNone
  • Pie
  • Donut
  • 3D Donut
  • Column (Stacked)
  • Bar (Stacked)
  • Gantt

The column containing labels for data values.

Values columnNone
  • Pie
  • Donut
  • 3D Donut
  • Column (Stacked)
  • Bar (Stacked)
  • Bubble Pie
  • Time Line
  • Time Area
  • Stacked Time Area
  • Gantt

The column containing numerical values for chart generation.

X-axis value columnNone
  • Line
  • Area
  • Stacked Area
  • Bubble Pie
The column containing numerical values for chart generation.
Y-axis value columnNone
  • Line
  • Area
  • Stacked Area
  • Bubble Pie
The column or columns containing numerical values for chart generation.
Dates columnNone
  • Time Line
  • Time Area
  • Stacked Time Area
You can select the column with dates for chart generation.
Date Formatyy-mm-dd
  • Time Line
  • Time Area
  • Stacked Time Area
  • Gantt
  • Bubble Pie
You can specify the date format used in the column with dates.
TypePieGlobalYou can select the appropriate chart type.
3DDisabled
  • Pie
  • Donut
  • Column (Stacked)
  • Bar (Stacked)
You can select the display of the chart in 3D view.
Decimal SeparatorPointGlobalYou can select the decimal separator (either point or comma).
Height

None

(dependable on screen area)

GlobalYou can define the height of the generated chart.
Width

None

(dependable on screen area)

GlobalYou can define the width of the generated chart.
Hide the source tableDisabledGlobalYou can hide the table with data and enable display of the chart only.
Hide chart controlsDisabledGlobalYou can hide the chart controls when you need just to display the chart without a necessity to update its view.
Show gridEnabled
  • Line
  • Area
  • Time Line
  • Time Area
  • Stacked Time Area
  • Bubble Pie
You can enabled display of the grid on the generated chart.
Chart TitleDisabledGlobalYou can specify the title of the chart.
Show data labelsPercentage
  • Pie
  • Donut
  • Column
  • Bar
  • Stacked Column
  • Stacked Bar
  • Bubble Pie
You can specify the way to show data labels (none, value, percentage, value (percentage), percentage (value)).
Align chartEnabledCenterYou can define the appropriate alignment for the chart.
X-axis labelDisabledGlobalYou can specify the label for X axis of the chart.
Y-axis labelDisabledGlobalYou can specify the label for Y axis of the chart.
Minimal ValueDisabled
  • Column
  • Bar
  • Stacked Column
  • Stacked Bar
  • Gantt
  • Bubble Pie
You can specify the minimal value for showing only data values greater than the specified minimal value.
Maximal ValueDisabled
  • Column
  • Bar
  • Stacked Column
  • Stacked Bar
  • Gantt
  • Bubble Pie
You can specify the maximal value for showing only data values not greater than the specified maximal value.
Scale StepDisabled
  • Column
  • Bar
  • Stacked Column
  • Stacked Bar
  • Gantt
  • Bubble Pie
You can specify the required scale step for showing the chart.

Minimal X Value


  • Line
  • Area
  • Stacked Area
  • Time Line
  • Time Area
  • Stacked Time Area
  • Bubble Pie
You can specify the minimal value for X axis for showing only data values greater than the specified minimal value.
Maximal X Value 
  • Line
  • Area
  • Stacked Area
  • Time Line
  • Time Area
  • Stacked Time Area
  • Bubble Pie
You can specify the maximal value for X axis for showing only data values not greater than the specified maximal value.
Minimal Y Value 
  • Line
  • Area
  • Stacked Area
  • Time Line
  • Time Area
  • Stacked Time Area
You can specify the minimal value for Y axis for showing only data values greater than the specified minimal value.
Maximal Y Value 
  • Line
  • Area
  • Stacked Area
  • Time Line
  • Time Area
  • Stacked Time Area
You can specify the maximal value for Y axis for showing only data values not greater than the specified maximal value.
Scale X Step
  • Line
  • Area
  • Stacked Area
  • Time Line
  • Time Area
  • Stacked Time Area
  • Bubble Pie

You can specify the required scale step of X axis for showing the chart.

For Time Line and Time Area charts you can specify the appropriate number of days (Xd), months (Xm) or years (Xy) where the 'X' is the digit, as follows:

  • 10d = 10 days as a scale step
  • 1m = 1 month as a scale step
  • 2y = 2 years as a scale step
Scale Y Step 
  • Line
  • Area
  • Stacked Area
  • Time Line
  • Time Area
  • Stacked Time Area
You can specify the required scale step of Y axis for showing the chart.
Logarithmic scale YDisabled
  • Line
  • Area
  • Stacked Area
You can enable this option for very small or very large numeric values that cannot be properly aligned on the standard arithmetic scale.
Logarithmic scale XDisabled
  • Line
  • Area
  • Stacked Area
You can enable this option for very small or very large numeric values that cannot be properly aligned on the standard arithmetic scale.
Select colors
GlobalYou can select the appropriate colors for charts and graphs instead of using the automatically assigned colors.
Line settingsSolid 1.5 px
  • Line
  • Time Line
You can select the line type (solid, dash, dot) and set its width for each line in your charts.
Logarithmic ScaleDisabled
  • Column (Stacked)
  • Bar (Stacked)
  • Time Line
  • Time Area
  • Stacked Time Area
You can enable this option for very small or very large numeric values that cannot be properly aligned on the standard arithmetic scale.
Interpolation
  • Linear
  • Step
  • Natural cubic
  • Monotone X cubic
  • Monotone Y cubic
  • Cubic Catmull-Rom
  • Cubic cardinal
  • Cubic basis
  • Straightened cubic basis
  • Line
  • Area
  • Stacked Area
  • Time Line
  • Time Area
  • Stacked Time Area
You can select the interpolation method for each line in your charts.
Table Data OrientationVerticalGlobalYou can define the appropriate orientation of values in your data table.
Show inner labelsEnabled
  • Pie
  • Bar
  • Column
  • Stacked Column
  • Stacked Bar
You can enable or disable display of data values (including percents) on the charts.
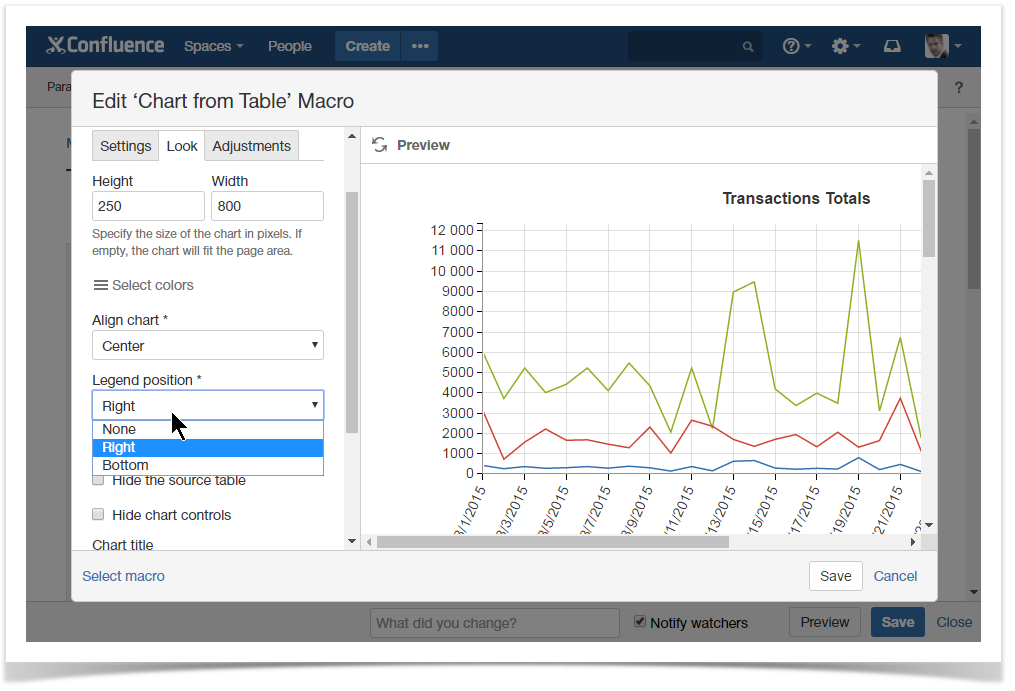
Legend positionRight
  • Bar
  • Column
  • Stacked Column
  • Stacked Bar
You can regulate the position of showing the legend for a specific chart. You can also hide the legend or show it below the chart.
Show trendlineDisabled
  • Line
  • Area
  • Stacked Area
  • Time Line
  • Time Area
  • Stacked Time Area
  • Column
  • Stacked Column
  • Bar
  • Stacked Bar
You can enable display of the trend line for each label of your chart.
Days in week5GlobalYou can enter the number of business days in a week.
Hours in day8GlobalYou can enter the number of working hours in one business day.
Output formatw d h mGlobalYou can select the appropriate output format for worklog values.


Inserting Chart from Table macro

There exist three ways to insert the Chart from Table macro on the page.

Macro InsertionInstructionsSupported Data

Inserting the macro in the page view mode

You can disable the inline macro insertion on a global or individual basis.

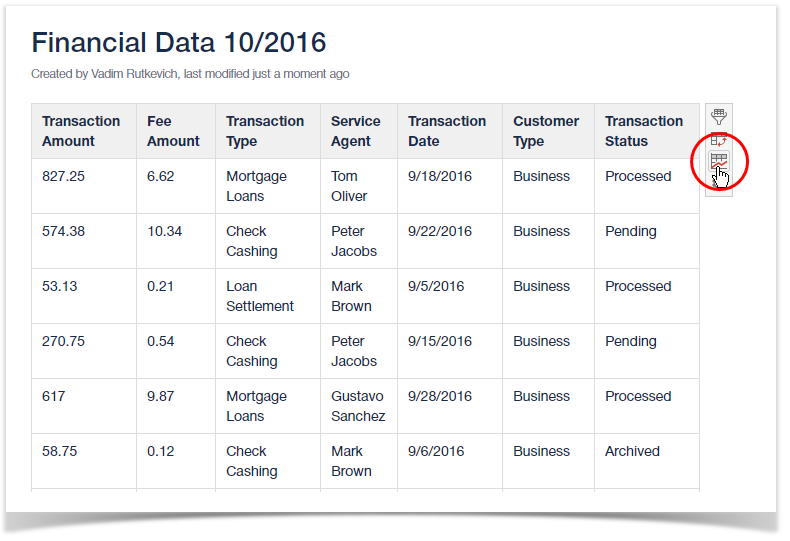
  1. Open a page with a table.
  2. Hove over the table.
  3. Click the Create a chart from data series icon on the panel that appears to the right side of the table.

This option is available in Confluence Server only.

  1. Manually created and copied tables
  2. Macros outputting table data
Inserting the macro through the action icon on the editor pane
  1. Switch Confluence page to the edit mode.
  2. Position the mouse pointer within the table.
  3. On the editor pane, click the Create a chart from table icon.

This option is available in Confluence Server only.

  1.  Manually created and copied tables
Manual entry of the {Chart from Table} query on the page
  1. Switch Confluence page to the edit mode.
  2. Position the mouse pointer in the appropriate place on the page.
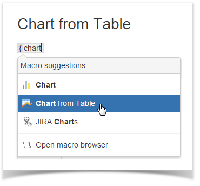
  3. Start entering {Chart from Table}.
  4. From the prompted list of macro choices, select Chart from Table.
  1. Manually created and copied tables
  2. Macros outputting table data
Selection of the Chart from Table macro in the Select Macro form
  1. Switch Confluence page to the edit mode.
  2. Position the mouse pointer in the appropriate place on the page.
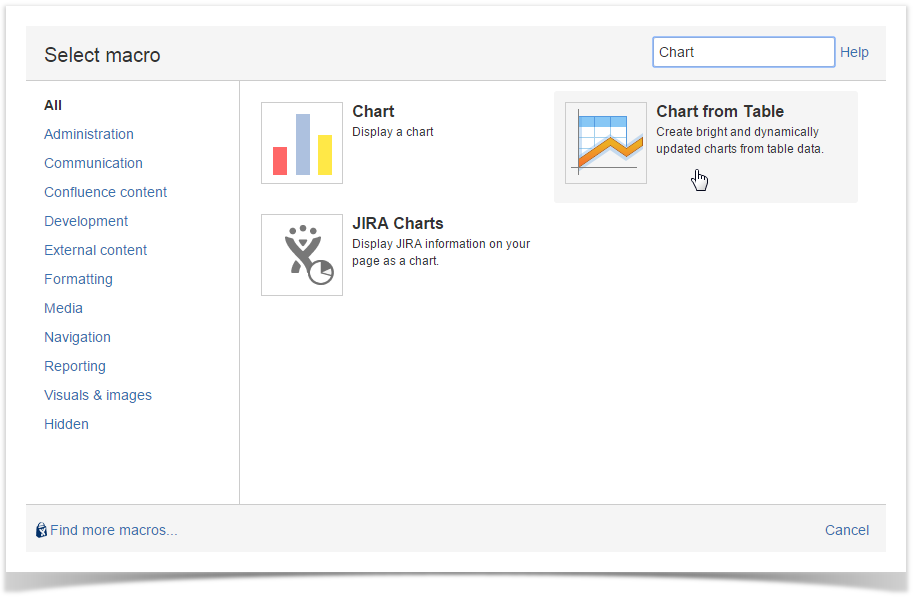
  3. On the editor pane, click Insert.
  4. In the Select Macro form, locate the Chart from Table macro and insert it on the page.
  5. Place the table within the macro.
  1. Manually created and copied tables
  2. Macros outputting table data


Selecting the chart type and data series

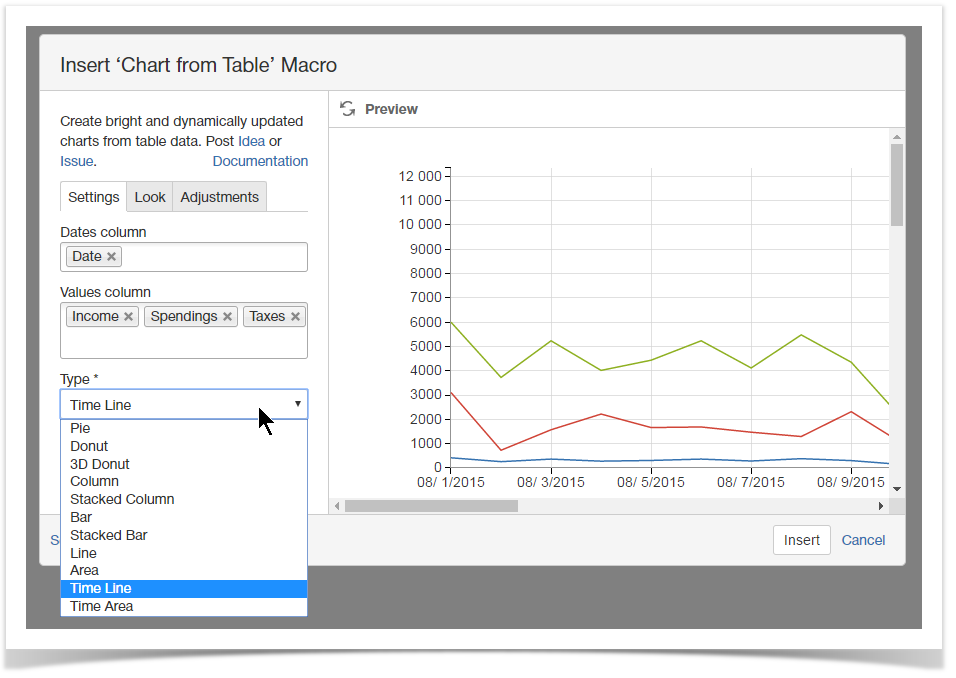
  1. On the Confluence page opened in the edit mode, click the Chart from Table macro.
  2. Click Edit.
  3. In the Insert/Edit Charts from Table Macro form, define parameters of the macro, as follows:
    • Labels / Dates / X-axis value column - select the appropriate column containing the required data for chart generation. The name of the parameter, as well as data type may vary for different chart types.
    • Values column - select the column containing numbering values for chart generation.
    • Type - select the type of chart to generate.
  4. Click Save.
  • For the line and area charts, you will have to select the columns with numbers through the X-axis value column and Y-axis value column dropdown boxes.
  • For the time line and time area charts, you will have to select the columns with dates through the Dates column dropdown box.


Configuring look of the chart

  1. On the Confluence page opened in the edit mode, click the Chart from Table macro.
  2. Click Edit.
  3. Switch to the Look tab.
  4. Configure the parameters affecting the look of chart.
  5. Click Save.
  6. Save the page.

For the details on the list of all available parameters, see this.

To set the chart dimensions:

  1. Locate the Height and Width fields.
  2. Enter the appropriate dimensions of the chart.

To set colors for chart elements (labels):

  1. Locate the Select colors button and click it.
  2. Select the appropriate colors for each label.

To set the chart alignment:

  1. Locate the Align chart option.
  2. Select the appropriate chart alignment, as follows:
    • Left
    • Center
    • Right

To show the chart legend:

  1. Locate the Legend Position option.
  2. Select the appropriate legend position, as follows:
    • None
    • Right
    • Bottom


Adjusting chart configuration

  1. On the Confluence page opened in the edit mode, click the Chart from Table macro.
  2. Click Edit.
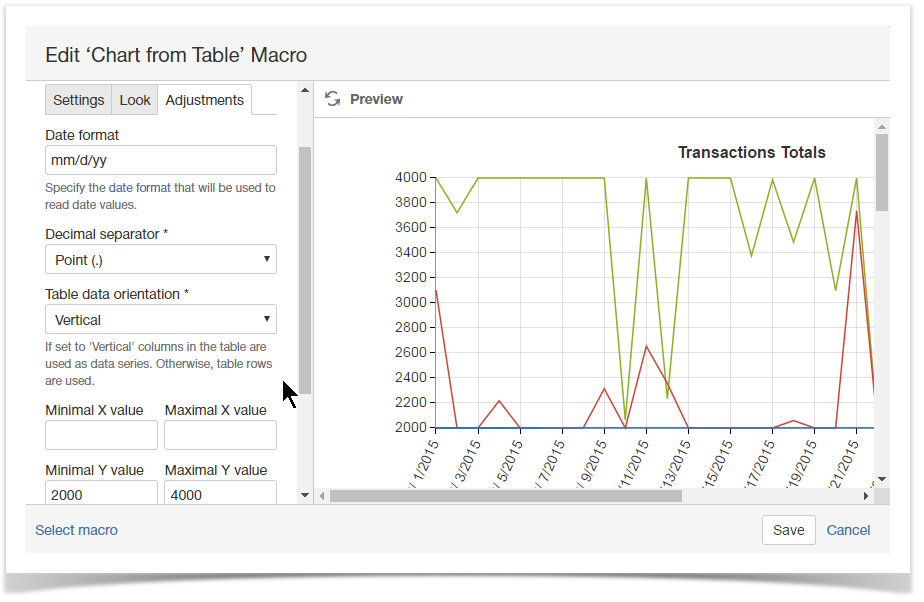
  3. Switch to the Adjustments tab.
  4. Adjust the parameters affecting presentation of data series.
  5. Click Save.
  6. Save the page.

To set the date format:

  1. Locate the Date format option.
  2. Specify the correct date format for date values in the source table.

To show the trendline:

  1. Locate and enable the Show trendline option.

The trendline can be displayed for the line/area and date line/area charts only.


Managing Charts in the Page View Mode

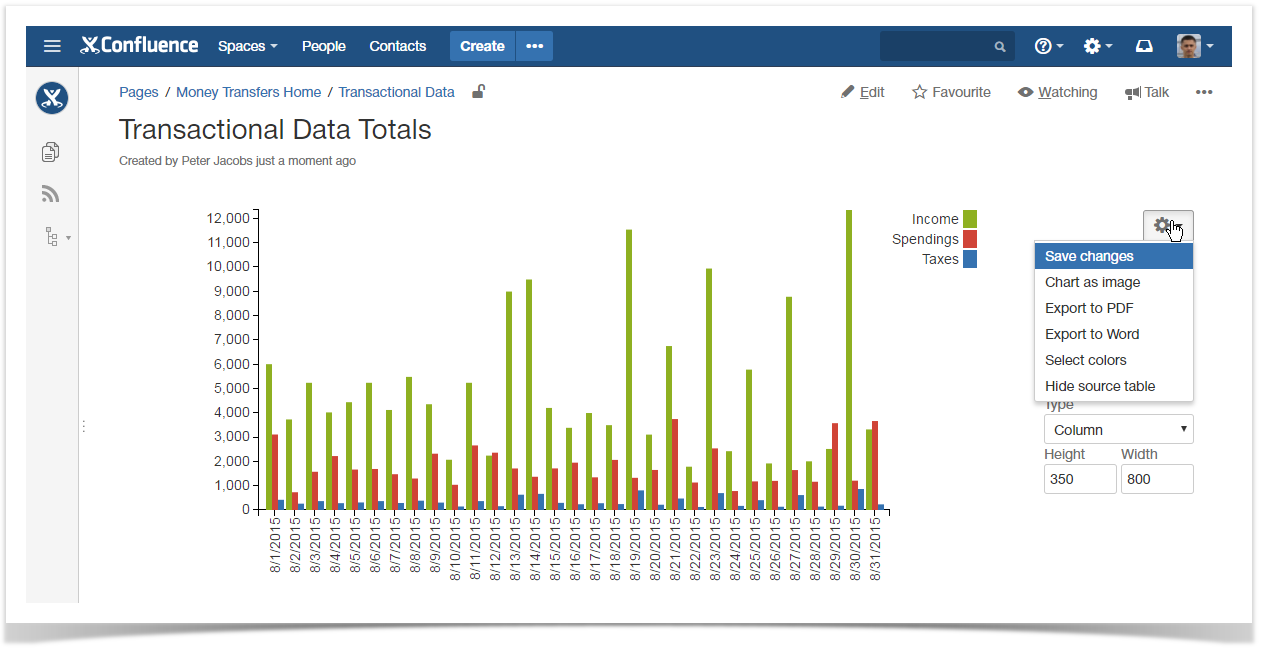
Once you have defined settings of the Table chart macro and saved the page, you get a page with the generated chart.

To the right side of your chart, you can locate the chart management sidebar. It allows you to alternate the following parameters of Chart table macro:

  • Labels column - change the column with labels for another one. 
  • Values column - change the column with data values. The chart will be automatically re-generated. Depending on the used chart type you may select column with numerical through Values column X and Values column Y fields.
  • Dates column - change the column with dates. The chart will be automatically re-generated. This select box is shown for Time Line and Time Area charts only.
  • Type - change the chart type for another one. You may need to re-select the table columns when changing the chart type.
  • Height/Width - specify the required dimensions of the chart.
  • For the line and area charts, you will have to select the columns with numbers through the X-axis value column and Y-axis value column dropdown boxes.
  • For the time line and time area charts, you will have to select the columns with dates through the Dates column dropdown box.

To save new parameters in the macro body:

  1. Click the Cogwheel  icon.
  2. Select Save changes.

To export the chart:

  1. Click the Cogwheel   icon.
  2. Select  Export to PDF  or  Export to Word.

To save the chart as image:

  1. Click the Cogwheel  icon.
  2. Select Chart as image.

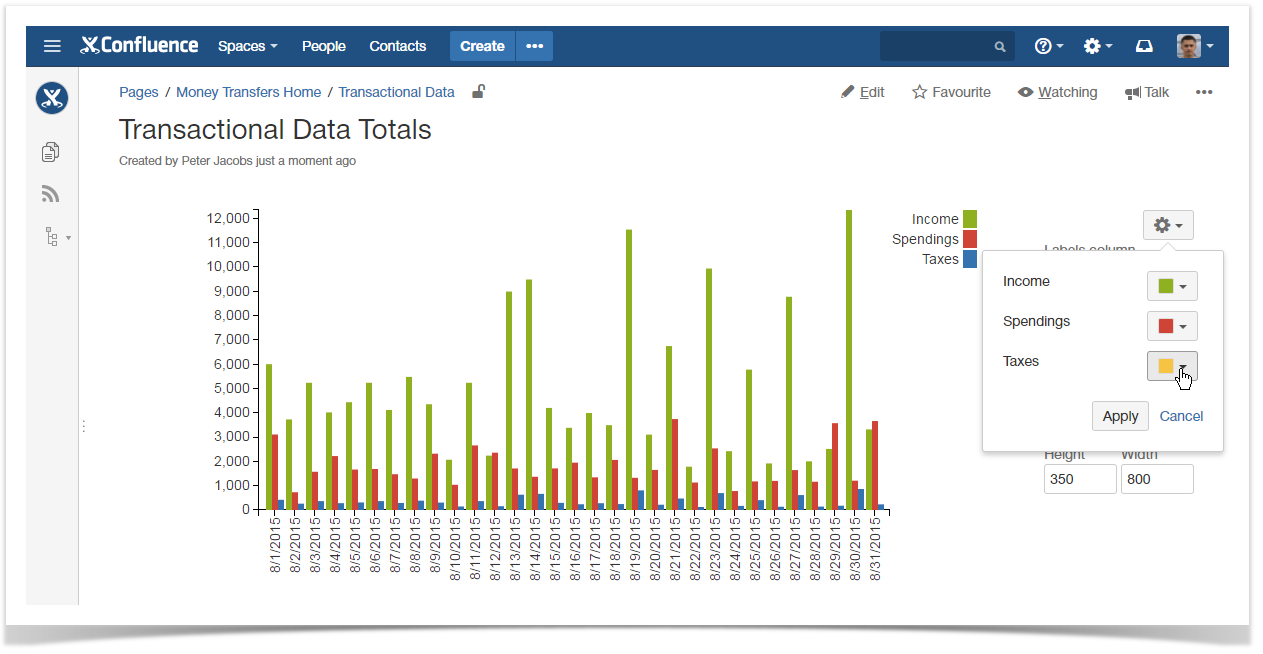
To update the colors used for charts and graphs:

  1. Click the Cogwheel  icon.
  2. Click Select colors.
  3. Click the color picker and select the appropriate color on the palette. 
  4. Click Apply to use the selected colors and redraw your chart or graph.

To show the source table:

  1. Click the Cogwheel  icon.
  2. Select Show source table.

To set the date format:

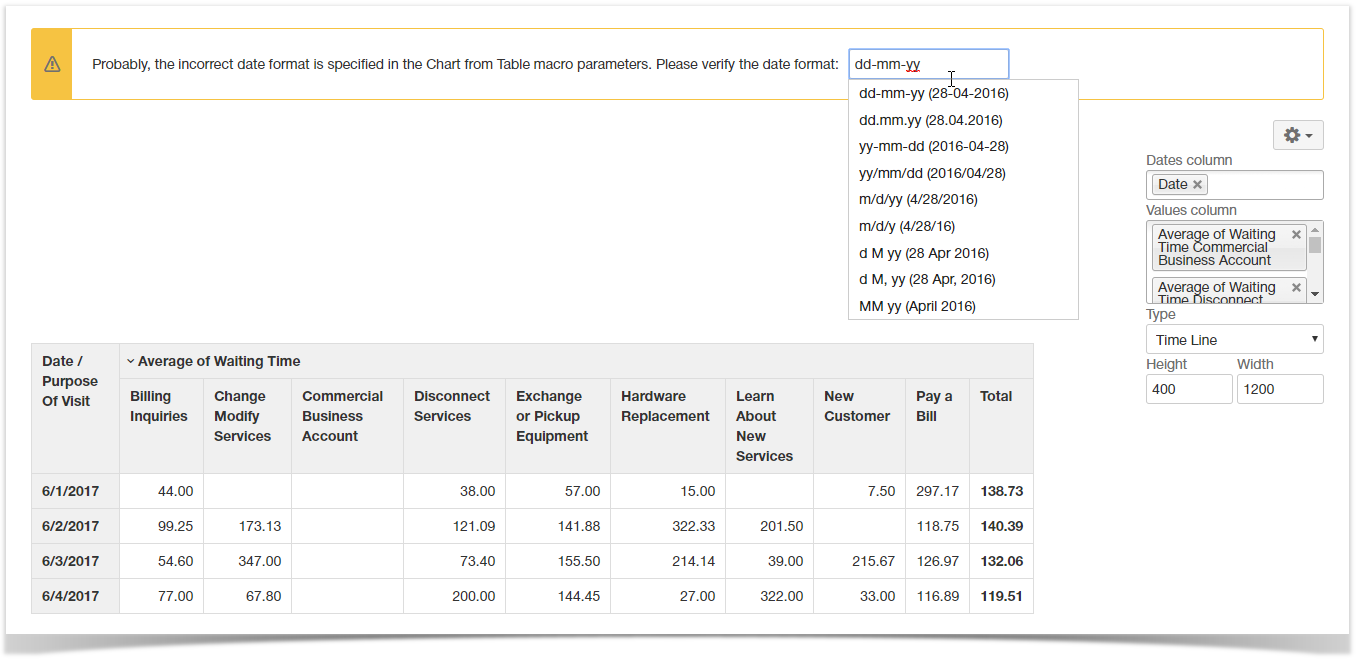
From 3.12.0 version, the Table Filter and Charts app allows you to set the correct date format in the page view mode. If the app detects the incorrect date format it presents you with the note panel where you can enter the correct date format. It is saved automatically if it is treated as the correct date format.


Removing Chart from Table macro for Table

  1. Switch Confluence page to the edit mode.
  2. Select the Chart from Table macro with the table or macro outputting the table.
  3. Click Unwrap.


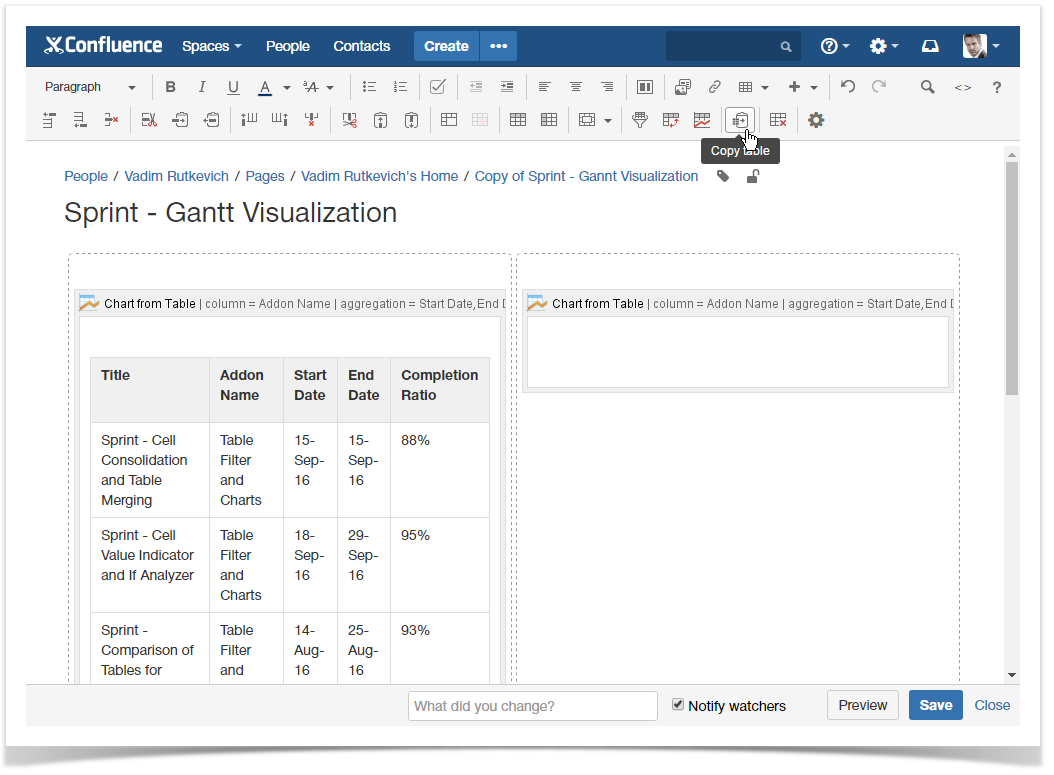
Copying a table into Chart from Table macro

  1. Switch Confluence page to the edit mode.
  2. Position the mouse pointer into any cell of the table you want to copy.
  3. Click the Copy Table  icon on the editor pane.
  4. Paste the table into the Chart from Table macro on the same or on a new page.

You can also use the Table Excerpt and Table Excerpt Include macros for building multiple charts on the basis of a single source table.


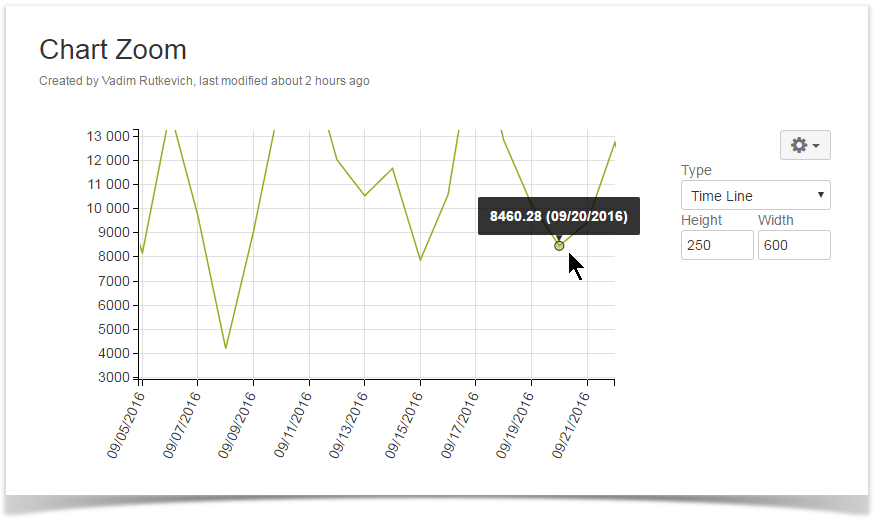
Zooming in Chart

  1. Open the page with the chart you want to zoom in.
  2. Hover your mouse pointer over this chart.
  3. Hold down Ctrl and rotate the wheel button forward to zoom in the chart.

You can also do the following:

To zoom in over the desired chart area:

  1. Click and hold the left mouse button.
  2. Drag the mouse pointer down and right over the chart.

To zoom out the chart:

  1. Click and hold down the left mouse button.
  2. Drag the mouse pointer left over the chart.

To scale up values along chart axes:

  1. Hold down Shift and drag the mouse pointer left or right. (for X axis)
  2. Hold down Shift and drag the mouse pointer upwards or downwards. (for Y axis)

To navigate across the chart:

  1. Hold down Ctrl (for Windows) or Alt (for MacOS) and drag the mouse pointer across the chart.


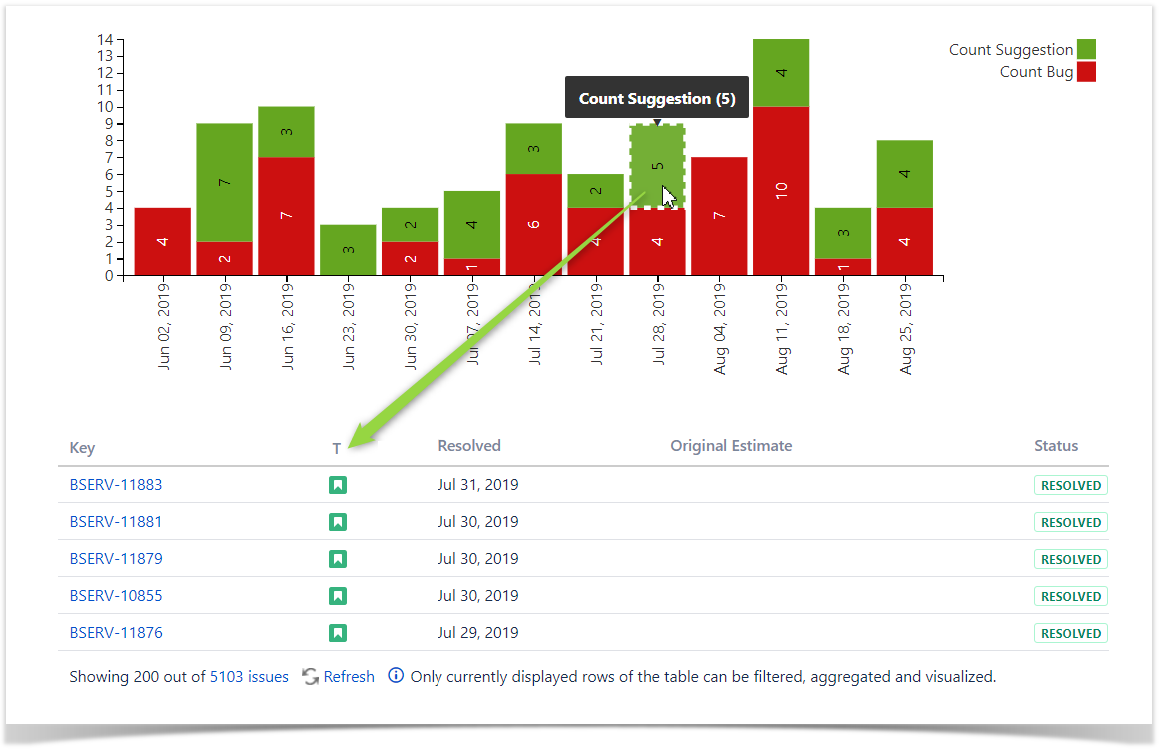
Filtering the source table

  1. Select one or more chart columns/sectors/bars.
  2. Only the related rows of the source table are displayed.
  3. Deselect all the columns/sectors/bars to display the whole source table.


Setting worklog settings


Please ensure that the worklog parameters set in the macro are identical to parameters configured in Atlassian JIRA.


  1. Switch the page to edit mode.
  2. Select the macro and click Edit.
  3. Switch to the Filtration tab.
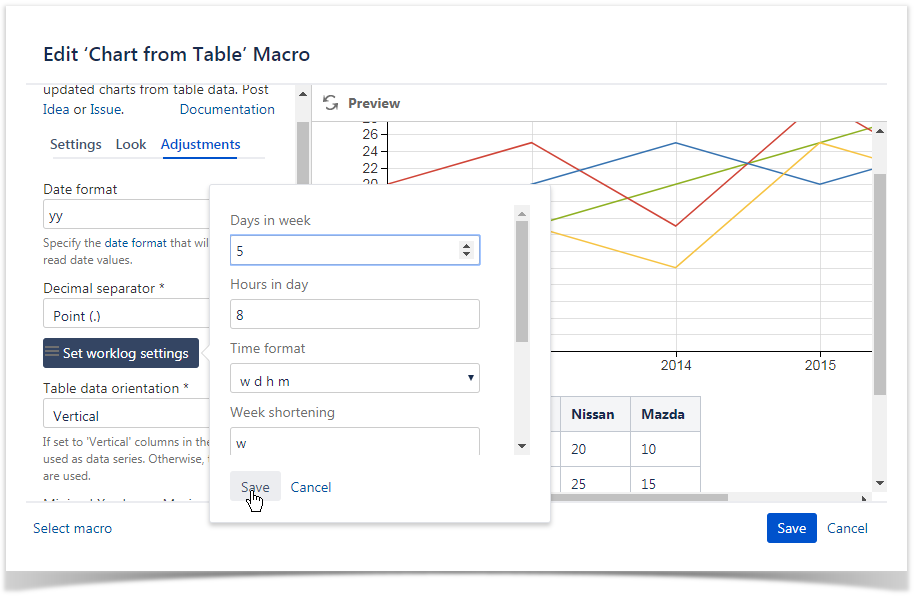
  4. Click the Set worklog settings button.
  5. In the opened form, define the worklog parameters, as follows:
    1. Days in week - enter the number of business days in a week.
    2. Hours in day - enter the number of working hours in one business day.
    3. Time format - select the used time format in worklog values.
    4. Week shortening - enter the shortening for the week time unit if you use any language different from English.
    5. Day shortening - enter the shortening for the day time unit if you use any language different from English.
    6. Hour shortening - enter the shortening for the hour time unit if you use any language different from English.
    7. Minute shortening - enter the shortening for the minute time unit if you use any language different from English.
  6. Click Save.
  7. Save the macro and the page.

Worklog time units in different languages are denoted with different shortenings. Please adjust them according to your JIRA localization settings.


Chart Examples

Below you can find examples of chart configuration and data series used to generate a specific chart type.

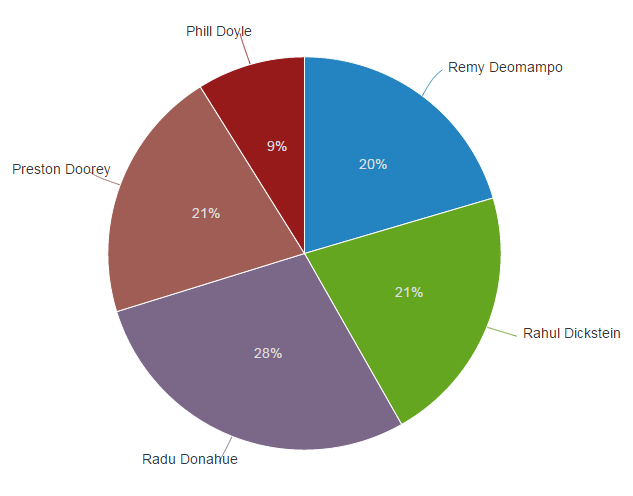
Pie chart

Parameters in Macro BrowserData Table in Macro PlaceholderRendered Chart
Columns labelAgent
Values columnTickets per Hour
TypePie
Decimal separatorPoint (.)
HeightDefault
WidthDefault
AgentTickets per HourAverage Time per Ticket (min)Calls per Hour
Remy Deomampo4.65.14.2
Rahul Dickstein4.81.61.3
Radu Donahue6.45.61.5
Preston Doorey4.71.31.6
Phill Doyle2.03.42.7

You can select multiple table columns for building multiple pie charts at once on the basis of a single table.

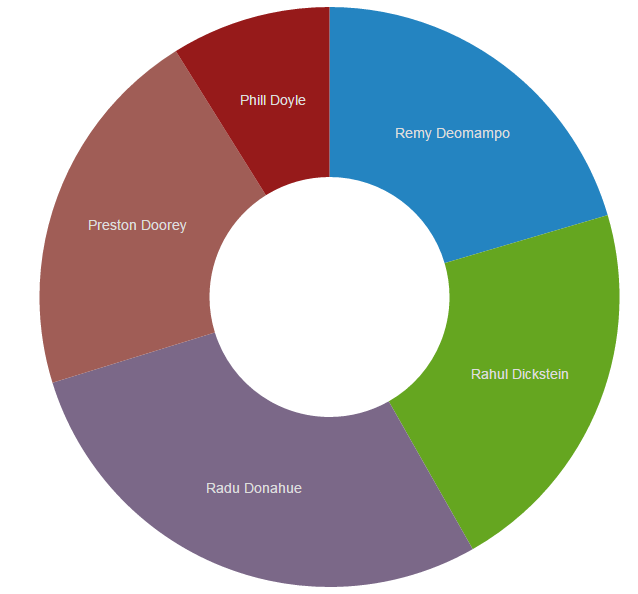
Donut / 3D Donut chart

Parameters in Macro BrowserData Table in Macro PlaceholderRendered Chart
Columns labelAgent
Values columnTickets per Hour
TypeDonut / 3D Donut
Decimal separatorPoint (.)
HeightDefault
WidthDefault
AgentTickets per HourAverage Time per Ticket (min)Calls per Hour
Remy Deomampo4.65.14.2
Rahul Dickstein4.81.61.3
Radu Donahue6.45.61.5
Preston Doorey4.71.31.6
Phill Doyle2.03.42.7


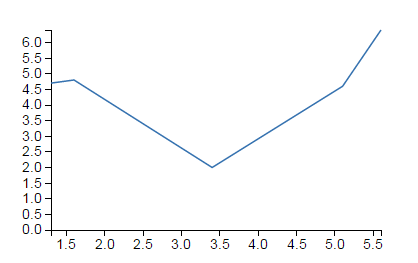
Line chart

Parameters in Macro BrowserData Table in Macro PlaceholderRendered Chart
Columns labelTickets per Hour
Values columnAverage Time per Ticket (min)
TypeLine
Decimal separatorPoint (.)
Height200
Width

400

AgentTickets per HourAverage Time per Ticket (min)Calls per Hour
Remy Deomampo4.65.14.2
Rahul Dickstein4.81.61.3
Radu Donahue6.45.61.5
Preston Doorey4.71.31.6
Phill Doyle2.03.42.7


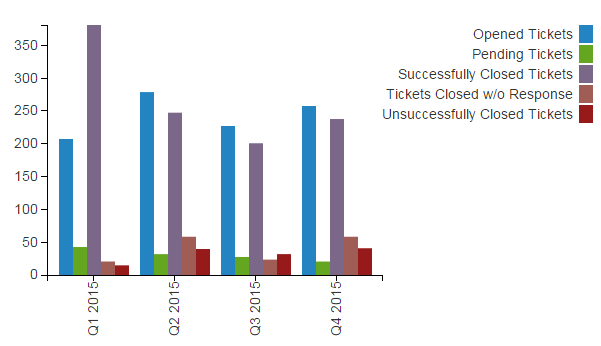
Column chart

Parameters in Macro BrowserData Table in Macro PlaceholderRendered Chart
Columns labelPeriod
Values column
  • Opened Tickets
  • Pending Tickets
  • Successfully Closed Tickets
  • Tickets Closed w/o Response
  • Unsuccessfully Closed Tickets
  • Total Tickets
TypeColumn
Height300
Width600
PeriodOpened TicketsPending TicketsSuccessfully Closed TicketsTickets Closed w/o ResponseUnsuccessfully Closed TicketsTotal Tickets
Q1 2015207423812014664
Q2 2015278312475839653
Q3 2015227272002331508
Q4 2015257202375840612

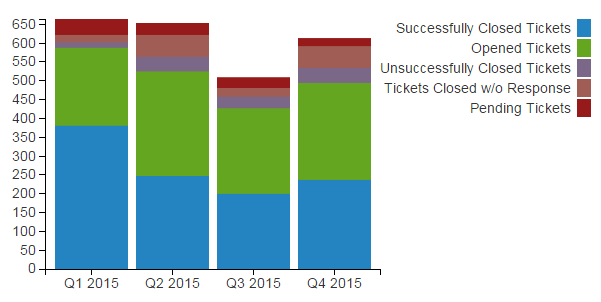
Stacked Column chart

Parameters in Macro BrowserData Table in Macro PlaceholderRendered Chart
Columns labelPeriod
Values column
  • Opened Tickets
  • Pending Tickets
  • Successfully Closed Tickets
  • Tickets Closed w/o Response
  • Unsuccessfully Closed Tickets
  • Total Tickets
TypeStacked Column
Height300
Width

600


PeriodOpened TicketsPending TicketsSuccessfully Closed TicketsTickets Closed w/o ResponseUnsuccessfully Closed TicketsTotal Tickets
Q1 2015207423812014664
Q2 2015278312475839653
Q3 2015227272002331508
Q4 2015257202375840612

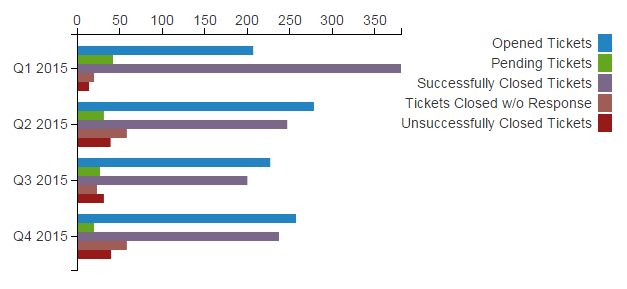
Bar chart

Parameters in Macro BrowserData Table in Macro PlaceholderRendered Chart
Columns labelPeriod
Values column
  • Opened Tickets
  • Pending Tickets
  • Successfully Closed Tickets
  • Tickets Closed w/o Response
  • Unsuccessfully Closed Tickets
  • Total Tickets
TypeBar
Height300
Width400
PeriodOpened TicketsPending TicketsSuccessfully Closed TicketsTickets Closed w/o ResponseUnsuccessfully Closed TicketsTotal Tickets
Q1 2015207423812014664
Q2 2015278312475839653
Q3 2015227272002331508
Q4 2015257202375840612


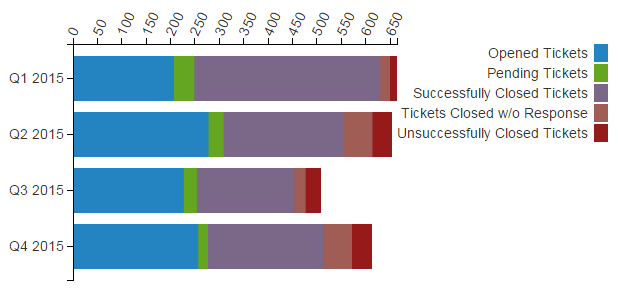
Stacked Bar chart

Parameters in Macro BrowserData Table in Macro PlaceholderRendered Chart
Columns labelPeriod
Values column
  • Opened Tickets
  • Pending Tickets
  • Successfully Closed Tickets
  • Tickets Closed w/o Response
  • Unsuccessfully Closed Tickets
  • Total Tickets
TypeStacked Bar
Height300
Width

600

PeriodOpened TicketsPending TicketsSuccessfully Closed TicketsTickets Closed w/o ResponseUnsuccessfully Closed TicketsTotal Tickets
Q1 2015207423812014664
Q2 2015278312475839653
Q3 2015227272002331508
Q4 2015257202375840612

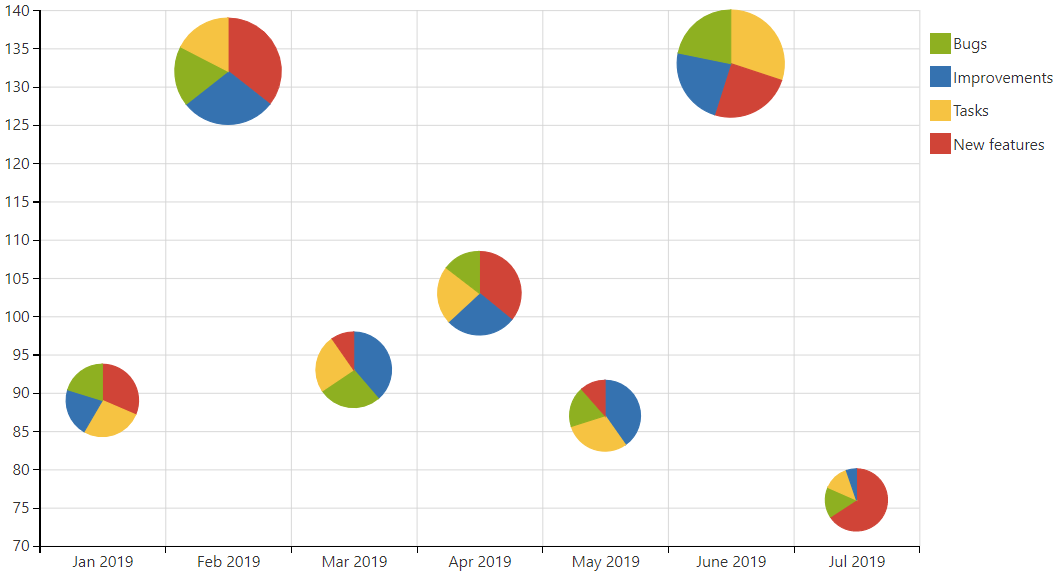
Bubble Pie chart

Parameters in Macro BrowserData Table in Macro PlaceholderRendered Chart
X-axis and Y-axis columns
  • Date
  • Total requests
Values column
  • Bugs
  • Improvements
  • Tasks
  • New features
TypeBubble Pie
Height600
Width

1000

DateTotal requestsBugsImprovementsTasksNew features
Jan 20198918192428
Feb 201913224382347
Mar 2019932536239
Apr 201910315282337
May 20198716352610
June 201913329314033
Jul 2019761241050

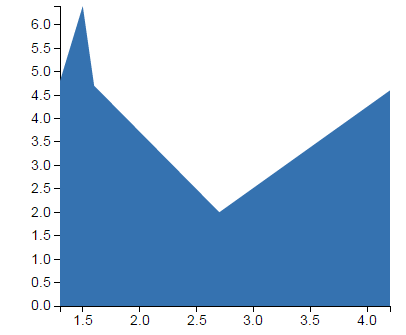
Area chart

Parameters in Macro BrowserData Table in Macro PlaceholderRendered Chart
Columns labelTickets per Hours
Values columnCalls per Hour
TypeArea
Decimal separatorPoint (.)
Height300
Width400
AgentTickets per HourAverage Time per Ticket (min)Calls per Hour
Remy Deomampo4.65.14.2
Rahul Dickstein4.81.61.3
Radu Donahue6.45.61.5
Preston Doorey4.71.31.6
Phill Doyle2.03.42.7


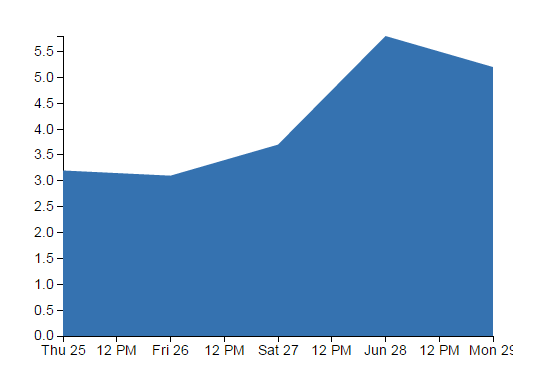
Time Line / Time Area chart

Parameters in Macro BrowserData Table in Macro PlaceholderRendered Chart
Values ColumnAverage Time per Ticket (min)
Dates columnDate
TypeBar
Decimal separatorPoint (.)
Date formatdd.mm.yy
Height300
Width400
DateTickets per HourAverage Time per Ticket (min)Calls per Hour
25.06.20157.33.23.3
26.06.20158.53.11.8
27.06.20155.03.74.5
28.06.20152.25.82.7
29.06.20152.03.42.7


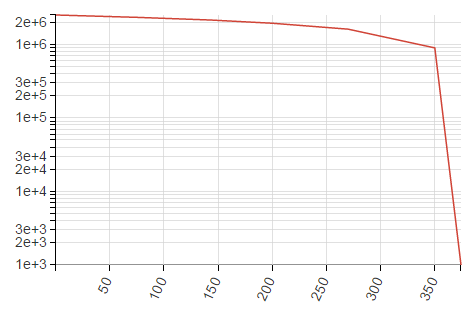
Line / Area chart (Logarithmic scale)

Instead of using the default arithmetic scale, you can use the logarithmic scale that is convenient for too large or too small numbers.

Parameters in Macro BrowserData Table in Macro PlaceholderRendered Chart
X-axis value columnTemperature (Celcium degree)
Y-axis value columnEvaporation heat, Joule/kg
TypeLine
Logarithmic scale YEnabled
Temperature (Celcium degree)Evaporation heat, Joule/kg
0.52.500E+6
75.42.322E+6
142.92.137E+6
200.41.930E+6
270.01.605E+6
3500.893E+6
374.150.001E+6

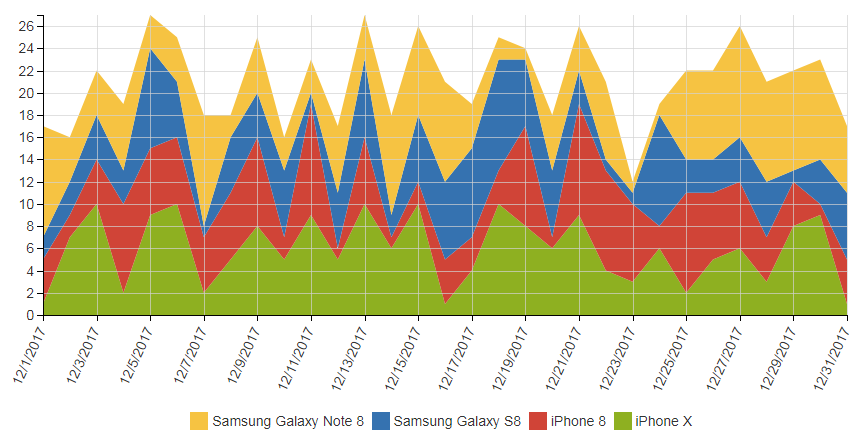
Stacked Time Area chart

Parameters in Macro BrowserData Table in Macro PlaceholderRendered Chart
Dates columnDate
Values columniPhone X, iPhone 8, Samsung Galaxy S8, Samsung Galaxy Note 8
TypeStacked Time Area
Height300
Width900
Legend positionBottom
Date formatm/d/yy
DateiPhone XiPhone 8Samsung Galaxy S8Samsung Galaxy Note 8
12/1/201714210
12/2/20177234
12/3/201710444
12/4/20172836
12/5/20179693
12/6/201710654
12/7/201725110
12/8/20175652
12/9/20178845
12/10/20175263
12/11/201791013
12/12/20175156
12/13/201710674
12/14/20176129
12/15/201710268
12/16/20171479
12/17/20174384
12/18/2017103102
12/19/20178961
12/20/20176165
12/21/201791034
12/22/20174917
12/23/20173711
12/24/201762101
12/25/20172938
12/26/20175638
12/27/201766410
12/28/20173459
12/29/20178419
12/30/20179149
12/31/20171466


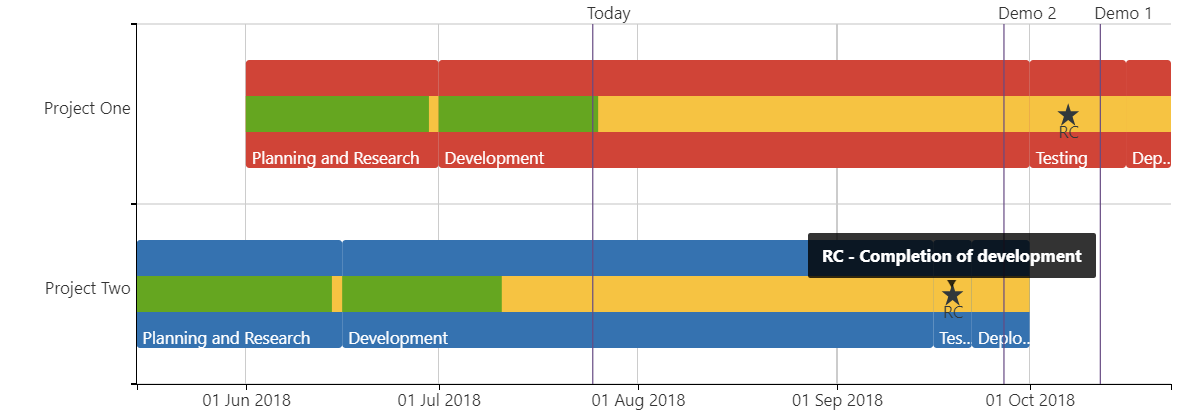
Gantt chart

Parameters in Macro BrowserData Table in Macro PlaceholderRendered Chart
Labels column
  • Project
  • Phase
  • Milestone
  • Event
  • Description of Milestone
  • Description of Event
Values column
  • Start Date
  • End Date
  • Completion Ratio
  • Date
TypeGantt
Scale Step1m
Date Formatdd M yy

Project

Phase

Start Date

End Date

Completion Ratio

Project One

Planning and Research

01 Jun 2018

30 Jun 2018

95%

Project One

Development

01 Jul 2018

30 Sep 2018

27%

Project One

Testing

01 Oct 2018

15 Oct 2018

0%

Project One

Deployment

16 Oct 2018

22 Oct 2018

0%

Project Two

Planning and Research

15 May 2018

15 Jun 2018

95%

Project Two

Development

16 Jun 2018

15 Sep 2018

27%

Project Two

Testing

16 Sep 2018

21 Sep 2018

0%

Project Two

Deployment

22 Sep 2018

30 Sep 2018

0%

ProjectMilestoneDescription of MilestoneDate
Project OneRCСompletion of development

7 Oct 2018 

Project TwoRCСompletion of development

19 Sep 2018 


EventDescription of EventDate
Today
today
Demo 1Release of Demo 1

12 Oct 2018

Demo 2Release of Demo 2

27 Sep 2018

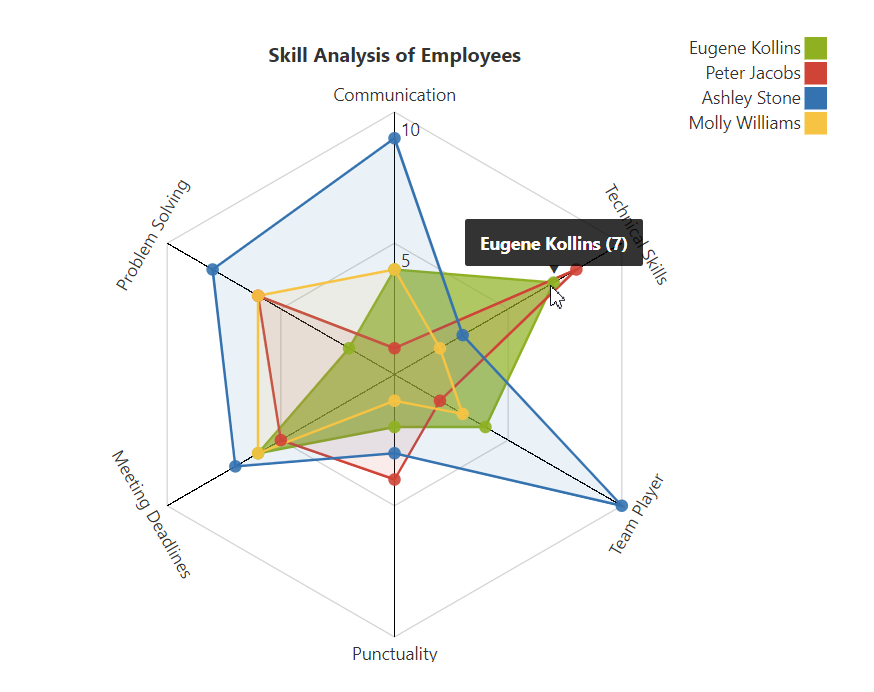
Radar (Spider) chart

Parameters in Macro BrowserData Table in Macro PlaceholderRendered Chart
Labels column

Name

Values column
  • Communication
  • Technical Skills
  • Team Player
  • Meeting Deadlines
  • Problem Solving
  • Punctuality
TypeRadar
Maximal value10
NameCommunicationTechnical SkillsTeam PlayerMeeting DeadlinesProblem SolvingPunctuality
Eugene Kollins474622
Peter Jacobs182564
Ashley Stone9310783
Molly Williams423661

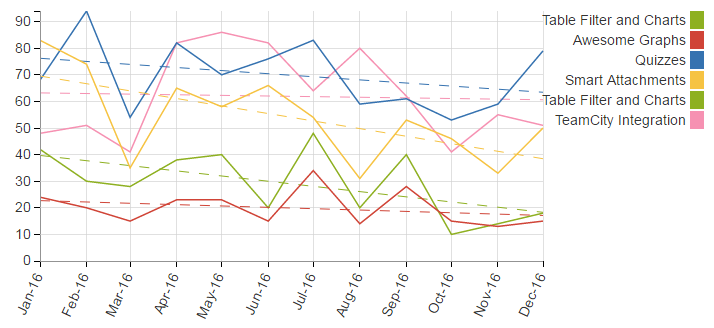
Time Line chart with Trend

Parameters in Macro BrowserData Table in Macro PlaceholderRendered Chart
Dates ColumnAdd-on
Values Column
  • Table Filter and Charts
  • Smart Attachments
  • Quizzes
  • Awesome Graphs
  • TeamCity Integration
TypeTime Line
Date FormatM-y
Show trend lineEnabled
Add-onTable Filter and ChartsSmart AttachmentsQuizzesAwesome GraphsTeamCity Integration
Jan-16216247348
Feb-16155979551
Mar-16142140141
Apr-16194663482
May-16203850386
Jun-16105666582
Jul-162430591064
Aug-16102149480
Sep-16203341862
Oct-16541481041
Nov-1672652655
Dec-1694170651
  • No labels