| Panel | ||||||
|---|---|---|---|---|---|---|
| ||||||
Table Filter and Charts for Confluence add-on allows you to summarize your table data and produce its aggregated view in the form of the a pivot table. You can select the column containing labels for summarization or aggregation and set the column columns containing number values for calculation. Additionally, you can select the appropriate operation type (sum, count, minimal, maximal and average). Optionally, While adjusting the macro parameters you can set the decimal and thousands separator, as well as specify the number of decimal places. You can modify settings of your pivot table and save modifications in the macro body while viewing the page. |
| Table of Contents |
|---|
| Widget Connector | ||||||
|---|---|---|---|---|---|---|
|
Starting from version 3.0.0 Table Filter add-on allows you to generate pivot tables from the data tables. A pivot table is such a kind of a table that allows you to get the summarized and aggregated data values from the master table.
The Pivot table macro allows you to perform the following operations:
- Count - counts the number of values pertaining to one label in the master table.
- Max - determines the maximal value per each label.
- Min - determines the minimal value per each label.
- Average - calculates the average values per each label.
- Sum - calculates the sum of values per each label.
Inserting Pivot table macro
There exist three ways to insert the Pivot Table macro on the page.
| Macro Insertion | Instructions | Supported Data | ||
|---|---|---|---|---|
| Inserting the macro through the action icon on the editor pane |
|
| ||
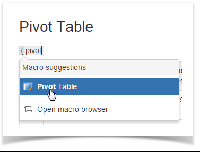
| Manual entry of the {Pivot Table} query on the page |
|
| ||
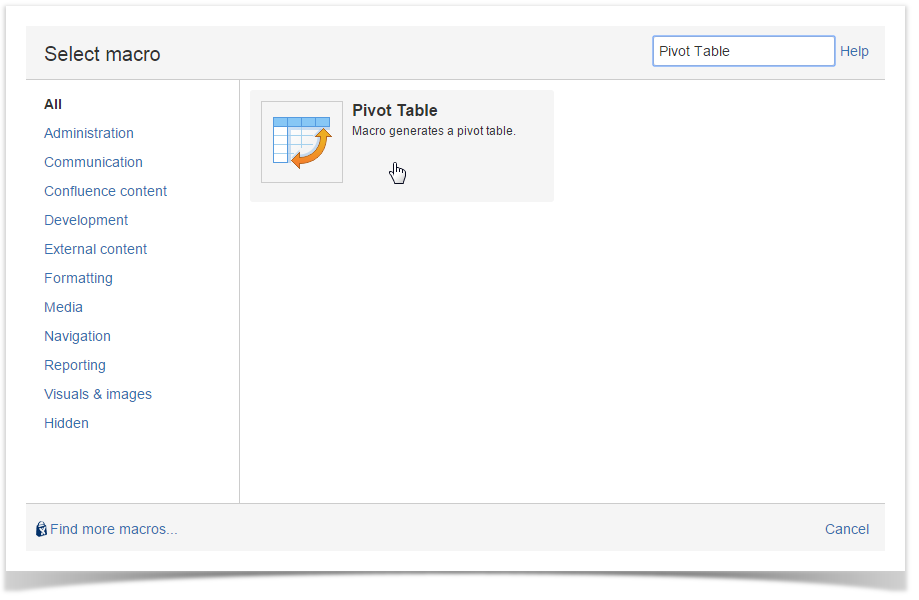
| Selection of the Pivot Table macro in the Select Macro form |
|
|


| Info |
|---|
Before inserting the table into the Pivot Table macro ensure the following things:
|
Selecting Data Series
On the Confluence page opened in the edit mode, click the Pivot table macro.
- Click
Click Edit.
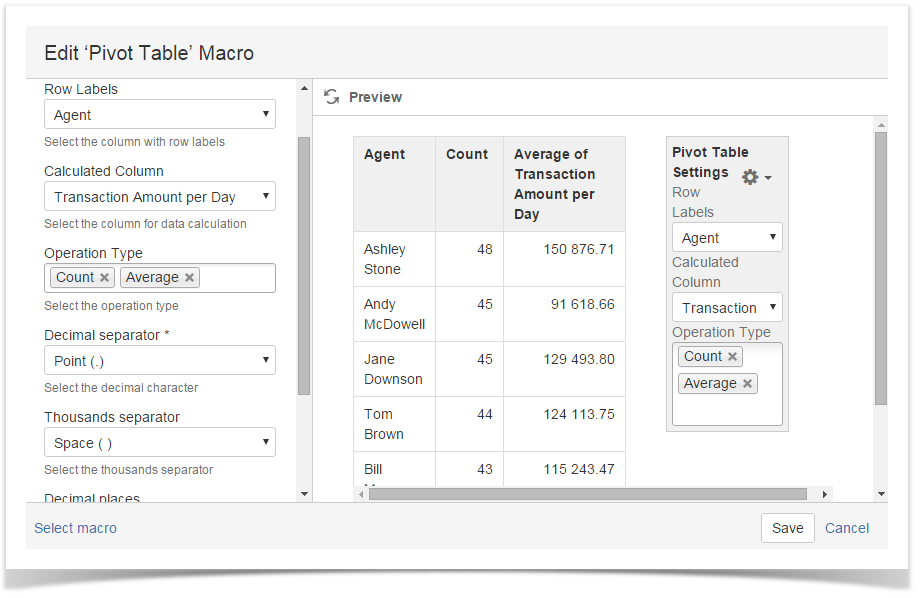
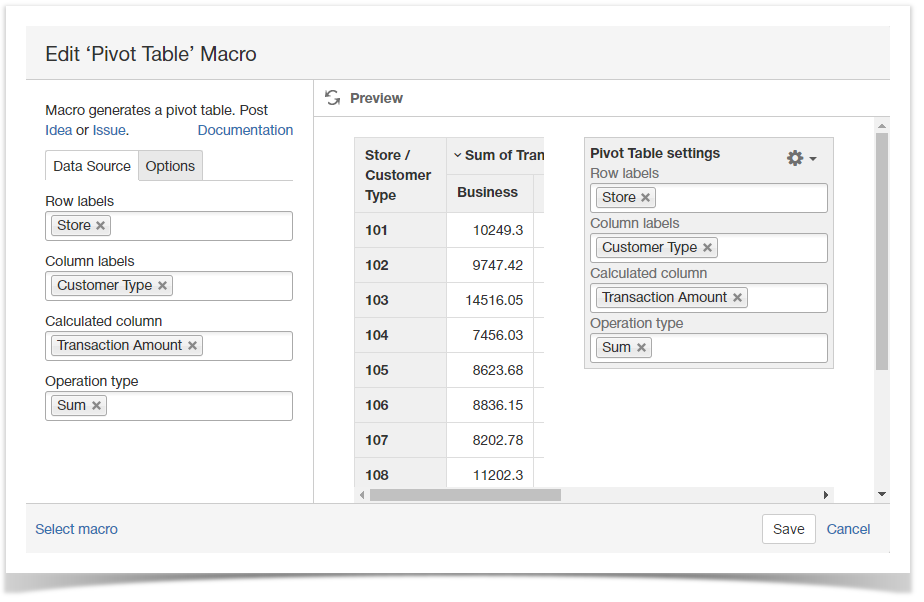
In the Edit Pivot table Macro form, define parameters of the macro, as follows:
- Row Labelslabels - select the column with labels, which the data will be summarized forone or multiple table columns that will be positioned horizontally in the pivot table.
- Column labels - select one or multiple table columns that will be positioned vertically in the pivot table.
- Calculated Column - select the column you want to perform calculations forone or multiple columns that will be calculated or aggregated according to the selected operation type.
- Operation Type - select one or multiple operations you want to perform on summarized datathe calculated data in the pivot table.
- Decimal separator - select the correct decimal character.
- Adjust the parameters of the pivot table, as follows:
- Thousands separator - select the correct thousands separator (optional, for better data presentation).
- Decimal places - enter the number of decimal places to show in the pivot table.
- Show the source table - select this option to show the source table under the pivot table.
- Hide control panel - select this option to hide the control panel in the page view mode.
- Click Save.
Using the Pivot table
Once you have defined settings of the Pivot table macro and saved the page, you get a pivot table with summarized data.
The generated pivot table is comprised of two columns:
- The column with labels that data was summarized for.
- The column with calculated values depending on the selected operation.
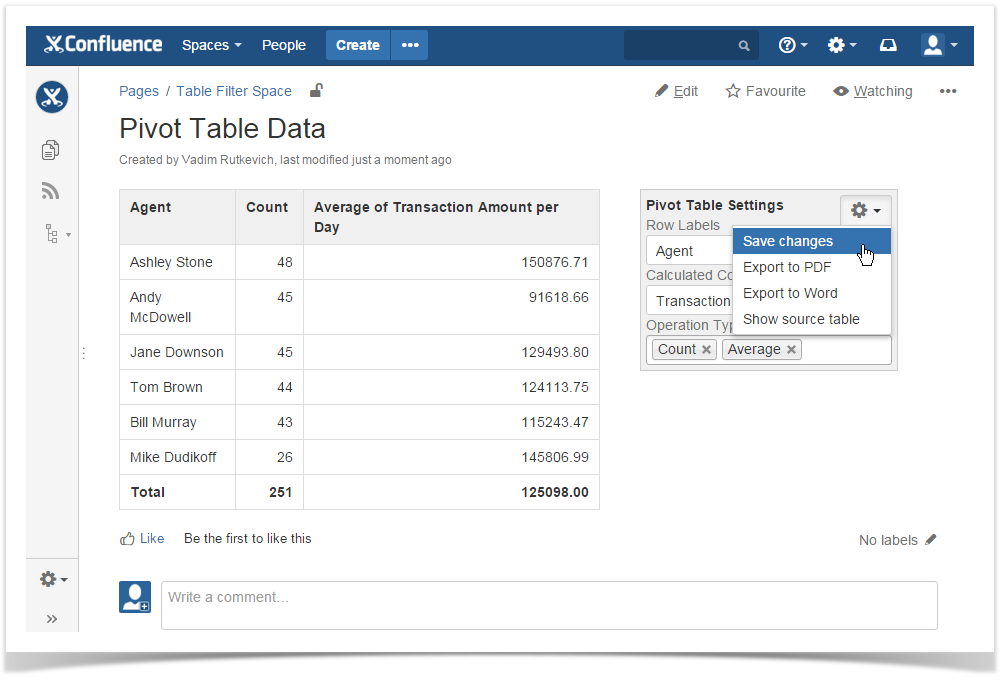
The Total row shows the calculated value throughout the pivot table.
To the right side of your pivot table, you can locate the Pivot Table Settings sidebar. It allows you to alternate the following parameters of Pivot table macro:
- Row Labels - change the column with labels for another one.
- Calculated Column - change the column for data calculations.
- Operation Type - change the operation type for another one or select additional
To save new parameters in the macro body, click the Cogwheel  icon and select Save settings.
To export the pivot table, click the Cogwheel icon and select Export to PDF or Export to Word.
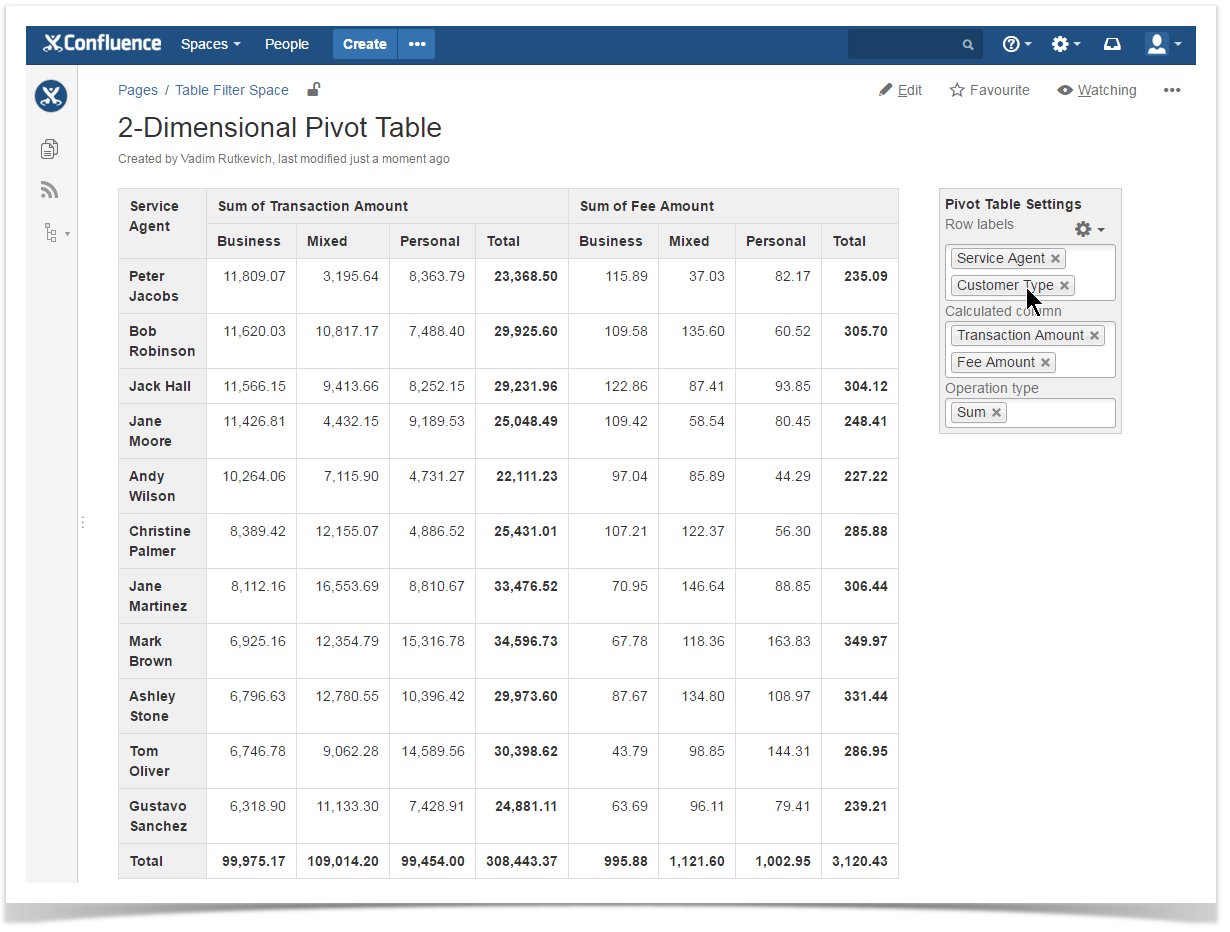
Creating
TwoMulti-Dimensional Pivot Table
Starting from version 3.6.0 Table Filter and Charts add-on allows you to create two-dimensional pivot tables and select multiple calculated columns.
- Place the table within the Pivot Table macro.
- Adjust the settings of the macro if needed.
- Save the page with the macro.
- In the Row Labels box, select two table columns for data aggregation or summarization.
- Select one or multiple table columns for data calculcation.
- Save changes in the macro body.
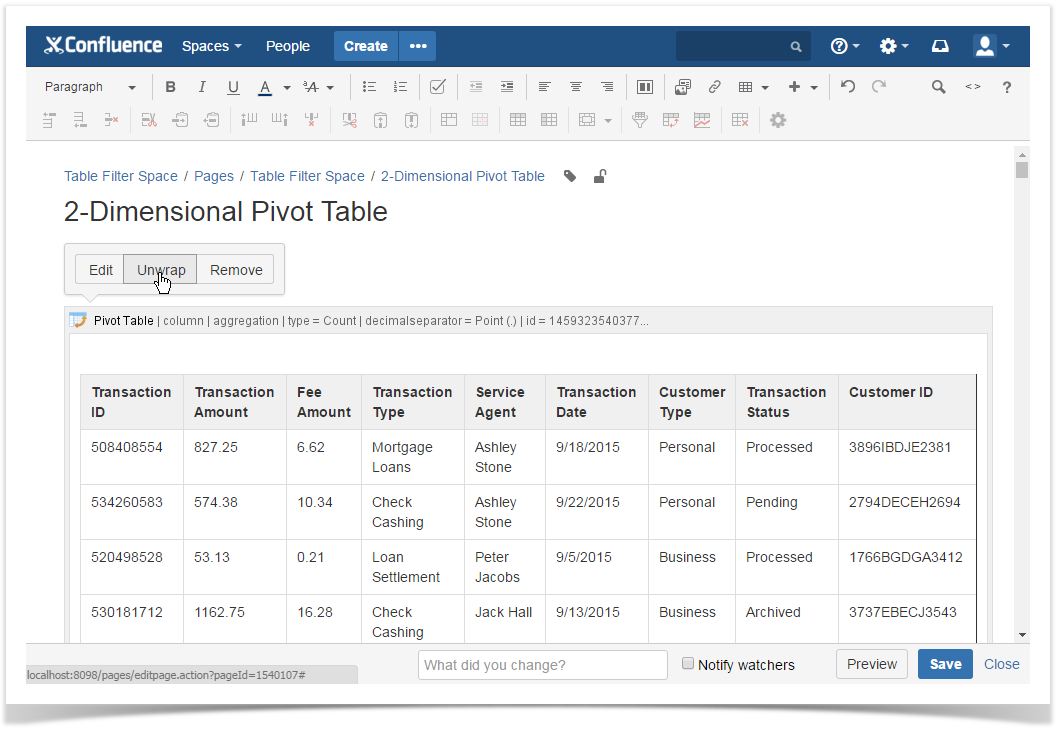
Removing Pivot Table macro for Tables
- Switch Confluence page to the edit mode.
- Select the Pivot Table macro with the table or macro outputting the table.
- Click Unwrap.