...
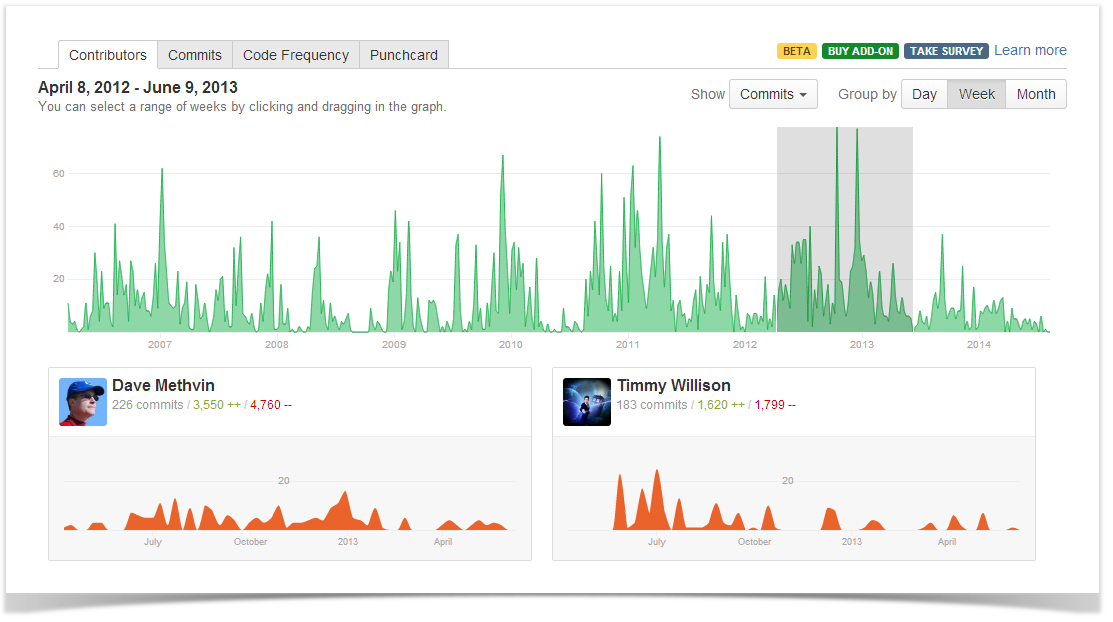
- in the upper part, the graph of all contributions in the repository,
- in the lower part, all repository commiters with their personal activity graphs and a total of lines of code added (green) and deleted (red) by commiter.
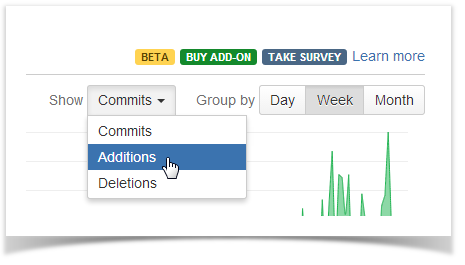
Activity Type
In the Show menu, you can choose whether commits, code line additions or deletions should be displayed in the general graph.
Time Span
You can drag across the graph to show contributor statistics for a certain period of time (this feature is available as a part of the Advanced pack).
Activity Type
In the Show menu, you can choose whether commits, code line additions or deletions should be displayed in the general graph.
Grouping Criteria
...