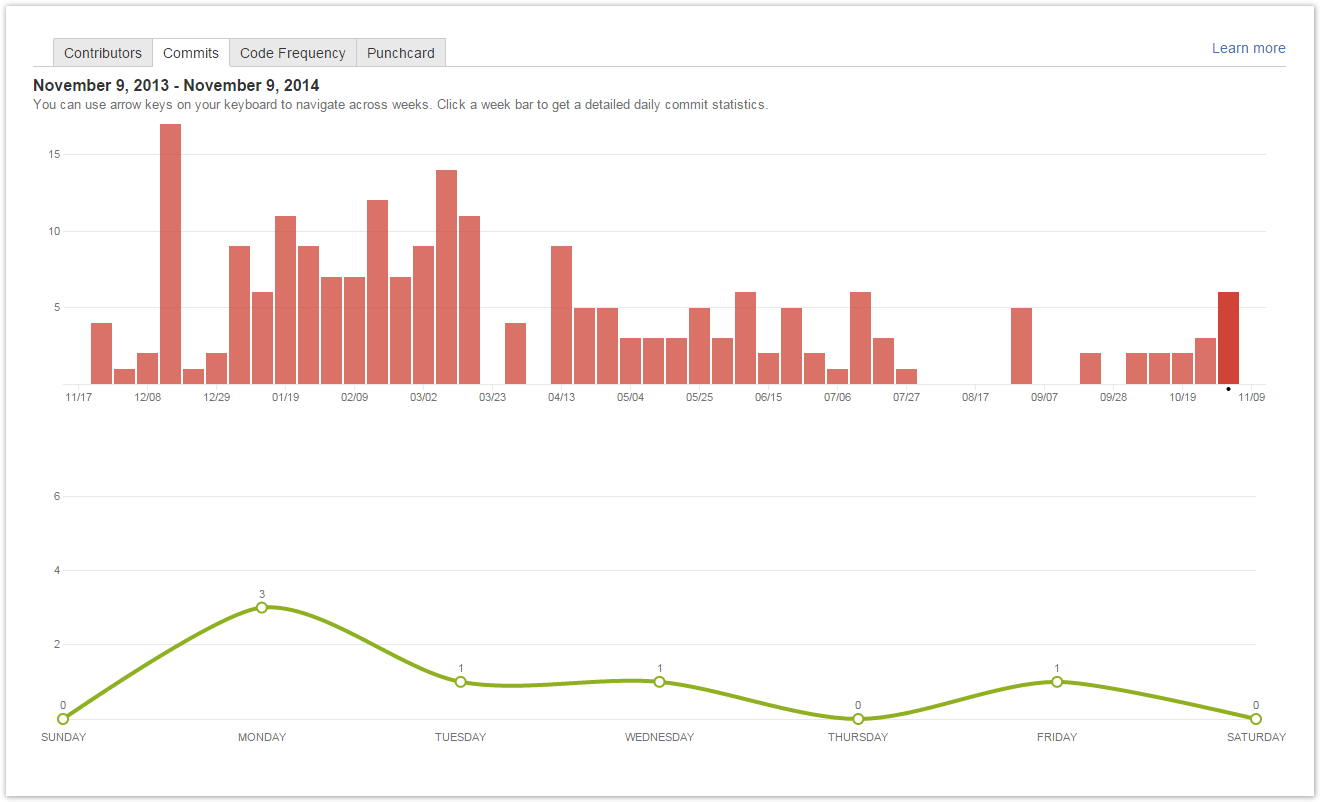
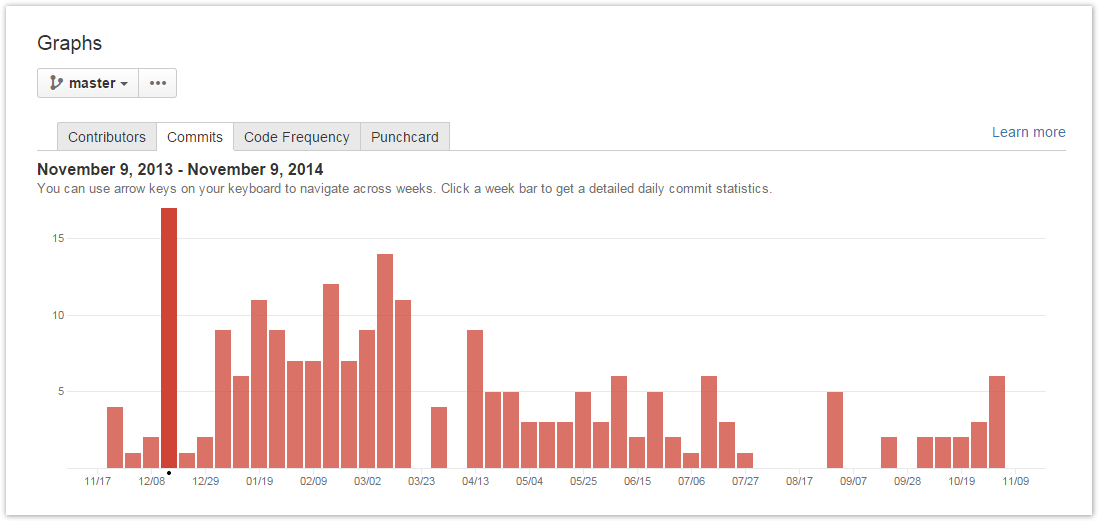
In the Commits tab you can see:
• in the upper part, the The interactive Commits bar chart represents . It displays all commits made over the last year . The commits are grouped by weekgrouped by week. Each bar represents one week. Click a bar to see a total number of commits made that week. You can use arrow keys on your keyboard to navigate from one bar to another. When you click a bar or switch from one bar to another you see changes in the scatter chart below.
You can use arrow keys on your keyboard to navigate across weeks. Click a week bar to get a • in the lower part, the interactive Commits scatter chart. It displays detailed daily commit statistics of the week selected in the upper Commits bar chart. Each chart marker represents one day.