...
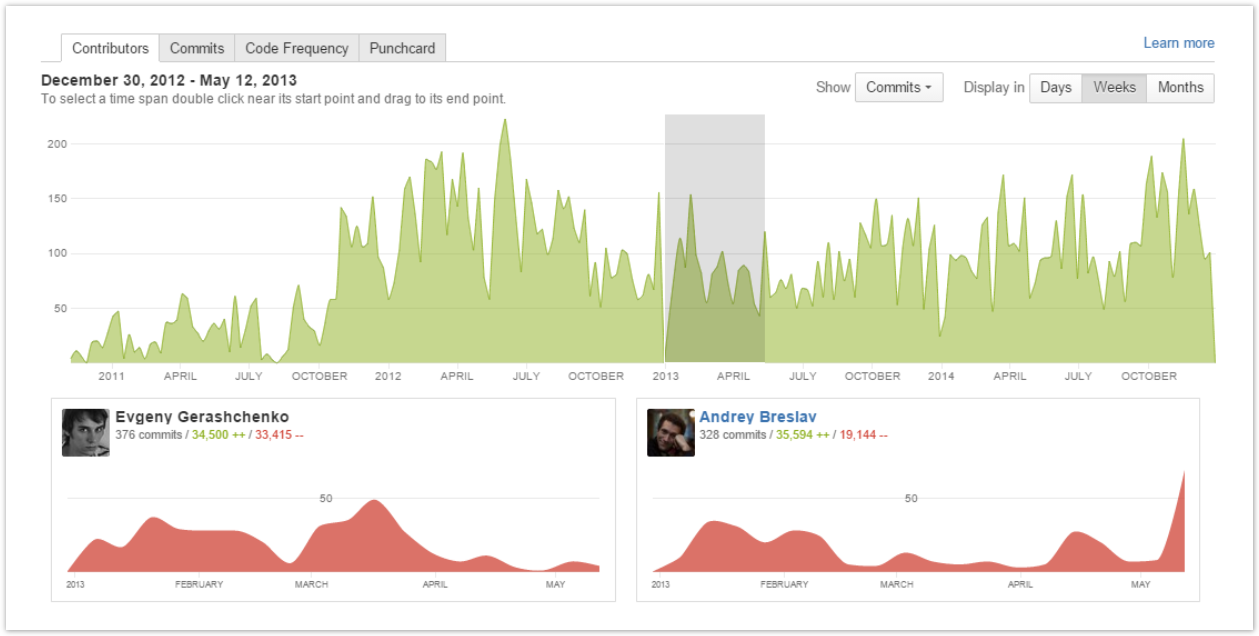
- personal contribution graphs (red) representing their individual contributions filtered according to the current summary graph settings (contribution type; time span; by day/week/month);
- total of commits;
- total of lines of code added (green);
- total of lines of code deleted (red) by contributor.
Talk id talk-309
Activity Type
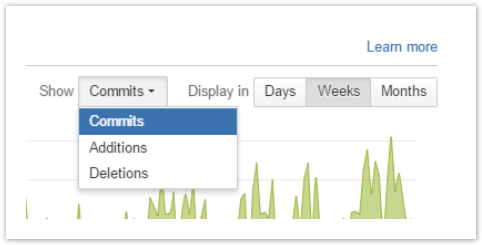
To choose what activity (commits, additions or deletions) to display in the summary graph navigate to the Show menu and select one of the options from the drop-down list.
| Talk | ||
|---|---|---|
|
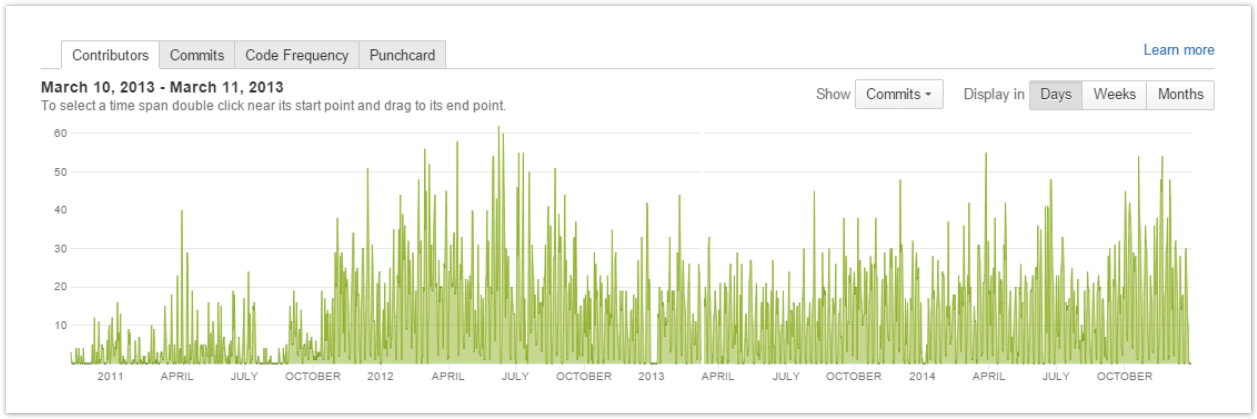
Time Span
| Status | ||||||
|---|---|---|---|---|---|---|
|
...
To display contributions grouped by whether day, week or month, click one of the Display in buttons.
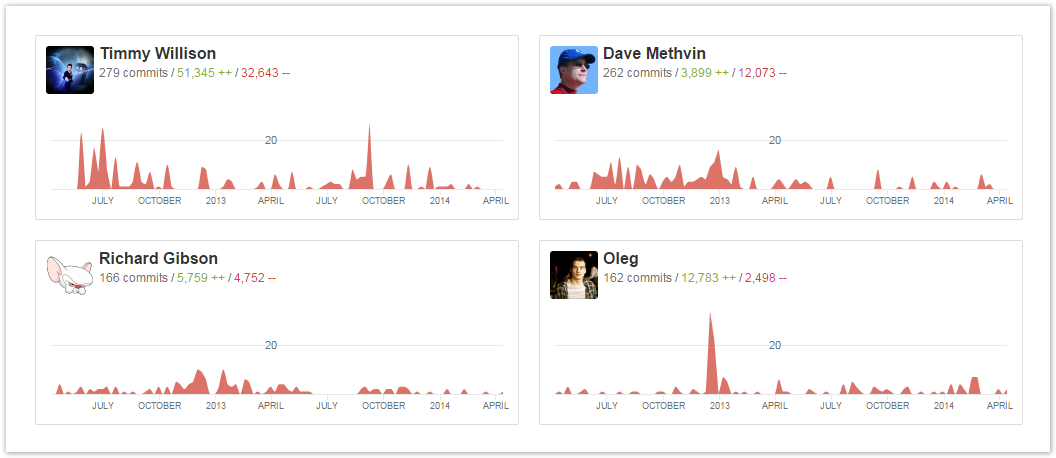
Contributors List
The contributors are ordered by value specified in the Show menu. For example, if Commits is chosen, contributors are ordered by the number of commits they made in the repository.
...
...