...
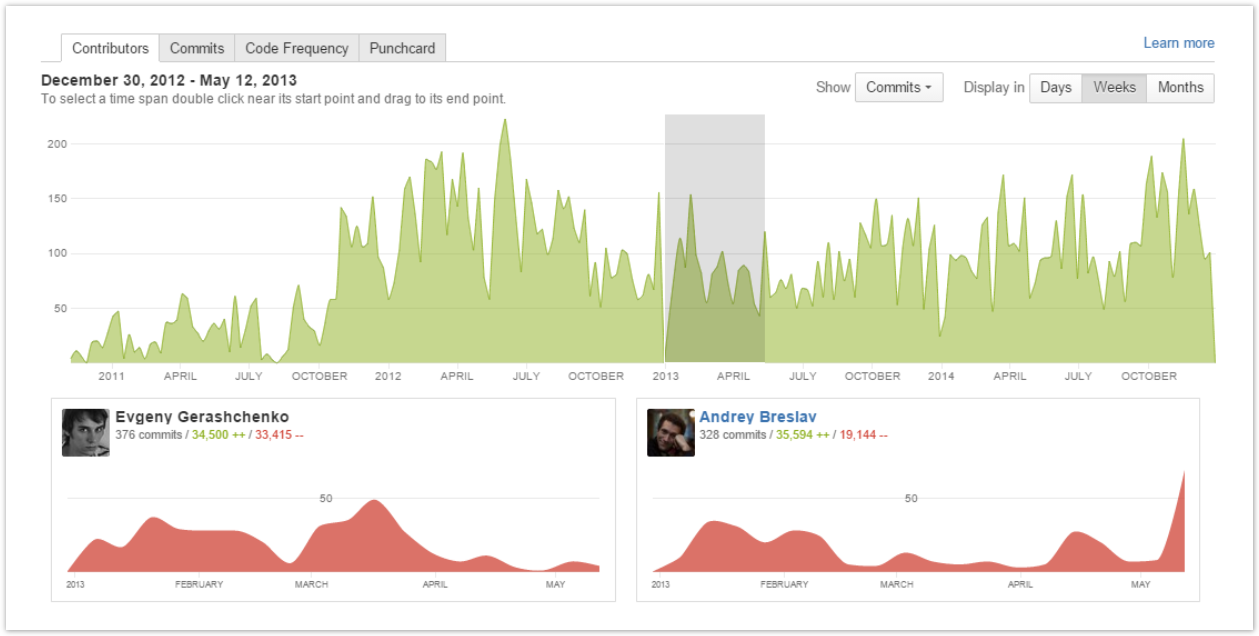
In the Contributors tab you can see, in the upper part, Summary Graph (green) representing the number of total contributions (commits/additions/deletions) made to the repository over a certain time span grouped by day/week/month; and, in the lower part, all repository Contributors with their:
- personal contribution graphs (redsmall graphs below the summary graph) representing their individual contributions filtered according to the current summary graph settings (contribution type; time span; by day/week/month);
- total of commits;
- total of lines of code added (green);
Talk id talk-497 - total of lines of code deleted (red) by contributor.
Activity Type
...