...
| Table of Contents | ||||||
|---|---|---|---|---|---|---|
|
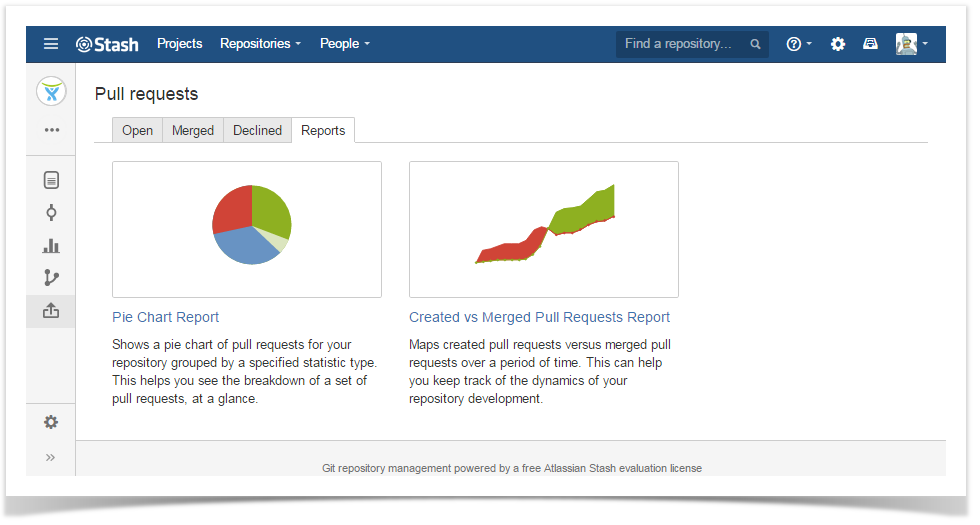
Pie Chart Report
It shows a pie chart of pull requests grouped by a specified statistic type. This helps you see the breakdown of a set of pull requests, at a glance.
...
- Navigate to the repository of your choice.
- Choose Pull requests> Reports> Pie Chart Report.
ss Select which type of statistic to group pull requests by. Choose one of the options:
Author
Reviewer
State
Destination
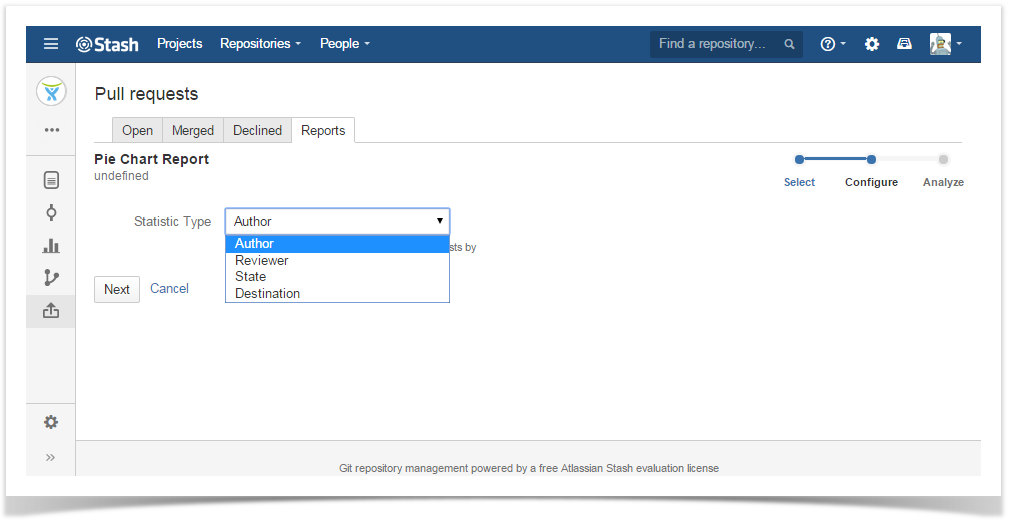
Source
ss
Click 'Next'.
Once configuration is done, you will see something like this:
ss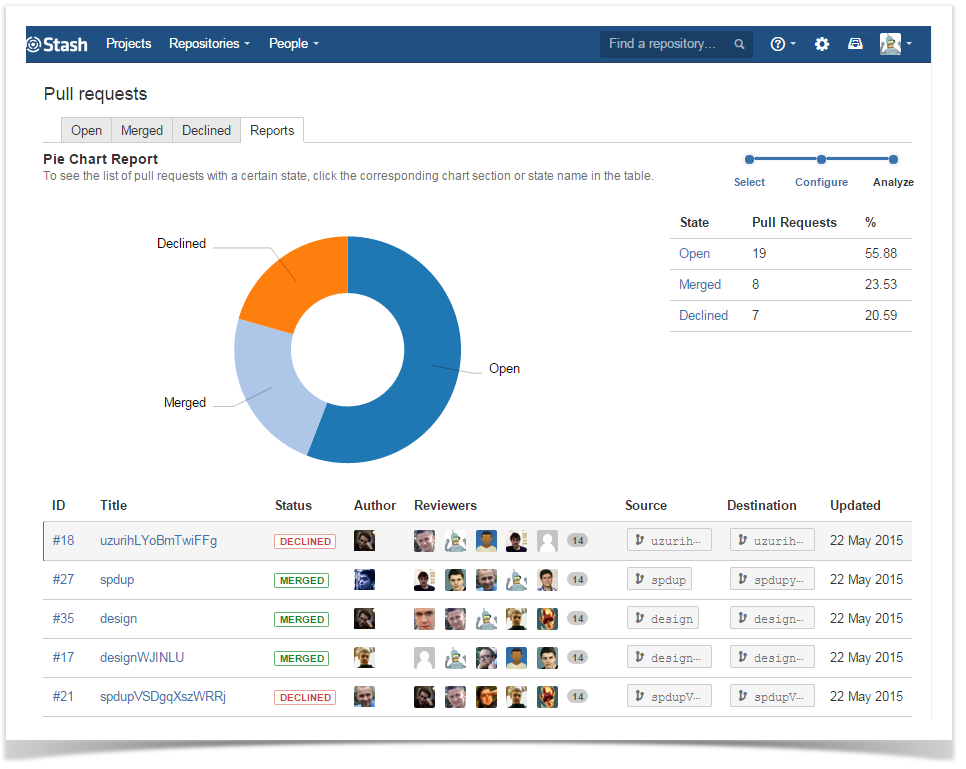
To the right of the pie chart, there is a table showing the number of pull requests that correspond to each author (reviewer, pull request state , or destination branch or source branch).
Below the pie chart, you can see the table with the details of pull requests. Initially, it includes all pull requests. To see only the details of pull requests with a certain author (reviewer, pull request state , or destination branch or source branch), click the corresponding chart section or row in the table located to the right of the chart.
ss
Created vs Merged Pull Requests Report
...
- Navigate to the repository of your choice.
- Choose Pull requests> Reports> Created vs Merged Pull Requests Report.ss
Set the period of created and merged pull requests.
Select how to group pull requests. Choose one of the options:
- daydays
- weekweeks
- monthmonths
- yearsyear
ss7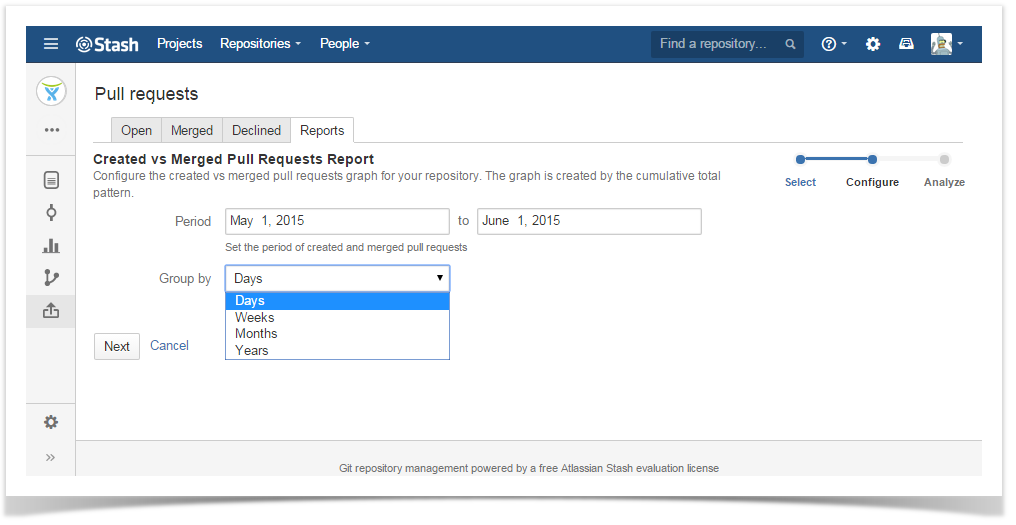
Click 'Next'.
Once configuration is done, you will see something like this:
ss8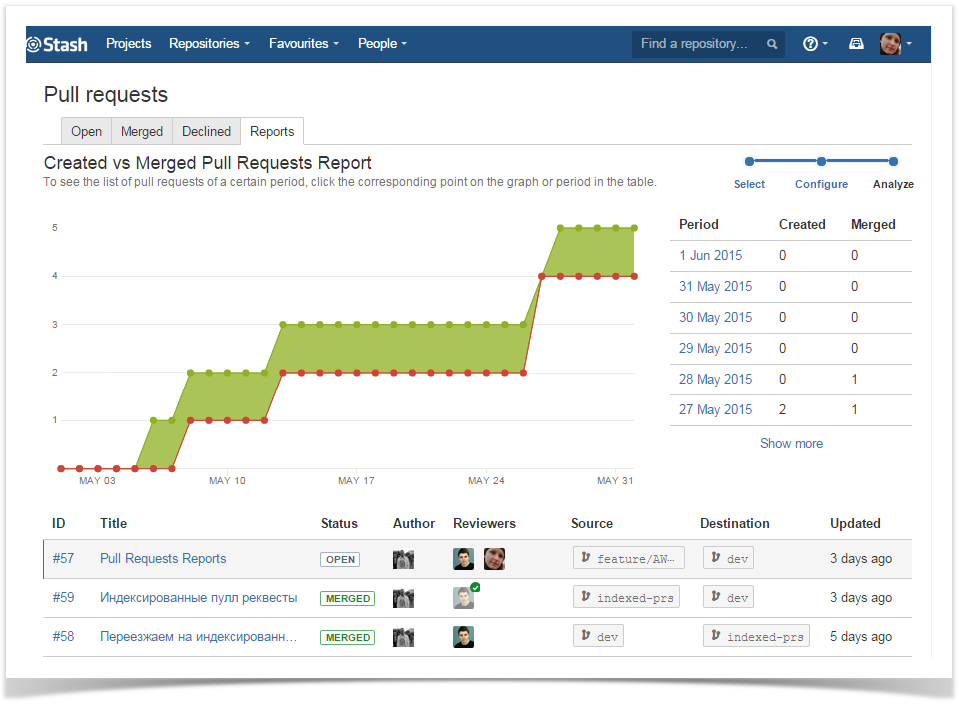
Graphs' areas in red show periods where more pull requests were created than merged. Areas in green show periods where more pull requests were merged than created. The graph is created by the cumulative total pattern, which means data is progressively added to the preceding period.
To the right of the graph, there is a table showing the number of created and merged pull requests that correspond to each period.
ss
Below the graph, you can see the table with the details of pull requests. Initially, it includes all pull requests. To see only the details of pull requests until a certain period, click the corresponding point on the graph or row in the table located to the right of the graph.ss