...
Chart Parameters
These parameters determine the procedure of chart generation on Confluence page. The set of parameters
| Parameter | Default | Compatible with | Description | ||
|---|---|---|---|---|---|
| Row Labels | None |
| The column containing labels for data values.
| ||
| Values column | None |
| The column containing numerical values for chart generation. | ||
| Dates column | None |
| You can select the column with dates for chart generation. | ||
| Date Format | yy-mm-dd |
| You can specify the date format used in the column with dates. | ||
| Type | Pie | Global | You can select the appropriate chart type. | ||
| Decimal Separator | Point | Global | You can select the decimal separator (either point or comma). | ||
| Height | None (dependable on screen area) | Global | You can define the height of the generated chart. | ||
| Width | None (dependable on screen area) | Global | You can define the width of the generated chart. | ||
| Hide the source table | Disabled | Global | You can hide the table with data and enable display of the chart only. |
Chart Examples
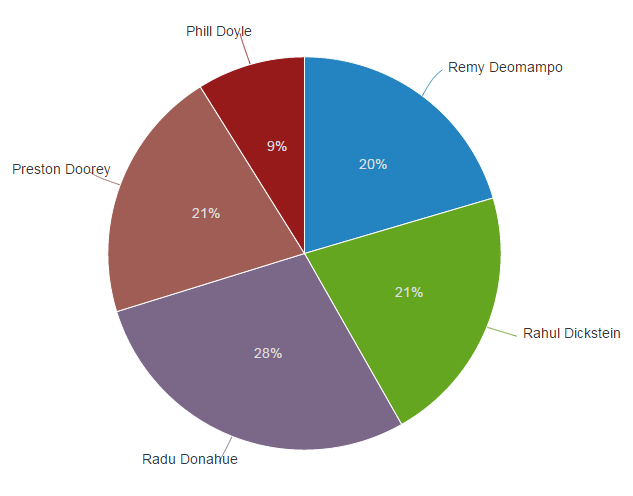
Pie chart
| Parameters in Macro Browser | Data Table in Macro Placeholder | Rendered Chart | ||||||||||||||||||||||||||||||||||||
|---|---|---|---|---|---|---|---|---|---|---|---|---|---|---|---|---|---|---|---|---|---|---|---|---|---|---|---|---|---|---|---|---|---|---|---|---|---|---|
|
|  |
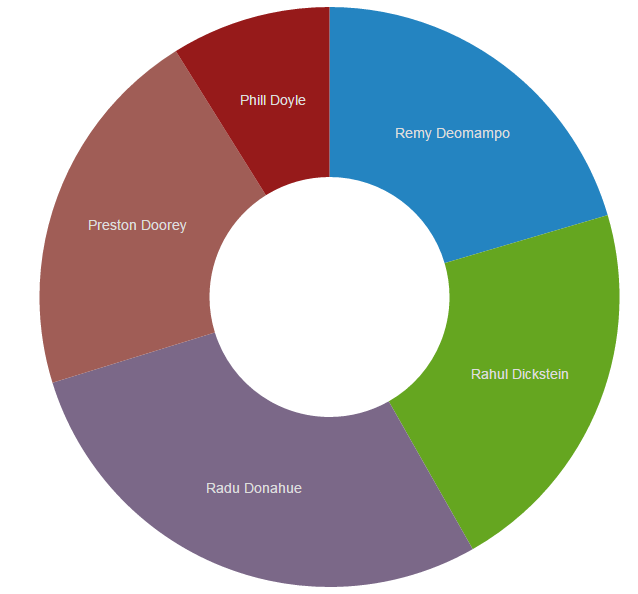
Donut / 3D Donut chart
| Parameters in Macro Browser | Data Table in Macro Placeholder | Rendered Chart | ||||||||||||||||||||||||||||||||||||
|---|---|---|---|---|---|---|---|---|---|---|---|---|---|---|---|---|---|---|---|---|---|---|---|---|---|---|---|---|---|---|---|---|---|---|---|---|---|---|
|
|  |
Line chart
| Parameters in Macro Browser | Data Table in Macro Placeholder | Rendered Chart | ||||||||||||||||||||||||||||||||||||
|---|---|---|---|---|---|---|---|---|---|---|---|---|---|---|---|---|---|---|---|---|---|---|---|---|---|---|---|---|---|---|---|---|---|---|---|---|---|---|
|
| |
d