| Info | ||||||||
|---|---|---|---|---|---|---|---|---|
This page contains both free and paid features. Paid features are available only under a commercial or evaluation license and are tagged with
|
There are project and repository Contributors graphs.
To view the project Contributors graph:
- navigate to the project of your choice
- click Graphs on the left-hand sidebar
- select the Contributors page in the Graphs tab
To view the repository Contributors graph:
- navigate to the repository of your choice
- click Graphs on the left-hand sidebar
- select the Contributors page in the Graphs tab
or
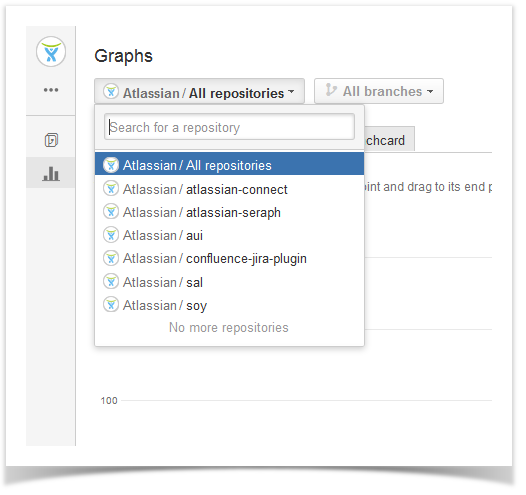
- while browsing the Contributors graph of a certain project, select one of its repositories from the Repository Selection drop-down menu with the list of all the repositories of the current project:
In the Contributors tab you can see, in the upper part, Summary Graph representing the number of total contributions (commits/additions/deletions) made to the repository over a certain time span grouped by day/week/month; and, in the lower part, all repository Contributors with their:
...