| Info | ||||||||
|---|---|---|---|---|---|---|---|---|
This page contains both free and paid features. Paid features are available only under a commercial or evaluation license and are tagged with
|
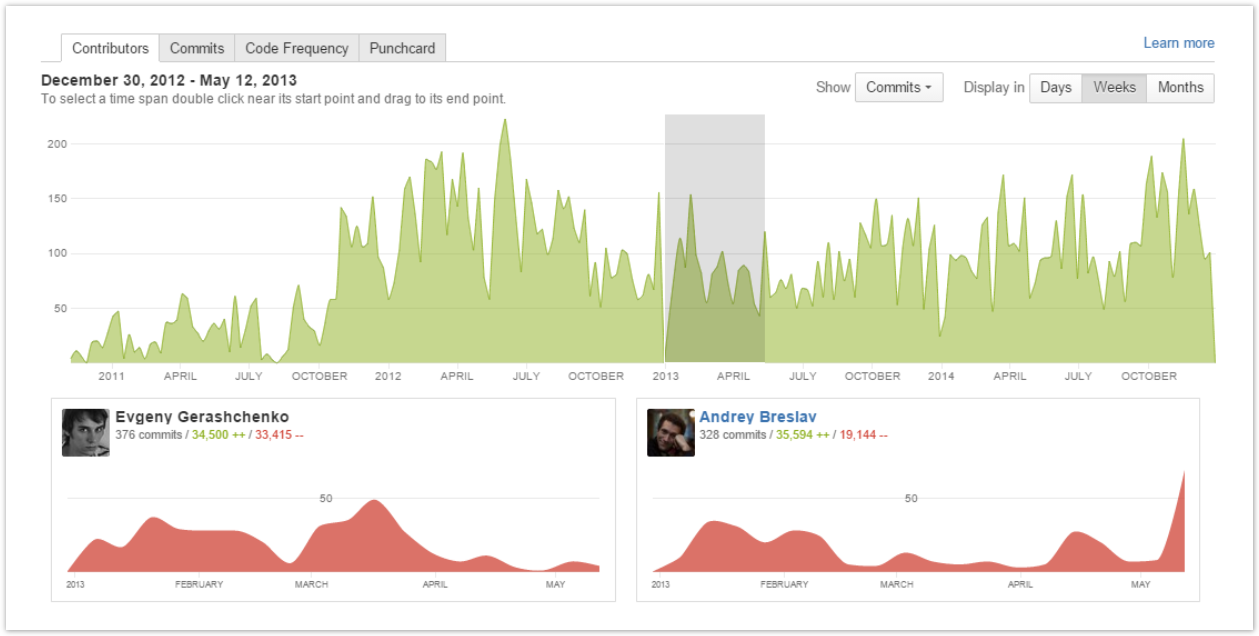
In the Contributors tab you can see, in the upper part, Summary Graph representing the number of total contributions (commits/additions/deletions) made to the repository over a certain time span grouped by day/week/month; and, in the lower part, all repository Contributors with their:
- personal contribution graphs (small graphs below the summary graph) representing their individual contributions filtered according to the current summary graph settings (contribution type; time span; by day/week/month);
- total of commits;
- total of lines of code added;
- total of lines of code deleted by contributor.
There are project and repository Contributors graphs.
| Talk | ||
|---|---|---|
|
View the project graph
To view the project Contributors graph:
| Status | ||||||
|---|---|---|---|---|---|---|
|
- navigate to the project of your choice
- click Graphs on the left-hand sidebar
- select the Contributors page in the Graphs tab
View the repository graph
To view the repository Contributors graph:
- navigate to the repository of your choice
- click Graphs on the left-hand sidebar
- select the Contributors page in the Graphs tab
or
Also while browsing the Contributors
...
graph of a certain project, you can select one of its repositories from the Repository Selection drop-down menu with the list of all the repositories of the current project
...
. Learn more Status subtle true colour Blue title PAID
...
In the Contributors tab you can see, in the upper part, Summary Graph representing the number of total contributions (commits/additions/deletions) made to the repository over a certain time span grouped by day/week/month; and, in the lower part, all repository Contributors with their:
- personal contribution graphs (small graphs below the summary graph) representing their individual contributions filtered according to the current summary graph settings (contribution type; time span; by day/week/month);
- total of commits;
- total of lines of code added;
- total of lines of code deleted by contributor.
Activity Type
To choose what activity (commits, additions or deletions) to display in the summary graph navigate to the Show menu and select one of the options from the drop-down list.
...