| Excerpt | ||
|---|---|---|
| ||
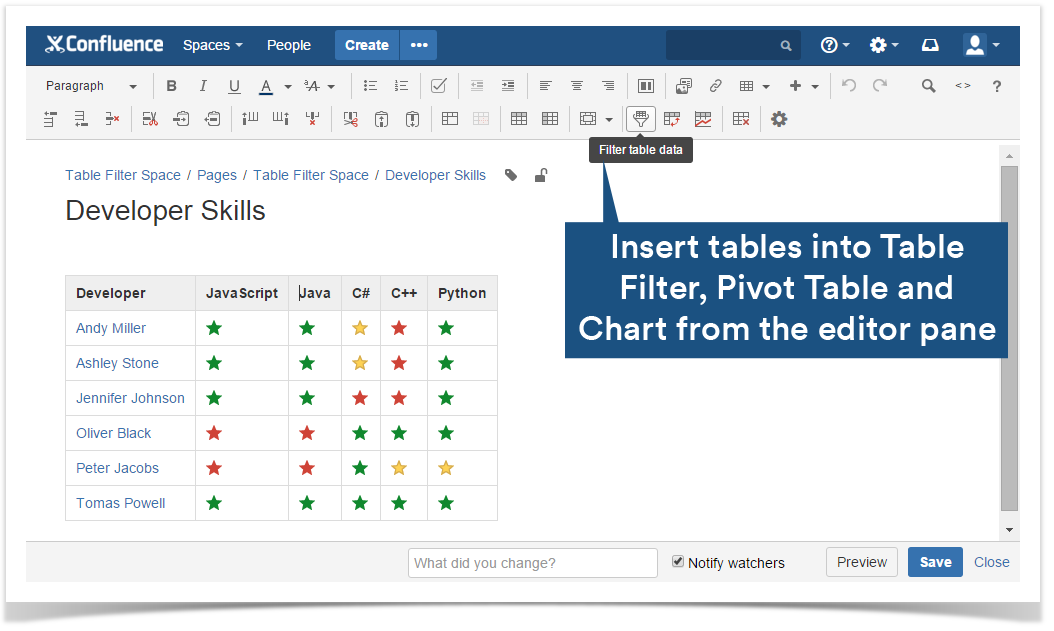
Added the icon filter and direct insertion of tables into macros |
New in this release
Added a capability to filter emoticons and images in table cells.
...
Now you can easily embed your tables into the appropriate macro at once.
The new version of add-on also includes the following features:
- Optimized display of data labels for Pie and Donut charts.
- Added options allowing users to adjust display options for charts: hide / show the grid for Line and Area charts, hide / show the legend, set the appropriate scale step, specify minimal and maximal values for axes, and add the titles for axes and charts.
- Added automatic grouping of small data values when displaying Pie and Donut charts.
- Added a capability to define the appropriate table data orientation for chart generation.
- Added a capability to apply the appropriate alignment to the chart.
- Added a capability to filter table by entering @currentUser.
- Updated the way of configuring X and Y values for Line and Time Line charts.
- Corrected the order of chart bars/columns and labels in the legend.
- Added a capability to insert the table export the filtered tables with images to PDF and Word files.
Fixed in this release
- Resolved the issue with the incorrect positioning of the mouse pointer in the first filter dropdown box when opening the page on Confluence 5.9.
- Resolved the issue with the incorrect positioning of data value hints when hovering over the data labels for Pie and Donut charts.
