| Info | ||||||||
|---|---|---|---|---|---|---|---|---|
This page contains both free and paid features. Paid features are available only under a commercial or evaluation license and are tagged with
|
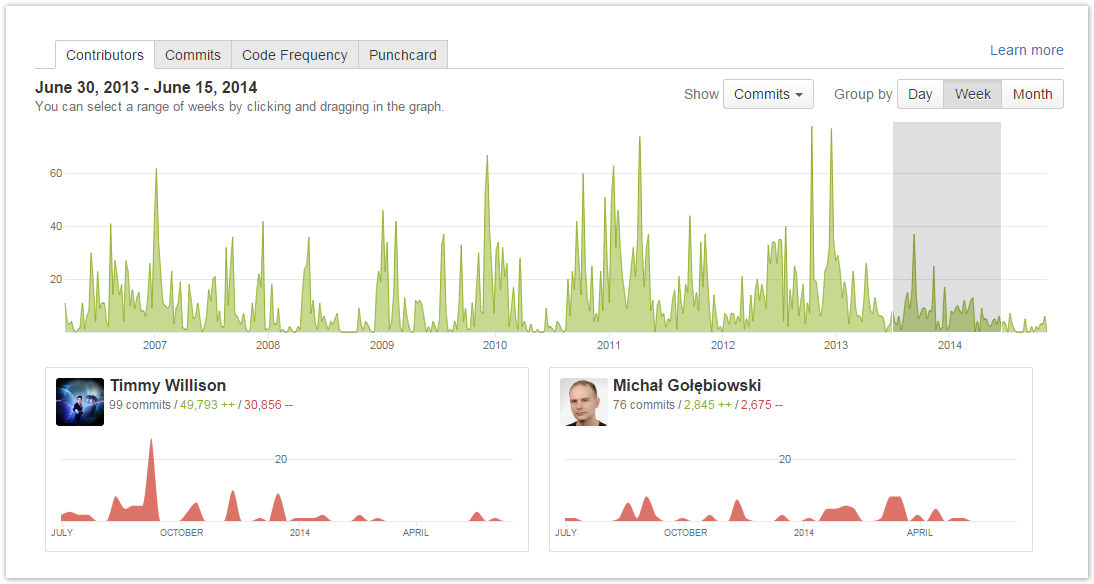
In the Contributors tab you can see,
The Contributors tab shows you:
| Talk | ||
|---|---|---|
|
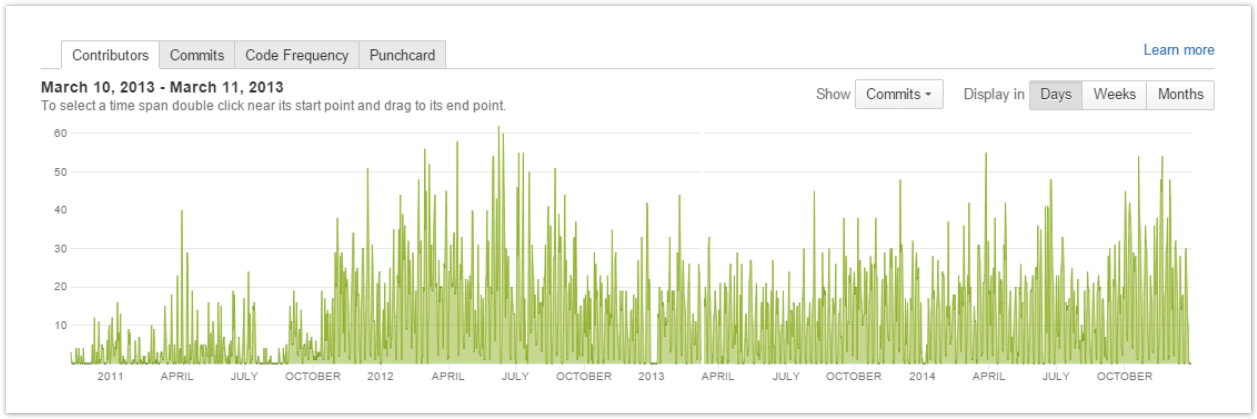
in the upper part, Summary Graph representing the
...
number of
...
total contributions (commits/additions/deletions) made to the repository over a certain time span grouped by day/week/month; and, in the lower part, all repository
...
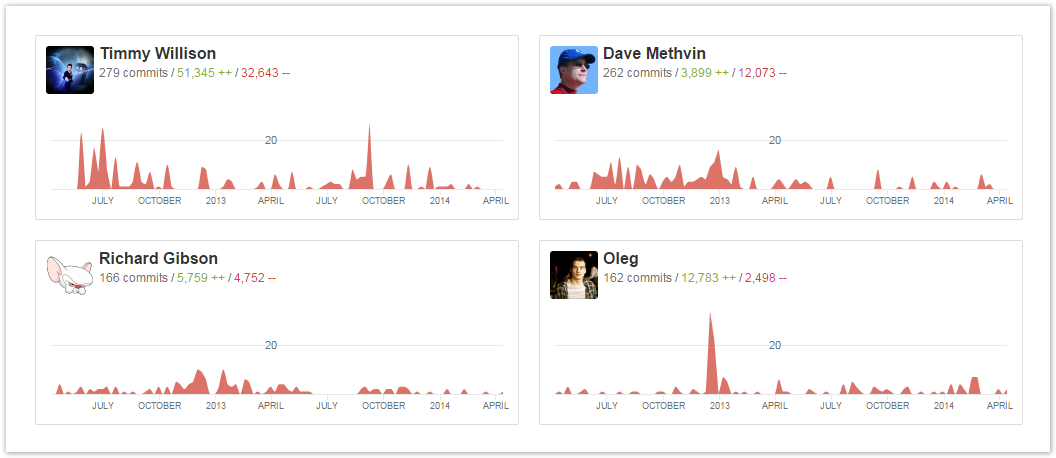
Contributors with their:
- personal contribution graphs (small graphs below the summary graph) representing their individual contributions filtered according to the current summary graph settings (contribution type; time span; by day/week/month);
- total of commits;
- personal activity graphs and a total of lines of code added (green) and deleted (red) by commiter.
Talk id talk-309
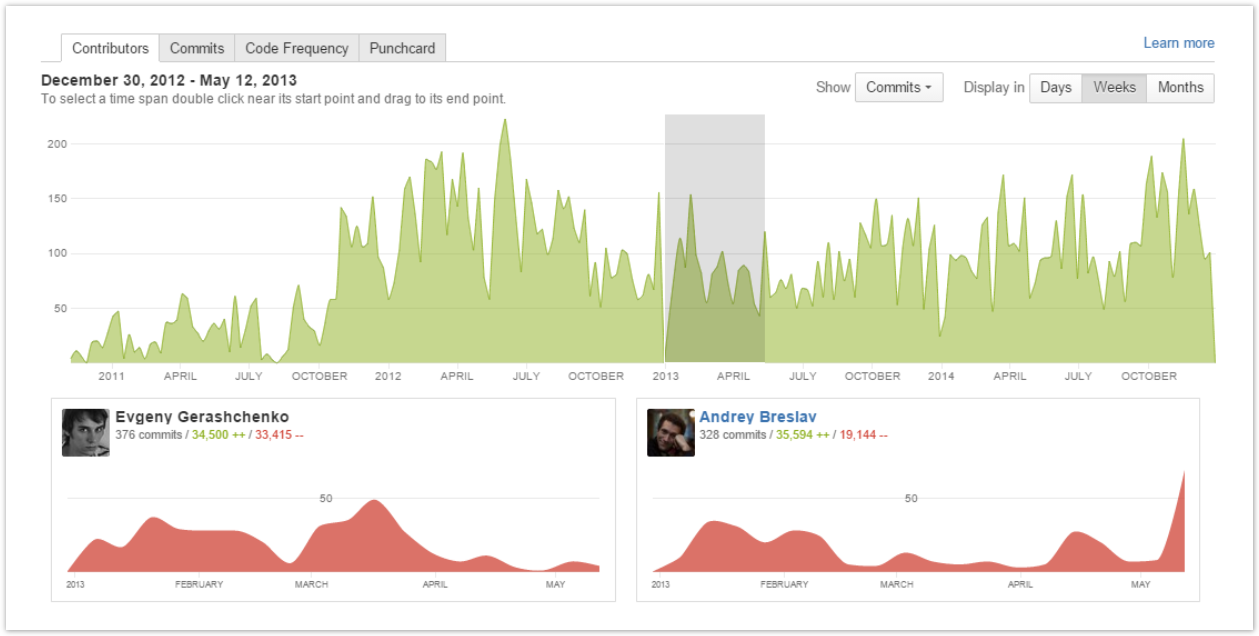
Time Span
| Talk | ||
|---|---|---|
|
You can drag across the graph to show contributor statistics for a certain period of time (this feature is available as a part of the Advanced pack).
Activity Type
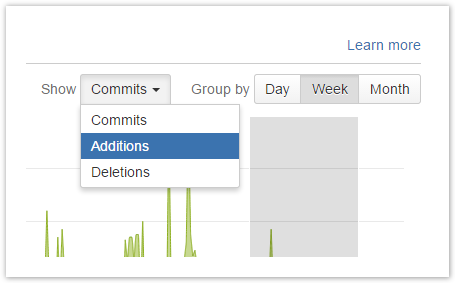
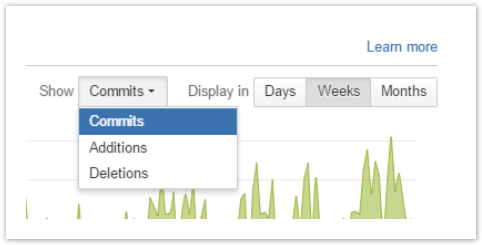
In the Show menu, you can choose whether commits, code line additions or deletions should be displayed in the general graph.
| Talk | ||
|---|---|---|
|
| Talk | ||
|---|---|---|
|
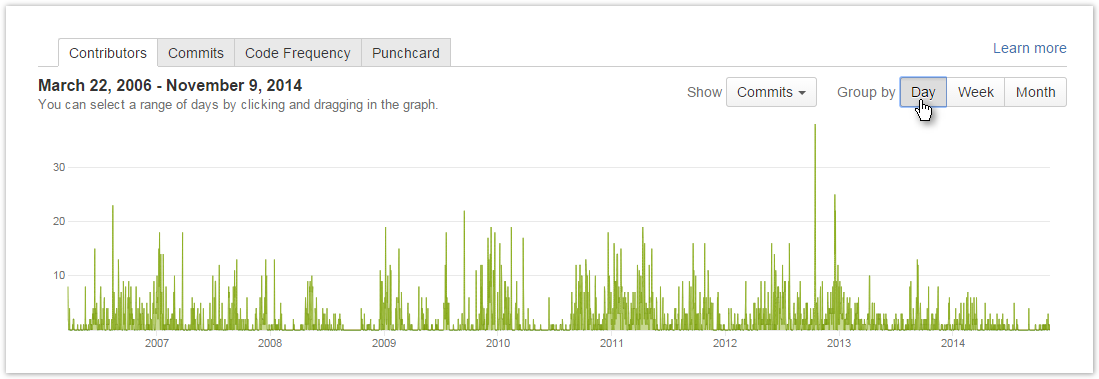
Grouping Criteria
| Talk | ||
|---|---|---|
|
Click one of the Group by buttons to select a grouping criterion (day, week or month) for contributions. This feature is available as a part of the Advanced pack.
| Talk | ||
|---|---|---|
|
- ;
- total of lines of code deleted by contributor.
There are project and repository Contributors graphs.
View the project graph
| Status | ||||||
|---|---|---|---|---|---|---|
|
To view the project Contributors graph:
- navigate to the project of your choice
- click Graphs on the left-hand sidebar
- select the Contributors page in the Graphs tab
View the repository graph
To view the repository Contributors graph:
- navigate to the repository of your choice
- click Graphs on the left-hand sidebar
- select the Contributors page in the Graphs tab
Also while browsing the Contributors graph of a certain project, you can select one of its repositories from the Repository Selection drop-down menu with the list of all the repositories of the current project. Learn more
Activity Type
To choose what activity (commits, additions or deletions) to display in the summary graph navigate to the Show menu and select one of the options from the drop-down list.
Time Span
| Status | ||||||
|---|---|---|---|---|---|---|
|
To select a time span for personal contribution graphs, go to the summary graph, click near the start point of your time span and drag to the end point. Once selected, your time span can be adjusted by moving the selection or dragging start or end points. To deselect, click anywhere outside the selected area in the graph.
| Widget Connector | ||
|---|---|---|
|
Grouping Criteria
| Status | ||||||
|---|---|---|---|---|---|---|
|
To display contributions grouped by whether day, week or month, click one of the Display in buttons.
Contributors List
| Anchor | ||||
|---|---|---|---|---|
|
...
The contributors are ordered by value specified in the Show menu. For example, if Commits is chosen, contributors are ordered by a the number of commits they made in the repository.

...