| Excerpt | ||||||||
|---|---|---|---|---|---|---|---|---|
| ||||||||
This release adds Commit Graph . Aggregated and aggregated statistics across of all branches of a repository. New look of the Contributions graph and activity stream.
|
New in this release
- Commit Graph was added to visualize development flows of your repositories.
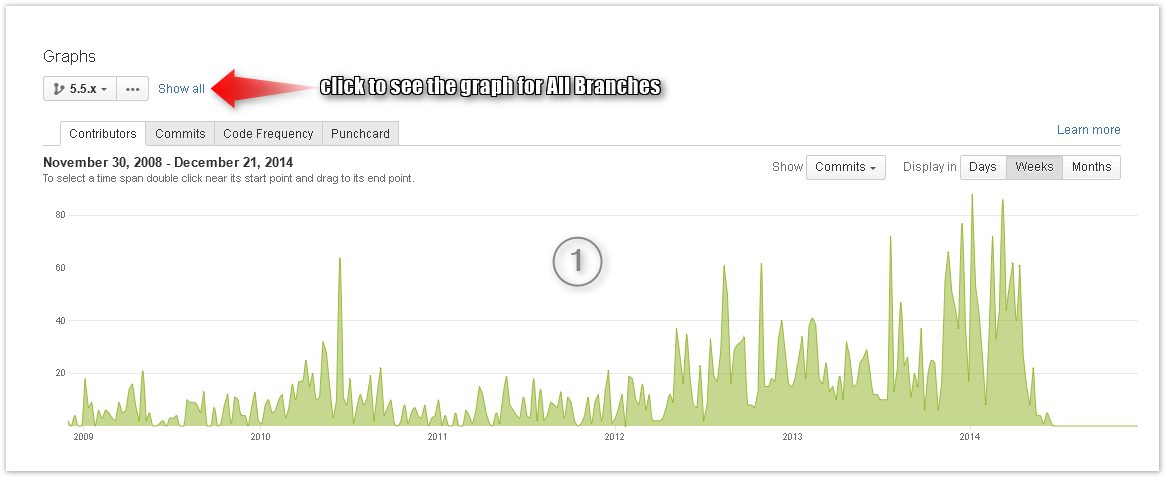
- Now it's possible to aggregate statistics of all branches of a repository for the Contributors, Commits, Code Frequency graphs and charts and Punch Cards.
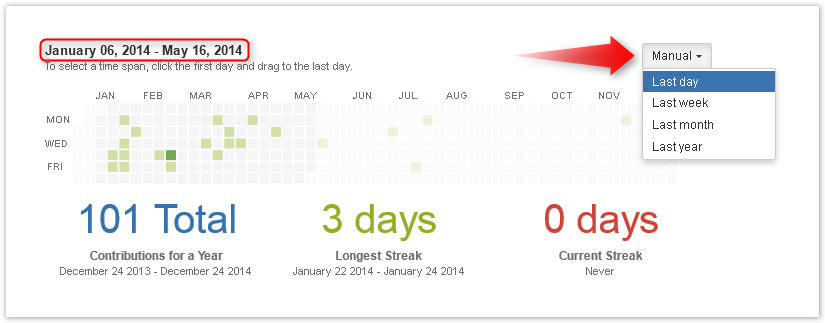
- The Contributions graph now has the Time Span filter
and displays the start and end dates of the current time spanThe Time Span filter of Contributions Graph was modified. Now when you open Contributions you can see the Activity Stream for the last year right away.Talk id talk-360 - Lozenges Add, Modify, Delete are now subtle in the Contribution Activity Stream under the below Contributions graphGraph.
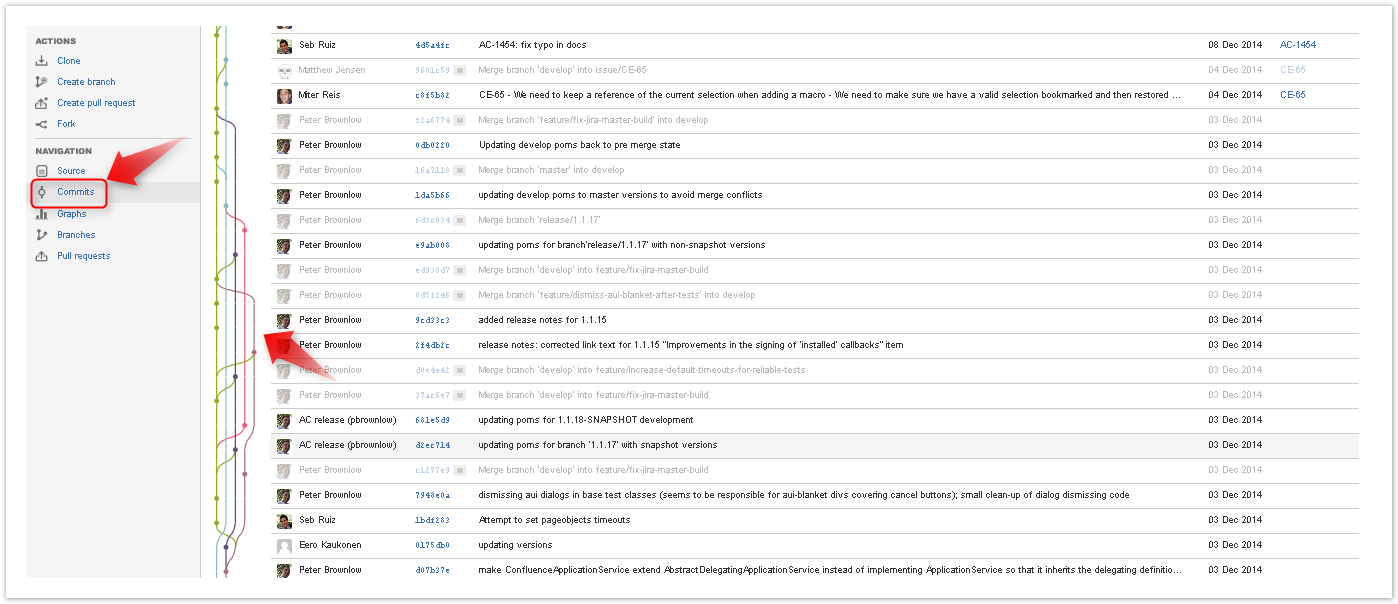
Commit Graph
We added a new awesome graph into our package. It's long-awaited Commit Graph aka Network Graph. Now you can:
- visualize development flows (branches, merges, commits) of your Git repositories;
- see the merge history and the relationships between commits;
- make sense of your branches history.
It's free for first 50 commits. To get Commit Graphs for more than 50 commits, a commercial license is required.
Commit Graph is newly added. At this point you can view it, but not interact with it yet. Advanced functionality is to come.
If you have any feedback or requests concerning this feature, please, let us know.
Talk

Aggregated Statistics across ALL Branches of a repository
Before, the Contributors, Commits, Code Frequency graphs and charts and Punch Cards were being created based on the statistics about additions, deletions, commits, pull requests, code lines with regard to time stamps within ONE branch. Now it's possible to have all that based on the joint statistics of ALL branches in a repository.
Analysis, tracking, planning and adjusting using Awesome Graphs improved significantly with the ability to get graphs, charts and punch cards with the aggregated data of a superior level – all branches of one repository.
talk
| id | talk-362 |
|---|


The Contributions graph got more
informativeflexible
The Contributions graph is a more flexible tool now. We added the Time Span filter
| Talk | ||
|---|---|---|
|

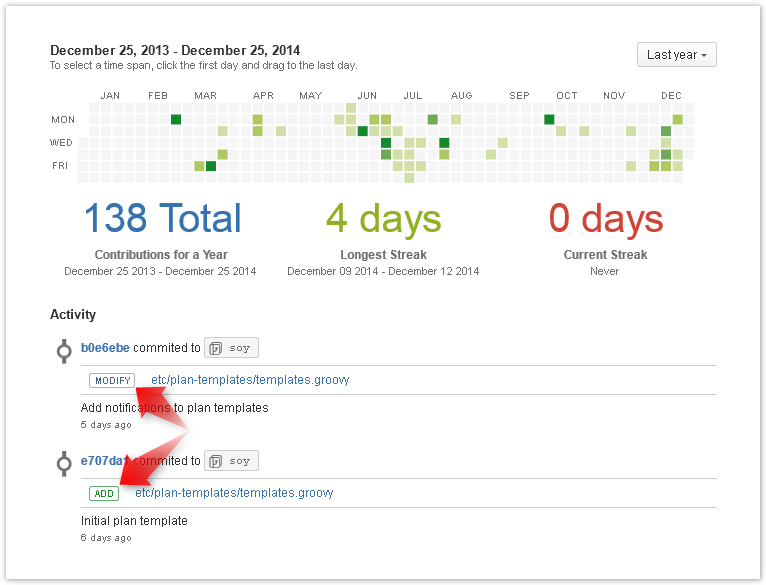
Contributor's Activity Stream got more user-friendly
For you to have a better user experience, we made the statuses look the way you are used to. Change Type lozenges (add, modify, delete) are now subtle in the activity stream of the Contributions graph, which complies to Atlassian Designer Guidelines.

| Aui button | ||||
|---|---|---|---|---|
| ||||
| Talk | ||||
|